Downloaded 353 times


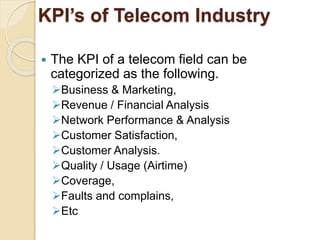
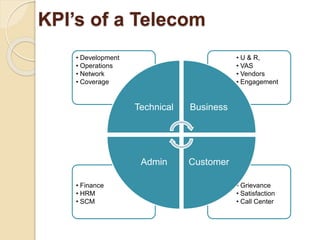
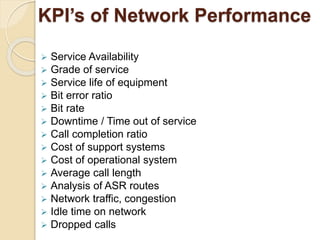
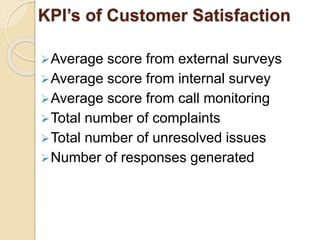
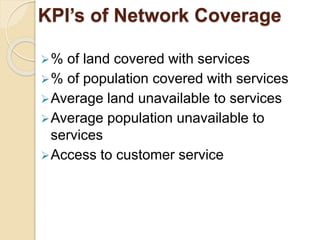

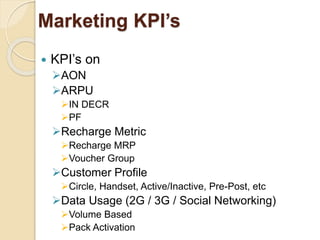
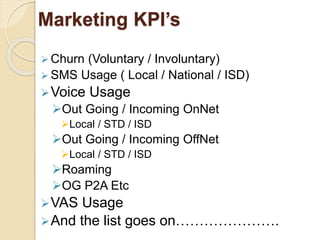
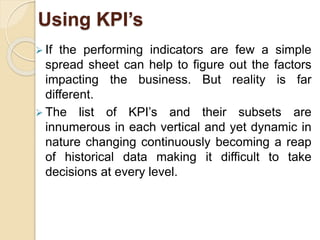


The document discusses the role of Key Performance Indicators (KPIs) in the telecom industry, emphasizing their importance in measuring performance, making data-driven decisions, and improving customer satisfaction. It categorizes various KPIs related to business processes, network performance, customer satisfaction, and marketing, outlining the necessity for real-time business intelligence to enhance operational efficiency. Additionally, it stresses the need for actionable insights derived from accurate, timely data to support strategic decision-making in a competitive environment.


![제 23회 보아즈(BOAZ) 빅데이터 컨퍼런스 - [MBOAX] : ABSA를 활용한 소비자 반응 분석 기반 운영 효율화 대시보드 설계](https://cdn.slidesharecdn.com/ss_thumbnails/3-1boaz23rdconferencemboax-260203102709-9d519923-thumbnail.jpg?width=640&height=640&fit=bounds)


