Download to read offline


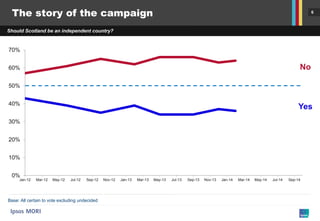
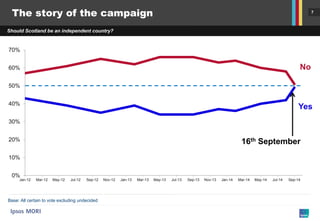
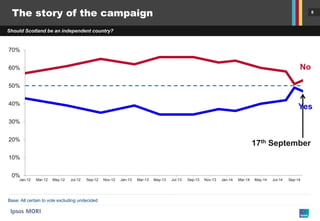
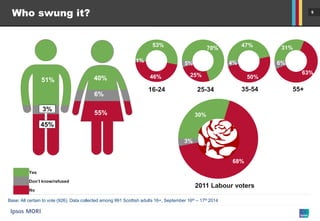
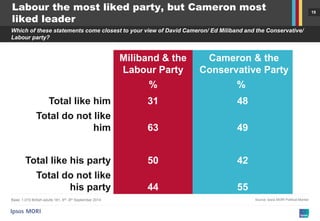
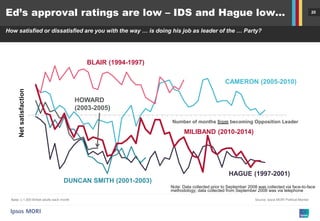
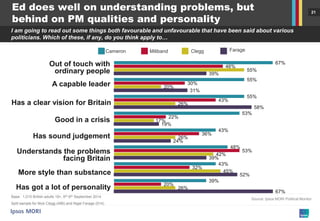


The document discusses the political landscape leading up to the 2015 general election in the UK, focusing on public sentiment towards independence for Scotland and the performance of major political parties. It provides insights into voter opinions, including concerns around the economy and immigration, and highlights demographic trends in voter support for different parties. Additionally, it presents statistical data from Ipsos Mori on political preferences and projected election outcomes.


