Download to read offline

![© Ipsos MORI / King’s College London
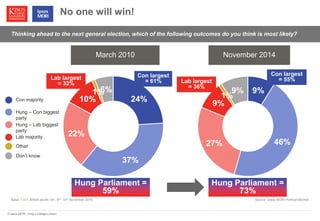
2%
19%
24%
26%
23%
6%
2%1 0%
24%
23%
31%
11%
3%
23%
28%
24%
14%
7%
Strongly
disagree
Neither
agree nor
disagree
Government distrusted at all levels
How strongly, if at all, do you agree or disagree with each of the following
statements? “[xxx] acts in the best interests of people like me”
Base: 1,967 British adults 16+, 26 September – 3 October 2014 Source: Ipsos MORI
Strongly
agree
Tend to
disagree
Don’t know
Tend to
agree
Local government UK Government European Parliament
21%
49%
26%
38%
12%
54%](https://image.slidesharecdn.com/dearwestminsterweneedtotalk-141210053443-conversion-gate02/85/Dear-Westminster-We-need-to-talk-9-320.jpg)
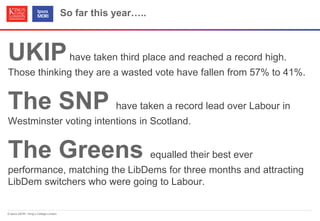

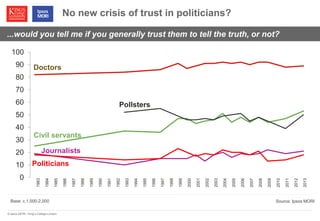


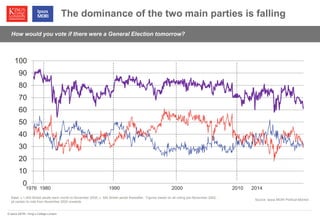
This document discusses declining trust in and attachment to political parties and institutions in the UK. It finds that younger generations feel less connected to political parties than older generations. Trust in politicians has declined long-term. Support for third parties like UKIP and the Greens is rising as the dominance of Labour and the Conservatives falls. The public is increasingly divided on issues like the structure of government and the welfare state. The document concludes that the 2015 UK general election may see no party winning an outright majority due to these trends in public opinion.


