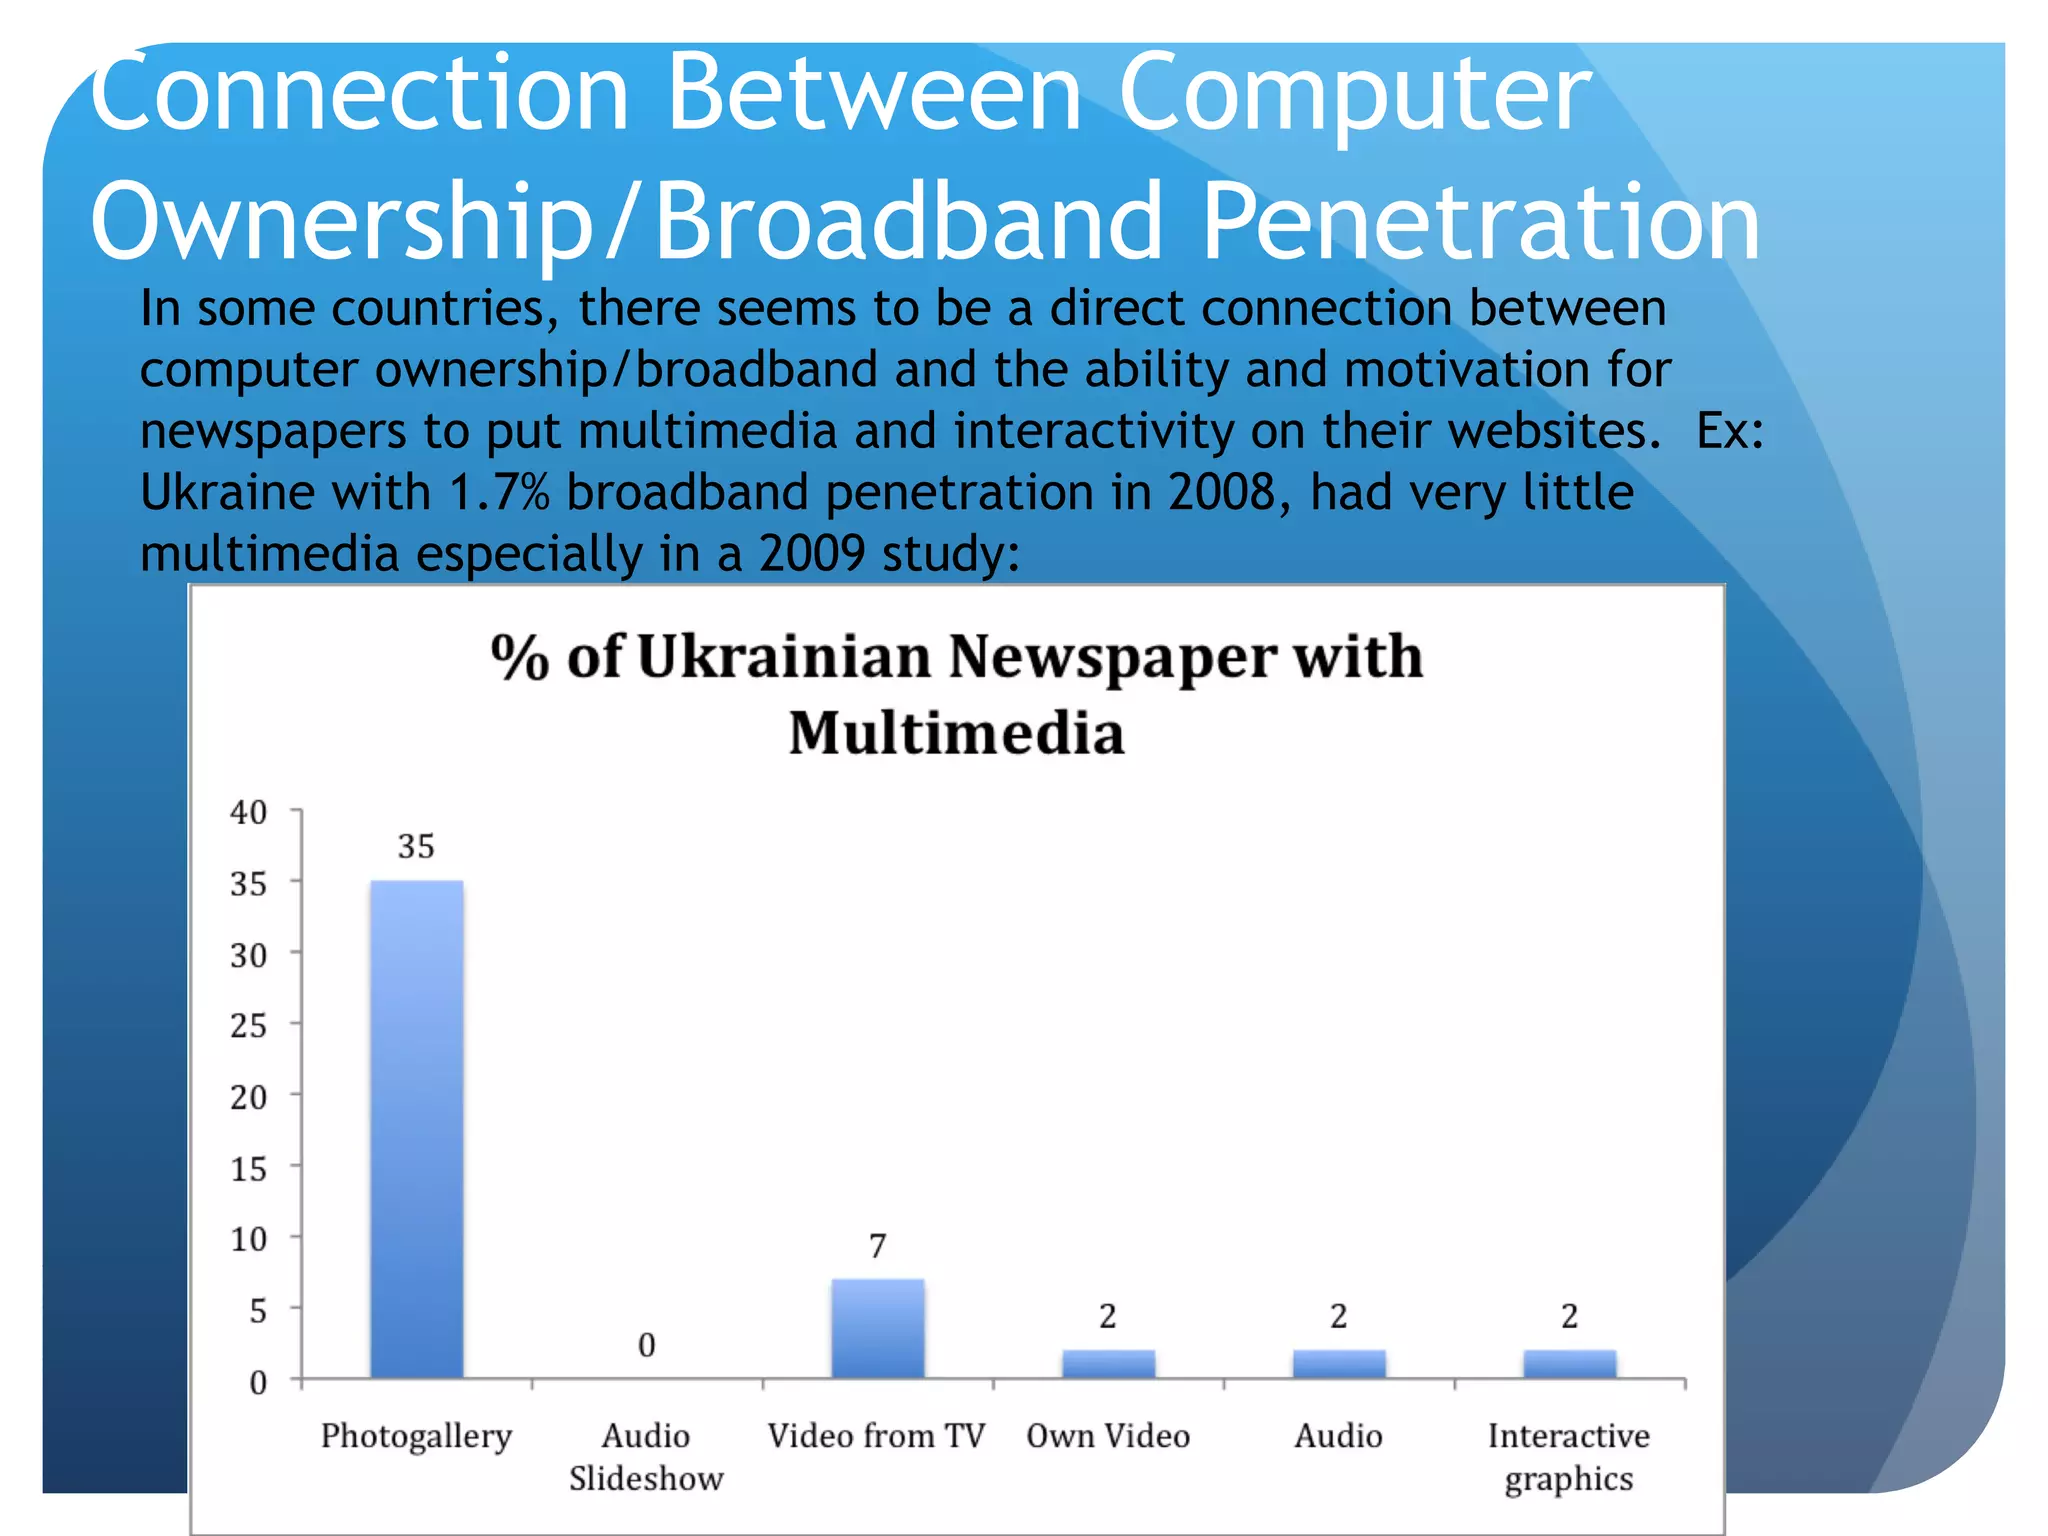
Multimedia and Interactivity on Newspaper
Websites:
A Multi-Study Analysis of Six English-Speaking
Countries
Robert Bergland
Lisa Crawford
Sarah Noe
David Hon
Online Journalism Symposium 2010
Problem/Purpose of study
Shortage of studies which compare different countries
Different methodologies used in various studies makes
true country-to-country comparisons problematic
Goal: To examine several countries using a similar
methodology
Brief Literature Overview
Some key newspaper website studies:
• Peng et al 1999 survey and 80-site analysis
• Greer & Mensing’s 1997-2003 U.S. longitudinal study
• Sparks, Young and Darnell 2003 analysis of 113 Canadian news
sites
• Bivings Group’s 2006 Top 100 circulation U.S. papers
• Hashim et al 2007 study of 12 Australian newspapers
• Russial’s 2009 survey of 210 U.S. daily newspapers
Research Questions
RQ1: What are the levels of interactivity and multimedia within
the individual countries?
RQ2: What impact does circulation have on presence of
interactive/multimedia features?
RQ3: How do these countries compare in their newspapers’ use
of multimedia/interactivity?
RQ4: Is there a connection between computer
ownership/broadband in the countries and their newspapers’ use
of these features?
Methodology
Looked at top six English-speaking countries where
English was the first/dominant language: U.S., UK,
Canada, Australia, Ireland, New Zealand
 Survey methodology (a la Russial) was considered, but
dismissed: Concerns over response rate, reliable contact
information, cost, time
Chosen method: One-pass website analysis employed by
Bivings Group, Darnell/Sparks/Young
Methodology
●
Process
Team reviewed literature, examined websites to create 25-feature taxonomy for
U.S. 2007 study; added 7 features in 2008 study of the other countries
Compiled lists of newspapers for each country from Editor and Publisher directory
Used random sampling of U.S. papers (360, every fourth, of 1437 U.S. dailies),
with a +/- 4.5% margin of error
Used all of newspapers from other countries, eliminating duplicate sites (Note: only
12/60 Australian papers coded in time window)
Conducted pilot/inter-rater reliability test (95% in 2007; 96% in 2008) of 10
websites
Coded data over a one-month period
Number of Newspapers studied
US: 360* (Random sample—25%)
UK: 117
Canada: 100
Ireland: 9
New Zealand: 24
Australia: 12* (of 60)
General categories
Sample Spreadsheet
Results: Impact of Size
U.K./Ireland Newspapers Sites
Results: Impact of Size
U.S. Newspapers Sites
Results: Impact of Size
Canadian Newspapers Sites
(blue under 50K; red over 50K)
Results: Multimedia
Results: Multimedia
Results: Multimedia
Results: Multimedia
Results: MM/Interactivity
Results: Interactivity
Results: Distribution
Connection Between Computer
Ownership/Broadband Penetration
In some countries, there seems to be a direct connection between
computer ownership/broadband and the ability and motivation for
newspapers to put multimedia and interactivity on their websites. Ex:
Ukraine with 1.7% broadband penetration in 2008, had very little
multimedia especially in a 2009 study:
Connection Between Computer
Ownership/Broadband Penetration
• Not much of a connection in English-speaking
countries studied
• U.S./U.K. numbers were fairly similar in many
categories
--Too little difference in CO/BP to judge, esp
given year gap
• Canada, with highest % of computer ownership
and higher than U.S. broadband, had some of the
lowest rates of multimedia/interactivity
• New Zealand did show some connection, with
the lowest rates of CO/BP and also the lowest
amount of multimedia/interactivity
Computer Ownership 2006
Broadband Penetration 2008
So what explains the difference?
Perhaps
• Economic Factors: Resources
-Personnel
-Equipment/Software
• Economic Factors: Ownership/chains
• Social Factors--Computer usage and
expectations of users
• Focus of management
• Journalism education/training
Limitations of study/Future research
Weakness of content analysis vs survey
One-pass vs multipass—might not have
viewed site on typical day
Redo study in 2011, looking at all sites
during the same period for equal comparison

Bergland

  • 1.
        Multimedia and Interactivityon Newspaper Websites: A Multi-Study Analysis of Six English-Speaking Countries Robert Bergland Lisa Crawford Sarah Noe David Hon Online Journalism Symposium 2010
  • 2.
    Problem/Purpose of study Shortageof studies which compare different countries Different methodologies used in various studies makes true country-to-country comparisons problematic Goal: To examine several countries using a similar methodology
  • 3.
    Brief Literature Overview Somekey newspaper website studies: • Peng et al 1999 survey and 80-site analysis • Greer & Mensing’s 1997-2003 U.S. longitudinal study • Sparks, Young and Darnell 2003 analysis of 113 Canadian news sites • Bivings Group’s 2006 Top 100 circulation U.S. papers • Hashim et al 2007 study of 12 Australian newspapers • Russial’s 2009 survey of 210 U.S. daily newspapers
  • 4.
    Research Questions RQ1: Whatare the levels of interactivity and multimedia within the individual countries? RQ2: What impact does circulation have on presence of interactive/multimedia features? RQ3: How do these countries compare in their newspapers’ use of multimedia/interactivity? RQ4: Is there a connection between computer ownership/broadband in the countries and their newspapers’ use of these features?
  • 5.
    Methodology Looked at topsix English-speaking countries where English was the first/dominant language: U.S., UK, Canada, Australia, Ireland, New Zealand  Survey methodology (a la Russial) was considered, but dismissed: Concerns over response rate, reliable contact information, cost, time Chosen method: One-pass website analysis employed by Bivings Group, Darnell/Sparks/Young
  • 6.
    Methodology ● Process Team reviewed literature,examined websites to create 25-feature taxonomy for U.S. 2007 study; added 7 features in 2008 study of the other countries Compiled lists of newspapers for each country from Editor and Publisher directory Used random sampling of U.S. papers (360, every fourth, of 1437 U.S. dailies), with a +/- 4.5% margin of error Used all of newspapers from other countries, eliminating duplicate sites (Note: only 12/60 Australian papers coded in time window) Conducted pilot/inter-rater reliability test (95% in 2007; 96% in 2008) of 10 websites Coded data over a one-month period
  • 7.
    Number of Newspapersstudied US: 360* (Random sample—25%) UK: 117 Canada: 100 Ireland: 9 New Zealand: 24 Australia: 12* (of 60)
  • 8.
  • 9.
  • 10.
    Results: Impact ofSize U.K./Ireland Newspapers Sites
  • 11.
    Results: Impact ofSize U.S. Newspapers Sites
  • 12.
    Results: Impact ofSize Canadian Newspapers Sites (blue under 50K; red over 50K)
  • 13.
  • 14.
  • 15.
  • 16.
  • 17.
  • 18.
  • 19.
  • 20.
  • 21.
  • 22.
  • 23.
    Connection Between Computer Ownership/BroadbandPenetration In some countries, there seems to be a direct connection between computer ownership/broadband and the ability and motivation for newspapers to put multimedia and interactivity on their websites. Ex: Ukraine with 1.7% broadband penetration in 2008, had very little multimedia especially in a 2009 study:
  • 24.
    Connection Between Computer Ownership/BroadbandPenetration • Not much of a connection in English-speaking countries studied • U.S./U.K. numbers were fairly similar in many categories --Too little difference in CO/BP to judge, esp given year gap • Canada, with highest % of computer ownership and higher than U.S. broadband, had some of the lowest rates of multimedia/interactivity • New Zealand did show some connection, with the lowest rates of CO/BP and also the lowest amount of multimedia/interactivity
  • 25.
  • 26.
  • 27.
    So what explainsthe difference? Perhaps • Economic Factors: Resources -Personnel -Equipment/Software • Economic Factors: Ownership/chains • Social Factors--Computer usage and expectations of users • Focus of management • Journalism education/training
  • 28.
    Limitations of study/Futureresearch Weakness of content analysis vs survey One-pass vs multipass—might not have viewed site on typical day Redo study in 2011, looking at all sites during the same period for equal comparison