
Recommended
More Related Content
What's hot
Similar to Investigating gender differences in OpenStreetMap activities in Malawi
Similar to Investigating gender differences in OpenStreetMap activities in Malawi (20)
Recently uploaded
Recently uploaded (20)
Investigating gender differences in OpenStreetMap activities in Malawi
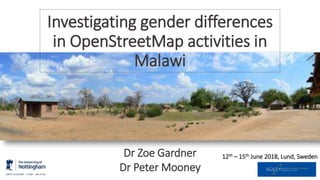
- 1. Investigating gender differences in OpenStreetMap activities in Malawi 12th – 15th June 2018, Lund, SwedenDr Zoe Gardner Dr Peter Mooney
- 2. Background: Gender biases in OpenStreetMap (OSM) 4% 96% • Previous studies: 96% of all edits in OSM are made by men (Budhathoki, 2010) • However little emphasis on the impact of the bias on the data • The study is unique as it links user demographics (here gender) to recorded behaviours • Develops earlier analysis (Gardner et al. 2018) of gendered mapping behaviours in OSM
- 3. Methodology 1: Selecting Malawi • 20 OSM users selected informed by the results of the global survey • A small and immature OSM dataset •Enabled creations of new data as well as modifications to existing edits •Enabled the exploration of OSM activity in context of humanitarian mapping
- 4. August 2017: Online survey of 297 OSM users – gender + username Access to HDYC Data: Sample set identified Access to Malawi datasets in OSM: user specific edits Methodology: 3 step process
- 6. August 2017: Online survey of 297 OSM users – gender + username Access to HDYC Data: Sample set identified Access to Malawi datasets in OSM: user specific edits Methodology: 3 step process
- 7. 87 13 Gender OSM contributor profiles: Global sample The average female contributor is 10 years younger than the average male contributor and more are educated to graduate and post-graduate level 37 27 0 10 20 30 40 Median Age
- 8. The average female contributor is 15 years younger than the average male contributor and more are educated to graduate level OSM contributor profiles: Malawi sample 80 100 0 20 40 60 80 100 120 Educational Background 27 42 0 10 20 30 40 50 Median Age
- 9. Higher proportion of highly ranked/active women in the Malawian dataset OSM contributor profiles: Malawi sample 9 7 7 2 0 2 4 6 8 10 12 14 16 18 >100 >1000 Gendered activity: volume of edits
- 10. Results 1: Gender differences in editing 0 500 1000 1500 2000 2500 Median edits 0 5000 10000 15000 20000 25000 30000 35000 40000 45000 Highest ranked edits Men are statistically more active than women median edits: 2090:282 Edits of highest ranked users: 39691:1627
- 11. Results 2 cont’d: Gender differences in editing
- 12. Results 2 cont’d: Gender differences in editing
- 13. Results 2: Gender differences: tagging Significantly less activity for men and women in tagging These statistics support an emphasis on editing over tagging 61692 1574701 Number of edits to Malawi dataset Nodes Ways 1090 60197 Edits by Malawi sample users Nodes Ways
- 14. Discussion 1: Humanitarian OSM (HOTOSM) in Malawi • Results must be considered in the context of Humanitarian OSM (HOTOSM) • For 17 users (85%; 9 women, 8 men) largest changeset was for an HOTOSM task (indicated by #tasknumber) • HOTOSM tasks mapping activity to support the improved response to and prevention of humanitarian crises including meeting the SDGs (Red Cross, UN, Aid agencies and NGOs) • Features disproportionately on OSM Task Manager (7th June 2018: 62 Tasks)
- 16. Source: HOTOSM Team State of the Community Report 2017 Discussion 2: The Impact of Prescriptive Mapping (HOT Tasks) • 42% of participating members were resident in the global north (not countries likely to be subject of HOTOSM and therefore remote mappers) i.e. remote mappers • Aerial imagery precludes a range of tags i.e ‘name=‘ or ‘house number=‘ • Tagging unlikely to be requested by HOT Tasks (especially ‘landuse=‘ or ‘name=‘) • Positive correlation between number of ways and prescriptive (HOTOSM) mapping
- 17. Discussion 3: Humanitarian mapping and gender • A recent study of Humanitarian OSM community members showed a higher proportion of female contributors than the wider OSM community at 29% (compared to estimates for OSM which range between 3 and 13%) 69 29 HOTOSM – Gender breakdown Men Women 93 7 OSM - Gender breakdown Men Women
- 18. Summary, conclusions and further work • Men significantly more active than female counterparts (supports Gardner et al, 2018) • Men more active in the modification of edits (focus on geometric accuracy) • Men create more tags (women more involved in HOT tasks which demand few tags; men potentially more skilled with resources for remote tagging) • Women motivated by intrinsic (humanitarian) reward which suggests a model for widening participation • Repeat analysis for a mature urban dataset (i.e. Europe and N. America) currently underway
Editor's Notes
- Zoe From NGI Analysis of a small subset of data from a global survey of osm users I conducted last year For a wider study looking at the impacts of demographic biases on actual OSM edits for which some results have already been shared
- To give some back ground to the study Previous studies have found a strong male participation bias in OSM (as much as 96%) none have so far explored the direct impact of this bias on actual edits which is what we’re doing here with the use of some osm user survey data that we collected last year.
- So this is the location and boundary of Malawi in southern Africa. And what we did was to select 20 users which the survey data told us were known to have made edits to the Malawian dataset Given its relatively small size and immaturity it served as a blank canvas to examine the creation of brand new edits as well as modifications to existing edits.
- The findings here resulted from a 3 step methodological approach: Online demographic survey of OSM users: So in august last year we launched an online survey for osm users, which we disseminated via the osm user diaries and five english language talk lists. Over a 4 week period this returned 326 responses. This was refined to 297 after duplications, errors etc were removed. In the survey, as well as 5 demographic indicators we asked respondents to also provide their username. And it was this piece of data which differentiates the survey from other similar studies as having contributors usernames enabled us to access 2 further sources of information firstly the how did you contribute to OSM wiki page a set of pre-collated osm user statistics collated and curated by Pascal Neis. And from here we were able to identify a sample set of users [click on]
- So if we just take a look at the bottom of this gives page you get a list of all the countries in which a user has made edits and how many edits that user has made. And you can see here circled in red, this user has made quite a few edits in Malawi So what we did was go through the list of users and selected 20 users – 10 men and 10 women – that had made at least 50 edits to the Malawi OSM database
- So the third step in the process, having downloaded the OSM history file for Malawi, these users edits were extracted and statistically analysed from the dataset.
- So just to take a look at the demographics firstly for the wider global sample: And throughout the presentation for simplicity in the graphs I’ve used pink for women and green-blue for men! Of the 297 users in our sample 39 were women and 258 were men which broke down as shown in the pie chart on the left – 13% women and 87% men. Comparing this to earlier estimates of between 95 and 98% this suggests a higher osm participation rate for women, which could be the case given the 5 year time lapse since these earlier estimates were made but could also be due to sampling error as users were self-selecting. In terms of average age of our users, the average female contributor was 10 years younger then the average male by 10 years. If we look at the top right bar graph we’ve got the median age for women at 27 and for men its 37. In terms of educational background, if we look at the lower right graph women had higher median levels of attainment. So more women were educated to either graduate or post-graduate level with 95 and 73% respectively whereas for men these figures were 54 and 21%. So what these collective statistics tell us is that the average female contributor is 10 years younger and more likely to be educated to a higher level.
- If we now take a look at our Malawi sample of users and their demographic profiles We can say that it generally mimics the average profile of the global sample but it's slightly different. The average age of female users is again 27 but for men this has gone up to 42. In terms of educational background, even more of the female sample – 100% - are educated to at least graduate level with this figure for men at 80%. These figures suggest there may be a correlation between gender, age, educational background and humanitarian mapping and this is something I’ll touch on this later in the talk. The data also suggests firslty the sample is representative of the users that have contributed to the Malawi osm database overall and also there are some highly active contributors. And we can tell this from the ranking values of the number of edits users have contributed. At the time of analysis 8921 had contributed to the Malawi database and if we just look at the raw data…
- We also know that we have some high ranking female contributors in our dataset as if we look at this graph we can see that 9 have made over 1000 edits and we know that this means that 9 of our sample deature in the top 2% of contibutors to the malawian dataset overall.
- So moving on to the results, we’ve split these in to two different categories of behaviour editing – which measures the creation and modification of nodes and ways and tagging which meansures the addition of feature tags or labels. So starting with the editing, again the results replicate those for the global dataset set out in our earlier paper in that men are statistically more active than their female counterparts. And we can look at some simple statistics for this: Firstly, looking at the left hand graph and the median edits, men have edited an average 7.5 more objects than women; and in the righ hand graph the top ranked male has edited 24 times as many objects than the highest ranked female.
- The other stand out point here is that significant differences were observed between genders in the editing of nodes. This is observed because our Malawian sample of women are not tagging nodes at all and this can be seen quite starkly if we look at the raw data …you’ll see that women have created no new nodes. Although the figures are also quite sporadic for men (in the bottom half of the column) 8 out of the 10 male users have made contributions in this category of edits.
- A further observation in gendered editing habits relates to the modification of data. If we look at these four highlighted columns and particular the bottom half which relate to men’s edits we can see that men have many more edits in all four of these categories. We also considered three further variables which relate to changes in the geometry of edits and which also showed significantly more edits for men. so the fact that men are more active in making changes is therefore suggestive of a male interest in accuracy.
- So if we move on to look at tagging – which is where users add particular labels to map features, there is significantly less activity for this in the Malawi dataset overall for both men and women. If we take the Malawi dataset overall, looking at the left hand pie chart here, as of Feb 7th 2018 the OSM Malawi database contained apx 1.6 million edits. Just under 4% of these were, so a very small proportion. If we look at the right hand pie chart which is all of the Malawi edits by our sample of users around 2% are nodes. So In Malawi there is clearly an emphasis on way creation (so roads and buildings) over the labelling (or tagging) of features.
- So what do all these statistics mean and how might they be explained. As well as in the context of wider gender dimensions in VGI we can look at these results in the context of humanitarian mapping initiatives in Malawi, specifically Humanitarian OpenStreetMap as for 17 of the 20 users in our sample their largest group of edits (or changeset) was made for a HOTOSM task HOTOSM is a branch of OSM which on behalf of aid agencies creates online mapping tasks compiled on the ‘tasking manager’ site for completion by registered OSM users for the purposes of supporting both the improved response to and the prevention of humanitarian crises. Malawi features disproportionately in the Tasking manager. When I checked this last week there were 62 tasks for Malawi, whereas other comparable African countries ranged from around 5 to 25. The only other country with more tasks was the Philippines with around 75.
- So to illustrate the prescriptive nature of HOT tasks we can look at a screenshot of a task listed in the tasking manager. And we can there’s a set of instructions which include, details on what to edit at the top, and then use of changeset hashtags, sources of data and specific features to edit. So its highly instructive and to some extent will mask the natural inclinations and behaviours of ‘normal’ online mapping.
- And if we look in a little more detail the way humanitarian mapping works, given the the often remote locations that form the subject of HOT tasks and where the socio-economic status of society may preclude the participation of the local community, these tasks are often performed remotely using aerial imagery. And we can see from this hot map image on the left, which was created by the HOTOSM State of the Community report published last year, that an aggregate 42% of HOT members are resident in the global north, i.e. countries unlikely to be the focus of HOTOSM activities and therefore geographically remote from the locations they are mapping. This mind of mapping, by its very nature precludes the attribution of amenity tags such as ‘name’ or ‘house number’ which is unlikely to be visible in sources such as aerial imagery, which along with the instructions of what to edit , to some extent may account for the low level of tagging.
- Just looking at the relationship between humanitarian mapping and gender... The HOTOSM State of the community report I mentioned erlier, reported a 29% female participation rate. This figure could be as much as 25% higher than the same estimates for the wider OSM project. So these figures suggest intrinsic reward may playa role in female participation in humanitarian mapping. Despite increased female participation in humanitarian mapping, the tagging results suggest women’s lack of knowledge, skills, experience or confidence may affect the levels of detail or accuracy they are able to provide with their edits. And several other studies have found women experience a range of other specific barriers to participation.
- So to summarise, this paper has presented the results of a small study of users to the Malawian OSM dataset The results replicate those observed at the global level in that men are significantly more active than their female counterparts; they are more active in the modification of data and also in the creations of feature tags The increased participation of women in humanitarian mapping activities and the implication of intrinsic motivations may suggest a potential model for the recruitment of women to online mapping generally but other barriers that have been found to impact on women’s participation would also need to be addressed. Finally, this small study serves as a foundation for a much larger study with a mature urban dataset currently underway and the results of this will help to contextualise and quantify the results found here and the influence of humanitarian mapping in Malawi.