Downloaded 314 times


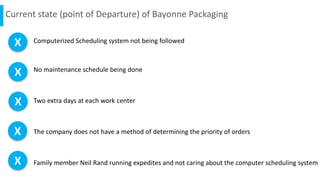


Bayonne Packaging is a specialty packaging company experiencing delivery delays and quality issues leading to financial losses. Their computerized scheduling system is not being followed properly. Various work centers are underutilized and experiencing high set-up times. Rush orders by the owner's family member disrupt the schedule. Implementing recommendations like prioritizing orders, improving maintenance, increasing capacity, and introducing an ERP system could help address these issues.


