The document discusses production problems at Donner Company, which manufactures printed circuit boards. It analyzes time and utilization data from their standard production process. There are positive correlations between order size/time to complete orders and negative correlations between order size/time spent per board. The company is not considering time per board when estimating delivery dates. Mr. Plummer notices several issues: machines are idly more than expected; goals and time standards are not being used; and quality and delivery problems exist. Specific actions are needed to address these problems.
Manzana Insurance is the second largest insurance company founded in California in 1902. • They operated through a network of autonomous branch offices in California, Oregon and Washington. Each branch is treated as a separate profit and loss centre. • Manzana does not directly interact with public but instead has its 2000 agents who represents Manzana. • Fruitvale was one of the Manzana’s smaller branches, with 3 underwriting teams and 76 agents. Our case concern is the falling performance and hence the profitability on Property Insurance for this branch.
In August 2000, P&G introduced one of its kind product Crest Whitestrips, readily available online and through dentist offices
P&G claims that the new products are 10 times more effective than the Colgate Tartar Control Whitening Within two years P&G captured more than 80% of the share market. Colgate made a come back in August 2002 with Simply White. Colgate’s USP was that it focused on convenience and lower price. One month after introduction Simply White captures half the market with Crest Whitestrips losing 50% of its market share.
Forecast uncertain demand products
Choose the suitable place for production
Better forecast
Use both quantitative + qualitative method
Analyze historical data => forecast future trend
Use weighted factors (weighted average independent forecasts)
Shorten forecasting duration
Challenges
Inaccurate forecasts of retailer demand has become a major issue at Obermeyer. The two major factors that made this task more difficult was the increase in product variety and intense competition in market. Second challenge the company had faced was to allocate production between Hong Kong and China. Although Obermeyer had 1/3 of Parka production in China for 1992, this year the organization insisted on increasing the sales to half. There was difference in quality and labor rate at China and Hong Kong which made allocation decision more difficult.
Another challenge the company faced was the larger lead time. The company had supplies of raw materials from various countries which resulted in delayed production time. Organization challenges along with competition from competitor companies were major challenges the company had faced.
Analysis
From the sales predictions that the six managers forecasted, a coefficient of variation (COV) was determined, which indicated the level of spread of the forecasted data. The COV values were broadly divided into two levels, the low risk group and the high risk group. Every value below 0.2 were considered to be among the lower risk items and all the items above COV value of 0.2 were considered to be of higher risks. Once the risk levels of each item were determined, the quantities of items to be produced in first and second production cycles could be calculated with least risk. 70% of the entire sales forecast for the lower risk items were ordered to be produced. Only 30% of higher risk items were ordered to be produced in the first production cycle. The quantities which amounted to 1200 were manufactured in China and that which were close to 600, were manufactured in Hong Kong in the first production cycle.
Once the 80% of the orders were received from the retailers from the Vegas show, a clear picture of the demand forecast could be obtained, according to which the rest of the items could be manufactured either in China or Hong Kong. Referring to exhibit 1, the four products to be produced in China in the first production cycle are: Assault, Seduced, Entice and Electra. These four products have COV less than 0.2. However Gail, Daphne, ISIS, Anita, Teri, Stephanie are produced in Hong Kong for the first production cycle as they have a high level of risk associated with it.
Conclusion
Short term operational changes
o Decrease lead time by obtaining raw materials from geographically closer locations to ensure timely delivery
Long term operational changes
o Cross scaling Chinese labors which would help the company produce quality and reliable goods at a cheaper price
Operation Management:-Systematic direction, control, and evaluation of the entire range of processes that transform inputs into finished goods or services.
Presentation by Larsson, Ögren, Troll and Jäger - Winners of Beat The Elite 2011CBS Case Competition
Presentation by Larsson, Ögren, Troll and Jäger - Winners of Beat The Elite 2011 and all students at Copenhagen Business School. Congratulations to Elin Larsson, Max Josef Jäger, Svenja Troll and Hanna Ögren. Presented on March 4, 2011.
This presentation form part of CBS Case Competition. Views, opinions and suggestions expressed in these presentations are the sole work of the case study writers, and are not neccessarily shared by H&M
Visit www.casecompetition.com to see more.
Presentation by National University of Singapore - Winners of CBS Case Compet...CBS Case Competition
Presentation by National University of Singapore - Winners of CBS Case Competition 2011. Congratulations to Caroline Ng, Candice Lim, Peh Che Min, and Tobias Chen. Presented at the Finals March 4, 2011.
This presentation form part of CBS Case Competition. Views, opinions and suggestions expressed in these presentations are the sole work of the case study writers, and are not neccessarily shared by H&M
Visit www.casecompetition.com to see more.
The 2013 Deloitte Undergraduate Case Competition challenged students to develop strategy, technology, and human capital recommendations for MAD HATS, a company that donates a hat to a person in need for each hat purchased by one of their customers.
This is a template that MBA or undergraduate business students can use for case study presentations for class or case competitions. It's bare bones, meant to explain the flow of information and suggest some frameworks to use to discuss the problem in a case.
What is cycle time in the manufacturing processMRPeasy
Cycle time is often confused with throughput time and takt time, but it is nevertheless a separate manufacturing performance indicator used to measure the duration of specific production processes and to get vital insight into your production efficiency.
Read more from here.
#throughputtime #cycletime #keyperformanceindicators #productionefficiency #mrpeasy #manufacturing #manufacturingsoftware #mrpsystem #erpsystem #manufacturingprocess
CENTRE FOR CONTINUING EDUCATION EXECUTIVE MBA (OIL & .docxarnit1
CENTRE FOR CONTINUING EDUCATION
EXECUTIVE MBA
(OIL & GAS MANAGEMENT)
BATCH: _______________________
SEMESTER: _______________________
NAME: _______________________
SAP NO/REGN NO: _______________________
ASSIGNMENT – 1
FOR
Operations and Materials Management
MBCQ -722
UNIVERSITY OF PETROLEUM & ENERGY STUDIES
Last Date of Submission:-15th April 2012
Section‐A
(Short Answer Questions) Marks: 4×5=20
1. For the following organizations, explain how their operations functions can support business
strategy, implement business strategy and drive business strategy:
‐ a fast‐food restaurant
‐ a film‐processing service
‐ an oil refinery.
2. Why is operations management relevant to managers in other organization functions?
3. Using an example of your own choice, describe how the cost of the operation might be affected by
changing the levels of performance of quality, speed, dependability and flexibility.
4. Draw the hierarchy of operations for a small manufacturing company.
Section‐B
(Long Answer Questions) Marks: 3×10=30
1. A company which specializes in fabricating large lathes inspects every lathe before it is shipped to
the customer’s site. Given below are the defects found on a sample of 10 lathes.
Sample
No.
1 2 3 4 5 6 7 8 9 10
No.
Defects
2 1 0 3 4 2 2 3 4 1
Find whether the processes are under the control for 99 percent defects. Justify your answer
2. A firm is planning to set up a production line to assemble 300 units per hour, and 50 minutes
per hour are productive. The time to perform each task and the tasks that must precede each
task are:
=======================================================================
Task That Time to Tasks That Time to
Immediately Perform Task Immediately Perform Task
Task Precedes (Minutes) Task Precede (Minutes)
‐‐‐‐‐‐‐‐‐‐‐‐‐‐‐‐‐‐‐‐‐‐‐‐‐‐‐‐‐‐‐‐‐‐‐‐‐‐‐‐‐‐‐‐‐‐‐‐‐‐‐‐‐‐‐‐‐‐‐‐‐‐‐‐‐‐‐‐‐‐‐‐‐‐‐‐‐‐‐‐‐‐‐‐‐‐‐‐‐‐‐‐‐‐‐‐‐‐‐‐‐‐‐‐‐‐‐‐‐‐‐‐‐‐‐‐
A ‐‐ .69 F B 1.10
B A .55 G C,D,E .75
C B .21 H G,F .43
D B .59 I H .29
E B .70
=======================================================================
a. Draw a diagram of precedence relationships.
b. Compute the cycle time per unit in minutes.
c. Compute the minimum number of work stations required to produce 300 units per hour
and find the efficiency of the balance line
3. What is statistical process control (SPC)? Explain why x and R charts are used together?
Section‐C
(Caselets/Situational Questions) Marks: 2×25=50
1. Inventory management in some operations is more than just a part of their responsibility; it is their
very reason for bein ...
Development of fixture_to_reduce_the_cycle_time_of_c_8_griding_machineLaukik Raut
“What a difference a second makes” – a quote from an empowered employee. Just one second over a ten
second continuous cycle can mean your line runs consistently 10% faster, the difference between comfortably
achieving tight production schedules or continually being capacity constrained.[1] This work presents a new
approach for the reduction of process cycle time and its impact on a company's competitive edge. Reduction in
cycle time has been gaining significant attention in recent times. The shorter cycle times effect in higher
consumer satisfaction, lower manufacturing rate, higher yield, and better potential given tool inventory and
facility constraints. This research paper provides a brief review of core approaches related to cycle time and
also describes a methodology for cycle time reduction in any manufacturing and automobile production
industry. It includes the assessment and potential gains of the projected cycle time reduction methodology
The International Journal of Engineering & Science is aimed at providing a platform for researchers, engineers, scientists, or educators to publish their original research results, to exchange new ideas, to disseminate information in innovative designs, engineering experiences and technological skills. It is also the Journal's objective to promote engineering and technology education. All papers submitted to the Journal will be blind peer-reviewed. Only original articles will be published.
Application of value stream mapping tool to reduce wastes in bearing industryijmech
In today’s highly competitive business environment, companies require improvement in Production Lead
Times, costs and customer service levels to survive. Because of this, companies have become more
customers focused. The result is that companies have been putting in significant effort to improve their
efficiency.
This paper present the practical application of Value Stream Mapping (VSM) tool implement in a bearing
industry. A value stream is an assortment of all actions (value added as well as non-value added) that are
required to bring a product through the essential flows, starting with raw material and ending with the
customer. For drawing current state value stream mapping, all relevant data has been collected and analyzed. Then analysis of current state map has been done for identifying non-value adding activities, in
other words waste and suggestions on how to remove or reduce different wastes. From the results achieved
by current VSM, it was observable that the two processes Annealing and CNC Machining have higher cycle
time and WIP. In order to increase their capacity, their cycle should be reduced.
By implementing some lean principles and changes in the production line, the future state map was created and the reduction the different types of wastes reduced. The total processing time was reduced from 409
seconds to 344 seconds.
Read the full presentation of the Research Paper presented at the International Conference on Extrusion and Benchmark, organized by the University of Bologna (October 3-5th 2011).
Evidence based time and costs savings for die makers and extruders.
Reduce die knock-off rate and die trials in press thanks to Thango®, the new SW-HW integrated system for die designs and correction feedbacks management, remote correction support.
PRODUCTION PROCESS ANALYSIS ON MANUFACTURING OF HYDRAULIC GEAR PUMPmeijjournal
Manufacturing Firms sometimes suffers from Productivity, Low Production rate and Delivery problems. Production time is the top priority at every manufacturing firm, and each firm wants to minimize it as much as possible to deliver their product on time to time their valuable customers. Some of the biggest time eaters in the industry are Setup time, Manufacturing time, Material handling time, and wait time. After the brief survey at VBC Hydraulics, we have conclude that setup time, manufacturing time, and wait time can not be utilize more than current because they are already using best possible machines and technology to manufacture Gear Pumps. But, material handling time and man-machine utilization can be improved by some engineering analysis. We did man-machine utilization by using man-machine utilization charts and some brief calculations and also focused to improve the material handling in the industry by implementation of GT(Group Technology) layout as they are mainly focused to manufacturing of Gear Pumps of different specifications with bulk Production.
For more classes visit
www.snaptutorial.com
1.
Which of the following is a measure of operations and supply management efficiency used by Wall Street?
Dividend payout ratio
Receivable turnover
Current ratio
Financial leverage
Earnings per share growth
2. What do your excel results tell you?
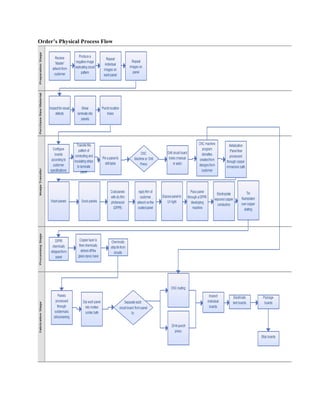
The graphs on the last pages represent the time per order and time per board based on the
standard process flow information in exhibit 2. The order sizes used are 1, 10, 100, 500, and 1000.
In graph 1 there is positive correlation between order size and the time it takes to complete the
order. As the order size increases more time is needed to complete the order.
In graph 2 there correlation between time spent per board and order size is negative. The larger
the order, the less time spent per board is due to avoiding extra setup time along with using the CNC Drill
and CNC Router for the fastest production time.
Donner Company currently promises delivery in three weeks for order less than 1000 boards and
five weeks for larger orders. Graph 1 shows an order of 1000 boards taking approximately 6000 minutes,
(or 100 hours) to complete production. Donner does not consider the time spent per board when
estimating delivery dates and taking large orders. Graph 2 shows for orders larger than 100 the time spent
per board is greatly reduced. Orders greater than 500 boards take less than 7 minutes per board while
orders of 10 boards can take over 380 minutes due to setup time. While Donner Company considers the
number of board per order when estimating the delivery date they also need to consider what other orders
the currently have, the size of their other current orders, and what machinery is being used for the current
productions. Donner Company needs to improve its order scheduling and sync it with the production
process. They need to focus on eliminating idle time and having orders on schedule, ready to be shipped
by the customer delivery date.
Utilization of Operations
To asses a process’s utilization, one must first figure out the amount of time the facility is
available for operations. Second, the amount of time the process is used must be present. In the Donner
Case study we are given data for the total process of manufactured printed circuit boards in September of
1987. In that month there were a total of 30 days, but only 22 were part of the typical work week. Of
those 22 days one was a federal holiday, the 7th was “Labor Day”, leaving 21 days of operations for the
facility.
As per the case study, it is mentioned that there are 22 production employees. With these 22
employees operating in 3 departments with a total of 13 subset process’ it can be assumed that this
company is only operating on a 1 shift schedule, approximately 8 hours a day. The case study explicitly
states that many of employees are “crossed-trained” in multiple departments, so we can also assume that
there are supplement employees to cover during break times. This leads us to conclude that they are fully
functioning the whole 8 hours of each available work day. As previously stated, there were 21 work days
in September of 1987 and with 8 hours of a functioning facility we can calculate that there were 168
hours of availability (21days x 8hr/day).
The usage time of each processes is stated in Exhibit 2 Standard Process Flow of the case study.
To find the utilization of the artwork generation we would simply take the total hours of usage (24.2hrs)
and divide it by the total hours available for the facility (168), [24.2/168=.14404 or about 14.4%]. Now
finding the utilization of the CNC Drill might prove to be a little harder. Since the setup time is “almost
entirely made up of required computer control” we can’t actually uses the total hours figure given to us,
instead we must take the Run Time (9,650mins) and translate it into hours. This gives us a look at the
actual time excluding the initial computer setup [9,650/60 = 160.83 hours]. To find its utilization one
must take the time of use (160.83hrs) and divide it by the total available hours for the month (168hrs). We
can conclude that the CNC Drill operates at a utilization rate of 95.7% [160.83/168]. Similarly, to find the
3. utilization of the CNC Router we ignore the initial computer setup time (for the same reason) and
translate the actual setup time into hours [2,166mins/60 = 36.1hrs]. With the new accurate number of
usage hours (36.1hrs) we can find the utilization rate by dividing that by the total hours of operations in
September of 1987 (168) to find the rate of 21.5% [36.1/168].
For an ideal performance a company should be using whichever process is best suited for each
specific type of order. In this process there are 2 steps that allow us to choose a process to fit an order’s
needs, they are CNC Drill versus the Manual process and CNC Router versus the Punch Press. To be
most effective Donner should be picking the best option from each group, respectively. So we must figure
out at what order sizes the company should choose to use the newer CNC technology. To compare we
need to set up an equation using fixed and variable times.
For the Manual drill, there is a setup of 15min and a run time per hole of .080 (.08 x 500 holes/per
board = 40mins/per board). For the CNC Drill there is a set up time of 240min and run time of .004 per
hole (.004 x 500 holes/per board = 2mins/per board). Next we set the two equations together leaving the
variable of order size(x) [240 + 2*x = 15 + 40*x] → [225 = 38*x] → [225/38 = x] → 5.921 = x. This tells
us that if the order size is about 5.921 or ≈ 6 Donner should use the CNC Drill. But, they are only using it
on orders with sizes over 140 boards totaling 4,825 boards. This leaves a range of order sizes 6-136
totaling 26 orders and 871 boards that would be better suited using the CNC Drill process. Unfortunately,
as previously discussed the CNC drill is operating at a 95.7% utilization rate, since it is already the
bottleneck of the process, anymore activity would not be advantageous to the company. So due to the
bottleneck effect we can’t possibly functioning at the most efficient rate.
Next we can compare the CNC Router to the Punch Press method in a similar fashion. For the
CNC Router there is a set up time of 150mins and Run Time of .5min per board. The Punch Press
operates with a setup time of 50mins and a Run Time of 1min per board. We must compare these two
equations using the variable of order size (x) [150 +.5*x = 50 +1*x] → [100 = .5*x] → [100/.5 = x] →
200=x. This would imply that we should be using the CNC Router on orders larger than 200 to function at
the highest efficiency. Currently Donner is using the CNC Router process on 6 orders, the smallest at 229
boards, totaling 4,331 boards. It would not be advantageous for Donner to produces the next smallest
order size (200) using the CNC Router, since 200 isn’t greater than the point of indifference of 200 (as
solved previously).
What is your explanation for each of the problems mentioned by Plummer?
Operating Problems
Management had a hard time finding where the main bottleneck was specifically in their system
because there would be a different problem every day in a different operation. All these different setbacks
were happening at random places in the system because each circuit board order was different. Each
customer had special requirements that were different from other orders.
Because he had no way of predicting where the next bottleneck would happen, Flaherty, the shop
supervisor, moved his workers accordingly to the top priority of work. For example, if three works had
finished their manual drilling, he would move them to another task until there were more boards to be
drilled. So essentially if all three workers were busy working on a different task, boards that were waiting
to be drilled had to wait.
Productivity Problems
4. Plummer, the president of the company, had noticed that some machines were idle more than he
expected them to be. This shows that there is a bottleneck somewhere in production that causes machines
to be idle. Also the Donner Company wasn’t even using their own goals, or time standards for their
operations. This is not a good sign because they need to be using their own numbers and times to create
the company’s own goals.
Under the plating operation, the president noticed that a platter would be inspecting panels and
then would have to walk 18’ to place the panels in the tanks. Altmeyer, the design engineer, concluded
that the walk from her desk to the tanks took up 15% of her time. Plummer stressed his concern that he
thought job improvements would not be beneficial for the company. He thought it would just create more
pileups at other stations. This is not a positive way of thinking when wanting to grow and develop a
company.
Quality Problems
Inspecting the circuit boards is difficult because there is not a specific standard of what a board
should look like because each customer’s order is different. Treating the boards in a careful manner is one
problem, but not meeting the correct qualifications that the customer asked for is a bigger problem
because on the order sheet (which top management writes up along with a blueprint), it lists everything
that is needed for the order to be complete. About 90% the company’s returns are because the customer’s
requirements were not met. 10% of the returns are from damaged boards.
Delivery Problems
In august of 1987, shipments had average nine days late. Lloyd Searby, the sales manager, had
calculated that if The Donner Company had changed its small order deliveries from 3 weeks to 4 weeks,
the company would barely make $2 million, instead of $3 million if they keep the deliveries at 3 weeks.
Plummer had a goal of clearing all work possible out of the shop by the end of every month. This
created a pattern in which the beginning of the month had fewer orders to fulfill than that of the end of the
month, because the goal made people try to rush and get the shop cleared out.
What specific actions should Mr. Plummer take to solve these problems?
Mr. Plummer should focus on what his company does best. This is serving his customers with
exactly what they want, ranging from order size to special requirements for their orders. Mr. Plummer
needs to realize that if there are multiple orders in the system, small orders and big orders, the big orders
are the ones that will take up most of the time, pushing the time back for the small orders. If the size of
orders is substantially different, then there needs to be two separate productions lines so the lines keep
moving. This way each order will essentially take up the same time even if they do have different
qualifications because they will be the same size.
By having two productions lines, one for small orders and one for big orders, machines will rarely
be idle and workers will remain busy, because there will be no stop and start periods. By keeping the
main variable constant, order size, it will be easy for management to spot a bottleneck. Now that there are
two productions lines, running at their own speeds, Plummer needs to find time goals that are fit yet still
demanding for the process. He needs to base these goals from his own lines of production, not from
competing firms, because most likely they have a completely different way of doing things than the
Donner Company. This new way of creating the circuit boards can increase delivery time depending on
the order size. Also, now the company can begin to look for job improvements and workers can master
their own skill with this new layout.
5. 0
1000
2000
3000
4000
5000
6000
7000
0
100
200
300
400
500
600
700
800
900
1000
Time
Per
Order
(Minutes)
Order
Size
Donner
Company-‐
Graph
1
0
50
100
150
200
250
300
350
400
0
100
200
300
400
500
600
700
800
900
1000
Time
Per
Board
(minutes)
Order
Size
Donner
Company-‐
Graph
2