2. •
•
•
•
A recording of the electrical activity of the heart over
time
Gold standard for diagnosis of cardiac arrhythmias
Helps detect electrolyte disturbances (hyper- &
hypokalemia)
Allows for detection of conduction abnormalities
•
Screening tool for ischemic heart disease during stress
tests
•
Helpful with non-cardiac diseases (e.g. pulmonary
embolism or
hypothermia
3.
Is a recording of electrical activity of heart conducted thru
ions in body to surface
4. ECG Graph Paper
• Runs at a paper speed of 25 mm/sec
• Each small block of ECG paper is 1 mm2
• At a paper speed of 25 mm/s, one small block equals 0.04 s
• Five small blocks make up 1 large block which translates
into 0.20 s (200 msec)
• Hence, there are 5 large blocks per second
• Voltage: 1 mm = 0.1 mV between each individual block
vertically
5.
6.
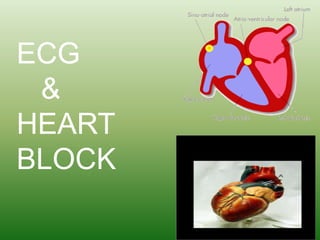
7. Normal conduction pathway:
SA node -> atrial muscle -> AV node -> bundle of His ->
Left and Right Bundle Branches -> Ventricular muscle
8. Recording of the ECG:
Leads used:
• Limb leads are I, II, II. So called because at one time
subjects had to literally place arms and legs in buckets of salt
water.
• Each of the leads are bipolar; i.e., it requires two sensors
on the skin to make a lead.
• If one connects a line between two sensors, one has a
vector.
• There will be a positive end at one electrode and
negative at the other.
• The positioning for leads I, II, and III were first given by
Einthoven. Form the basis of Einthoven’s triangle.
9.
10.
Bipolar leads record
voltage between
electrodes placed on
wrists & legs (right leg is
ground)
Lead I records between
right arm & left arm
Lead II: right arm & left
leg
Lead III: left arm & left
leg
11. Limb Leads
Placement
Lead I
Connects the right arm with the
left arm
Lead II
Connects the right arm with the
left leg
Connects the left arm with the left
leg
Lead III
aVR
Right arm
aVL
Left arm
aVF
Left leg
12. Precordial Leads
Placement
V1
Fourth intercostals space, just to the right of the sternum
V2
Opposite V1, over the fourth intercostals space at the left
sterna border
V3
Midway between V2 and V4
V4
Over the fifth intercostals space at the left midclavicular line
V5
Over the fifth intercostals space at the left anterior axillary
line
V6
Over the fifth intercostals space at the left mid axillary line
Goldberger AL. Electrocardiography. In: Kasper DL, Braunwald E, Fauci AS, Hauser SL, Longo DL, Jameson JL, editors. Harrison’s principles of internal medicine(16th ed).
McGraw-Hill;2005.p.1311-1319.
Electrocardiogram analysis. In: Levine J, Munden J, Schaeffer L, Thompson G,editors. Portable ECGinterpretation. Lippincott Williams & Wilkins; 2007. P.257-364.
13.
14. ECG
3 distinct waves are
produced during
cardiac cycle
P wave caused by
atrial depolarization
QRS complex caused
by ventricular
depolarization
T wave results from
ventricular
repolarization
15.
16. •
First half is produced largely by depolarization of the right
atrium
•
Second half is produced largely by depolarization of the
left atrium
Duration
: 0.06 to 0.12 second
Configuration : Usually rounded and
upright
Amplitude
: 2 to 3 mm high
17.
18.
19.
20.
Includes the P wave and P-R segment0.12-2.0
sec
Represents the time of transmission of the electrical
impulse from the atria to ventricle
Location : From the beginning of the P wave
to the beginning of the QRS complex
Basic concept and the normal electrocardiogram. In: Weinberg RW, Miller KC, Somers J, editors. Rapid analysis Of Electrocardiogram: a self study
programme. Lippincott Williams And Wilkins; 1999.p.3-17.
21.
22. •QRS complex:
• Represents ventricular depolarization
• Larger than P wave because of greater muscle mass of
ventricles
• Normal duration = 0.08-0.12 seconds
• Its duration, amplitude, and morphology are useful in
diagnosing cardiac arrhythmias, ventricular
hypertrophy, MI, electrolyte derangement, etc.
• Q wave greater than 1/3 the height of the R
wave, greater than 0.04 sec are abnormal and may
represent MI
23.
24. •
Represents the earlier phase of repolarization of both the
ventricles
Basic concept and the normal electrocardiogram. In: Weinberg RW, Miller KC, Somers J, editors. Rapid analysis Of Electrocardiogram: a self
study programme. Lippincott Williams And Wilkins; 1999.p.3-17.
25. •
Extends from the end of QRS complex to the beginning of T
wave
•
Usually isoelectric or on the baseline
•
Neither elevated (positive) nor depressed (negative)
•
The point at which the ST segment joints the QRS complex
is known as the J (junction) point
Basic concept and the normal electrocardiogram. In: Weinberg RW, Miller KC, Somers J, editors. Rapid analysis Of Electrocardiogram: a self
study programme. Lippincott Williams And Wilkins; 1999.p.3-17.
26.
27. T wave:
• Represents repolarization or recovery of ventricles
• Interval from beginning of QRS to apex of T is
referred to as the absolute refractory period
28. ST segment:
• Connects the QRS complex and T wave
• Duration of 0.08-0.12 sec (80-120 msec
QT Interval
• Measured from beginning of QRS to the end of the T
wave
• Normal QT is usually about 0.40 sec
• QT interval varies based on heart rate
29.
Disturbances of the conduction through the
heart, occurring at the AV Node
AV Node – damaged/diseased – delay or total
block of impulses at the AV Node
This conduction defect can be seen on the ECG
38.
PR Interval prolongs with each beat until a
dropped beat is seen
The PR Interval is NOT constant
After each dropped beat, the PR interval is
normal and the cycle starts again
41.
Clinical Significance
Slight symptoms e.g..
Lethargy, Confusion
Treatment
Pacemaker if during day &/or
symptoms
No treatment if at night
Note – this can progress to 3º Heart Block
42.
Conduction through the AV node is constant.
PR interval is normal and constant
Occasionally a dropped beat is seen
45.
Clinical significance – this is more significant
disease
Treatment – pacemaker
Note – this can progress to 3º Heart Block
46.
Unable to strictly classify as Mobitz Type I or II
Particular type of second degree Heart Block
Ratio 2 P waves : 1 QRS
47.
48.
Clinical significance – unable to classify as
Mobitz type I or II
Will be associated with
symptoms, dizziness, lethargy etc.
Treatment – pacemaker
Note – this can deteriorate to 3º Heart Block
49.
Complete failure of the AV Node
No impulses from Sinus Node will pass
through to the ventricles
Some part if the conducting system will take
over as pacemaker of the heart (even a
myocardial cell 10-15 bpm)
50.
P wave rate – normal
Ventricular rate – slow
Ventricular complex may be broad
Idioventricular rhythm
Complete dissociation between P waves &
QRS
53.
clinical significance
Symptoms LOC, Confusion,
Dizziness, Low BP
Can lead to standstill, VT or VF
(stokes Adams)
Treatment - pacemaker
54.
55.
56.
1º - prolongation of PR Interval
ALL
2º - Mobitz I – Increasing PR Interval until dropped beat is seen
SOME
Mobitz II – Constant PR Interval with more P waves to QRS
2 : 1 – Constant PR Interval with more P waves to QRS
3º - Complete dissociation between P waves & QRS
NONE
Editor's Notes
Placement of chest leads (Precordial leads)V1- Fourth intercostals space, just to the right of the sternum3V2- Just opposite V1, over the fourth intercostals space at the left sterna borderV3- Midway between V2 and V4V4- Over the fifth intercostals space at the left midclavicular lineV5- Over the fifth intercostals space at the left anterior axillary lineV6- Over the fifth intercostals space at the left anterior axillary line
P-R interval includes the P wave and P-R segment. It represents the time of transmission of the electrical impulse from the atria to ventricles.
ST segment represents the earlier phase of repolarization of both the ventricles.
ST segment extends from the end of QRS complex to the beginning of T wave. The ST segment is generally isoelectric (at the same level as the resting baseline. It is neither elevated (positive) nor depressed (negative). The point at which the ST segment joints the QRS complex is known as the J (junction) point