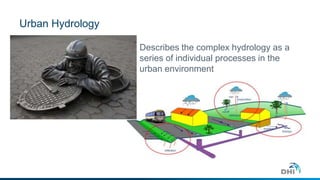
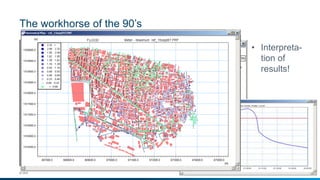
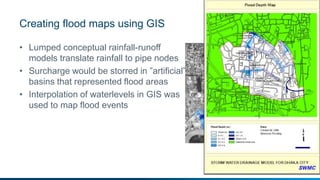
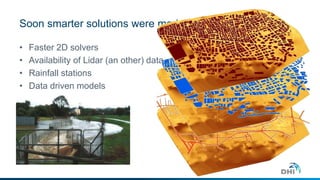
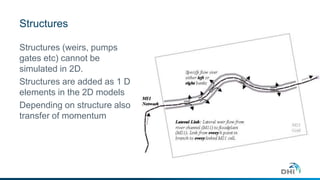
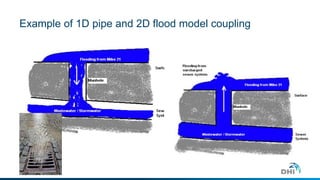
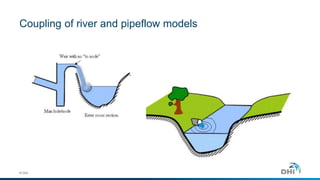
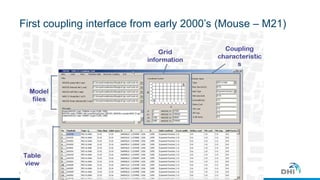
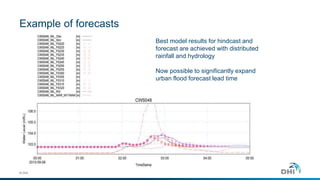
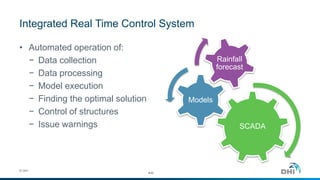
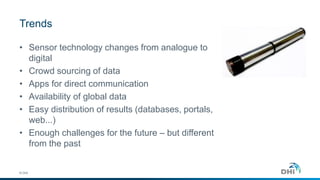
Ten Years of Coupled Hydrology Hydraulic Modelling 
supporting Storm Water Management 
– some examples, Lessons Learnt and a look forward 
Ole Larsen, APAC Research Director, DHI Singapore 
Stephen J Flood, Senior Engineer, DHI UK 
Nick Elderfield, MD DHI UK 
© DHI
Urban Hydrology 
Describes the complex hydrology as a 
series of individual processes in the 
urban environment
But is a reductionist 
approach valid?
Early steps of urban overland flow models
The workhorse of the 90’s 
© DHI 
• Interpreta-tion 
of 
results!
Creating flood maps using GIS 
• Lumped conceptual rainfall-runoff 
models translate rainfall to pipe nodes 
• Surcharge would be storred in ”artificial” 
basins that represented flood areas 
• Interpolation of waterlevels in GIS was 
used to map flood events
Soon smarter solutions were made – 2D models 
• Faster 2D solvers 
• Availability of Lidar (an other) data 
• Rainfall stations 
• Data driven models
Structures 
Structures (weirs, pumps 
gates etc) cannot be 
simulated in 2D. 
Structures are added as 1 D 
elements in the 2D models 
Depending on structure also 
transfer of momentum
Example of 1D pipe and 2D flood model coupling 
© DHI
Coupling of river and pipeflow models 
© DHI
First coupling interface from early 2000’s (Mouse – M21) 
© DHI
Current interface – Pipe flow, River, and 2D - HD and AD 
© DHI
Realistic view of urban flooding
Detailed models with long run time 
© DHI 
Slight change in work 
– are the data 
correct? 
In this case missing 
inlets lead to 
misleading results
MIKE 21 FM Christchurch Supermodel 
© DHI 
Catchment area approx. 420 km2 
including three river systems in 
the model domain: 
 Avon River 
 Styx River 
 Heathcote River 
2D model domain: 
 4.2 million elements 
 10 m x 10 m resolution flexible 
mesh (rectangular elements) 
 Distributed rainfall-runoff, with 
no losses (rain-on-grid) 
Design rainfall event: 
 100 year ARI rainfall 
 single peak storm 
 21 hour duration
MIKE 21 FM Christchurch Supermodel 
© DHI 
Run time on desktop PC with 
GPU is 3.5 hours approx. 
compared to weeks on desktop 
CPU only hardware 
16 core Dell workstation with: 
 2 x Intel® Xeon® CPU ES- 
2687W v2 (8 core, 3.40 GHZ) 
 32 GB of RAM 
 ONE GeForce GTX TITAN 
GPU card 
 Windows 7 operating system 
Tests with TWO GPU cards show 
a run time of 1.75 hours approx.
Desktop 
CPU 
user 
Desktop 
CPU+GPU 
user
Can we now handle the uncertainty? 
© DHI
• Precipitation 
and snowmelt 
• Vegetation 
based 
evapotrans-piration 
and 
infiltration 
• Un- and 
saturated 
groundwater 
flow 
• Channel 
flow in 
rivers 
and lakes 
• Overland 
surface 
flow and 
flooding 
• Demand 
driven 
irrigation 
• Solute 
Transport 
Distributed hydrology
SHE 
• Promotion from the 80’s
© DHI 
drainflow 
leakage 
rain 
infiltration 
runoff 
evaporation 
MOUSE 
infiltration 
MOUSE 
MIKE SHE 
MIKE SHE
Groundwater and sewer 
© DHI
Detailed hydrological modelling 
© DHI
© DHI
New standards for sewer rehabilization 
© DHI
Distributed physically based hydrology vs RR 
MIKE SHE was set up 
using global coverage 
spatial data sets… 
Nash-Sutcliffe (R2) 
1.00 
0.90 
0.80 
0.70 
0.60 
0.50 
0.40 
0.30 
0.20 
0.10 
0.00 
Osobloga 
Olza 
Klodnica 
Mala panew 
Olawa 
Nysa Klodska 
Kaczawa 
Sleza 
Bystrzyca 
Barycz 
Czerna 
Bobr 
Average 
SHE R2 NAM R2 
Topography 
Land use 
Soil map 
GW zones 
..and was found to 
perform better than 
traditional RR 
models
Local Area Weather Radar aka Hydrology Radar 
18. August 2010 - Billund airport closed 45 minutes due to heavy rain 
30 
Circle diameter: 120 km 
Pixel size: 500x500 
Image frequency: 5 minute 
Data from Vejle LAWR, DK
31 
LAWR – brief history 
• Developed as part of EU ESPRIT 
project in 1997 
• First installation in 1998 – now 
40+ worldwide 
− One nationwide network in El Salvador 
• Designed for high resolution 
precipitation measurement over 
small areas
• Range 
− 60 km for forecast 
− 20 km for Quantitative Precipitation Est. 
• Spatial resolution (Cartesian) 
− 500x500 
− 250x250v 
− 100x100 
• Image frequency 
− 1 or 5 minute 
• Single layer 
32
Example from Singapore LAWR – MSHE – Mike Urban Flood 
© DHI 
• Heavy event 
• No attenuation
Example of forecasts 
© DHI 
Best model results for hindcast and 
forecast are achieved with distributed 
rainfall and hydrology 
Now possible to significantly expand 
urban flood forecast lead time
Integrated Real Time Control System 
© DHI 
SCADA 
Models 
Rainfall 
forecast 
• Automated operation of: 
− Data collection 
− Data processing 
− Model execution 
− Finding the optimal solution 
− Control of structures 
− Issue warnings 
#35
Integrated real-time control of urban waters 
© DHI 
Sewer 
#36
Trends 
• Sensor technology changes from analogue to 
© DHI 
digital 
• Crowd sourcing of data 
• Apps for direct communication 
• Availability of global data 
• Easy distribution of results (databases, portals, 
web...) 
• Enough challenges for the future – but different 
from the past
Take home messages 
• Urban drainage storm water models typically need high degree of detail to 
resolve the flooding – it’s important, but data are available today 
• Detailed models are slow, too slow – GPU and HPC technology is a game 
changer 
• With all this speed provided by GPU and HPC, the uncertainty in model set-up 
and parameters can be assessed => use speed advantages from GPU 
for uncertainty assessment 
• Physically based, distributed hydrological modelling and distributed rainfall 
can be used in coupled modelling to great effect
Thank you for your attention 
(please visit our booth to see more!) 
Ole Larsen; 
Stephen J Flood; and 
Nick Elderfield 
© DHI
The expert in WATER ENVIRONMENTS

Ten Years of Coupled Hydrology and Hydraulic Modelling Supporting Storm Water Management

  • 1.
    Ten Years ofCoupled Hydrology Hydraulic Modelling supporting Storm Water Management – some examples, Lessons Learnt and a look forward Ole Larsen, APAC Research Director, DHI Singapore Stephen J Flood, Senior Engineer, DHI UK Nick Elderfield, MD DHI UK © DHI
  • 2.
    Urban Hydrology Describesthe complex hydrology as a series of individual processes in the urban environment
  • 3.
    But is areductionist approach valid?
  • 4.
    Early steps ofurban overland flow models
  • 5.
    The workhorse ofthe 90’s © DHI • Interpreta-tion of results!
  • 6.
    Creating flood mapsusing GIS • Lumped conceptual rainfall-runoff models translate rainfall to pipe nodes • Surcharge would be storred in ”artificial” basins that represented flood areas • Interpolation of waterlevels in GIS was used to map flood events
  • 7.
    Soon smarter solutionswere made – 2D models • Faster 2D solvers • Availability of Lidar (an other) data • Rainfall stations • Data driven models
  • 8.
    Structures Structures (weirs,pumps gates etc) cannot be simulated in 2D. Structures are added as 1 D elements in the 2D models Depending on structure also transfer of momentum
  • 9.
    Example of 1Dpipe and 2D flood model coupling © DHI
  • 10.
    Coupling of riverand pipeflow models © DHI
  • 11.
    First coupling interfacefrom early 2000’s (Mouse – M21) © DHI
  • 12.
    Current interface –Pipe flow, River, and 2D - HD and AD © DHI
  • 13.
    Realistic view ofurban flooding
  • 14.
    Detailed models withlong run time © DHI Slight change in work – are the data correct? In this case missing inlets lead to misleading results
  • 15.
    MIKE 21 FMChristchurch Supermodel © DHI Catchment area approx. 420 km2 including three river systems in the model domain:  Avon River  Styx River  Heathcote River 2D model domain:  4.2 million elements  10 m x 10 m resolution flexible mesh (rectangular elements)  Distributed rainfall-runoff, with no losses (rain-on-grid) Design rainfall event:  100 year ARI rainfall  single peak storm  21 hour duration
  • 16.
    MIKE 21 FMChristchurch Supermodel © DHI Run time on desktop PC with GPU is 3.5 hours approx. compared to weeks on desktop CPU only hardware 16 core Dell workstation with:  2 x Intel® Xeon® CPU ES- 2687W v2 (8 core, 3.40 GHZ)  32 GB of RAM  ONE GeForce GTX TITAN GPU card  Windows 7 operating system Tests with TWO GPU cards show a run time of 1.75 hours approx.
  • 17.
    Desktop CPU user Desktop CPU+GPU user
  • 18.
    Can we nowhandle the uncertainty? © DHI
  • 19.
    • Precipitation andsnowmelt • Vegetation based evapotrans-piration and infiltration • Un- and saturated groundwater flow • Channel flow in rivers and lakes • Overland surface flow and flooding • Demand driven irrigation • Solute Transport Distributed hydrology
  • 20.
    SHE • Promotionfrom the 80’s
  • 21.
    © DHI drainflow leakage rain infiltration runoff evaporation MOUSE infiltration MOUSE MIKE SHE MIKE SHE
  • 22.
  • 23.
  • 24.
  • 25.
    New standards forsewer rehabilization © DHI
  • 26.
    Distributed physically basedhydrology vs RR MIKE SHE was set up using global coverage spatial data sets… Nash-Sutcliffe (R2) 1.00 0.90 0.80 0.70 0.60 0.50 0.40 0.30 0.20 0.10 0.00 Osobloga Olza Klodnica Mala panew Olawa Nysa Klodska Kaczawa Sleza Bystrzyca Barycz Czerna Bobr Average SHE R2 NAM R2 Topography Land use Soil map GW zones ..and was found to perform better than traditional RR models
  • 28.
    Local Area WeatherRadar aka Hydrology Radar 18. August 2010 - Billund airport closed 45 minutes due to heavy rain 30 Circle diameter: 120 km Pixel size: 500x500 Image frequency: 5 minute Data from Vejle LAWR, DK
  • 29.
    31 LAWR –brief history • Developed as part of EU ESPRIT project in 1997 • First installation in 1998 – now 40+ worldwide − One nationwide network in El Salvador • Designed for high resolution precipitation measurement over small areas
  • 30.
    • Range −60 km for forecast − 20 km for Quantitative Precipitation Est. • Spatial resolution (Cartesian) − 500x500 − 250x250v − 100x100 • Image frequency − 1 or 5 minute • Single layer 32
  • 31.
    Example from SingaporeLAWR – MSHE – Mike Urban Flood © DHI • Heavy event • No attenuation
  • 32.
    Example of forecasts © DHI Best model results for hindcast and forecast are achieved with distributed rainfall and hydrology Now possible to significantly expand urban flood forecast lead time
  • 33.
    Integrated Real TimeControl System © DHI SCADA Models Rainfall forecast • Automated operation of: − Data collection − Data processing − Model execution − Finding the optimal solution − Control of structures − Issue warnings #35
  • 34.
    Integrated real-time controlof urban waters © DHI Sewer #36
  • 35.
    Trends • Sensortechnology changes from analogue to © DHI digital • Crowd sourcing of data • Apps for direct communication • Availability of global data • Easy distribution of results (databases, portals, web...) • Enough challenges for the future – but different from the past
  • 36.
    Take home messages • Urban drainage storm water models typically need high degree of detail to resolve the flooding – it’s important, but data are available today • Detailed models are slow, too slow – GPU and HPC technology is a game changer • With all this speed provided by GPU and HPC, the uncertainty in model set-up and parameters can be assessed => use speed advantages from GPU for uncertainty assessment • Physically based, distributed hydrological modelling and distributed rainfall can be used in coupled modelling to great effect
  • 37.
    Thank you foryour attention (please visit our booth to see more!) Ole Larsen; Stephen J Flood; and Nick Elderfield © DHI
  • 38.
    The expert inWATER ENVIRONMENTS