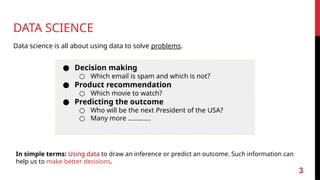
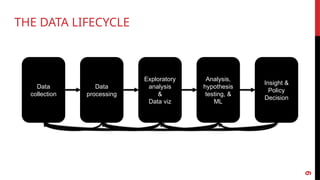
DATA SCIENCE
Data scienceis all about using data to solve problems.
● Decision making
○ Which email is spam and which is not?
● Product recommendation
○ Which movie to watch?
● Predicting the outcome
○ Who will be the next President of the USA?
○ Many more ………….
In simple terms: Using data to draw an inference or predict an outcome. Such information can
help us to make better decisions.
3
4.
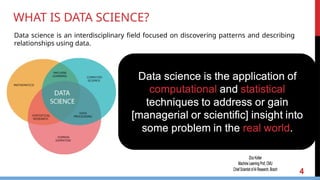
WHAT IS DATASCIENCE?
4
Data science is an interdisciplinary field focused on discovering patterns and describing
relationships using data.
5.
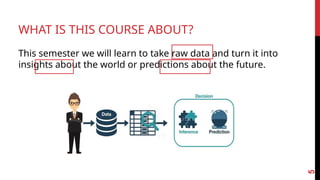
WHAT IS THISCOURSE ABOUT?
This semester we will learn to take raw data and turn it into
insights about the world or predictions about the future.
5
6.
6
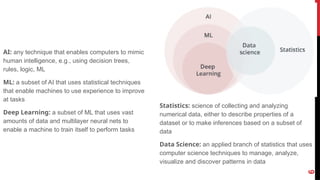
AI: any techniquethat enables computers to mimic
human intelligence, e.g., using decision trees,
rules, logic, ML
ML: a subset of AI that uses statistical techniques
that enable machines to use experience to improve
at tasks
Deep Learning: a subset of ML that uses vast
amounts of data and multilayer neural nets to
enable a machine to train itself to perform tasks
Statistics: science of collecting and analyzing
numerical data, either to describe properties of a
dataset or to make inferences based on a subset of
data
Data Science: an applied branch of statistics that uses
computer science techniques to manage, analyze,
visualize and discover patterns in data
7.
EXAMPLE: ANALYZE PATIENT’SMEDICAL RECORD,
PREDICT DISEASE OUTBREAK
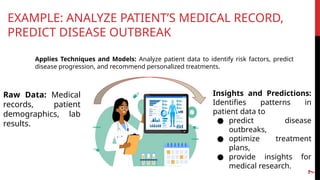
Raw Data: Medical
records, patient
demographics, lab
results.
Applies Techniques and Models: Analyze patient data to identify risk factors, predict
disease progression, and recommend personalized treatments.
Insights and Predictions:
Identifies patterns in
patient data to
● predict disease
outbreaks,
● optimize treatment
plans,
● provide insights for
medical research.
7
8.
SOME MORE EXAMPLES
●Given the results of a drug trial, determine if the drug is effective.
● Given a dataset of movies with ratings, predict what movies
someone will like.
● Given a set of labeled images, identify what is in a given picture.
● Given a dataset describing people who have and haven’t paid off
their loans, predict if a new person will repay a loan.
8
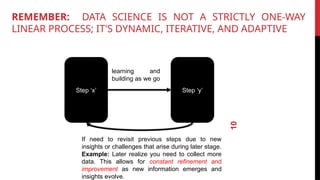
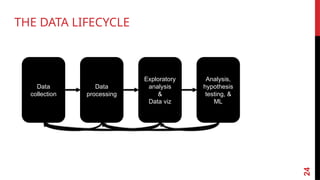
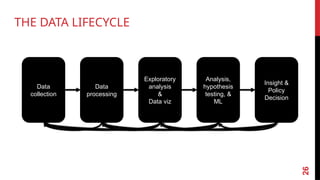
REMEMBER: DATA SCIENCEIS NOT A STRICTLY ONE-WAY
LINEAR PROCESS; IT'S DYNAMIC, ITERATIVE, AND ADAPTIVE
10
Step ‘x’ Step ‘y’
If need to revisit previous steps due to new
insights or challenges that arise during later stage.
Example: Later realize you need to collect more
data. This allows for constant refinement and
improvement as new information emerges and
insights evolve.
learning and
building as we go
11.
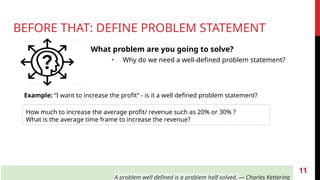
BEFORE THAT: DEFINEPROBLEM STATEMENT
What problem are you going to solve?
• Why do we need a well-defined problem statement?
A problem well defined is a problem half-solved. — Charles Kettering
Example: “I want to increase the profit” - is it a well defined problem statement?
How much to increase the average profit/ revenue such as 20% or 30% ?
What is the average time frame to increase the revenue?
11
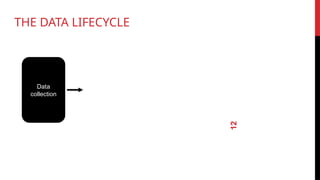
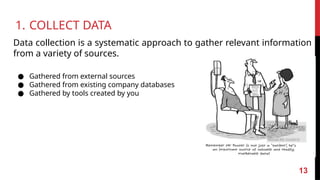
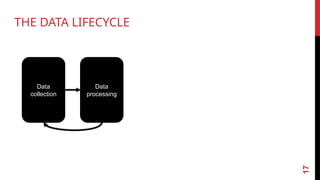
1. COLLECT DATA
13
Datacollection is a systematic approach to gather relevant information
from a variety of sources.
● Gathered from external sources
● Gathered from existing company databases
● Gathered by tools created by you
14.
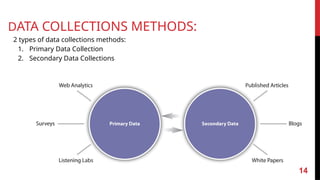
DATA COLLECTIONS METHODS:
2types of data collections methods:
1. Primary Data Collection
2. Secondary Data Collections
14
15.
DATA COLLECTIONS METHODS:PRIMARY
Situation: Some unique problem and no related research is done on the subject.
Solution: Collect new data Primary data collection.
→
Example: Average time that employees spend during lunch break across companies.
❏ Problem → No public data available of these.
❏ Solution: Collect the data through various methods.
❏ Different Methods: Surveys, Interviews of employees and by Monitoring the time spent
by employees in cafeteria.
❏ This methods are time consuming
15
16.
Situation: Some problemand the data is readily available or collected by someone else.
Solution: Use the data Secondary data collection.
→
❏ Different Methods: The internet, news articles, government census, magazines and so
on.
❏ This methods are less time consuming than the primary method.
16
DATA COLLECTIONS METHODS: SECONDARY
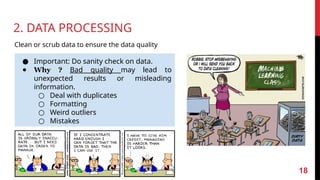
2. DATA PROCESSING
Cleanor scrub data to ensure the data quality
● Important: Do sanity check on data.
● Why ? Bad quality may lead to
unexpected results or misleading
information.
○ Deal with duplicates
○ Formatting
○ Weird outliers
○ Mistakes
18
19.
You Collect dataabout students' test scores.
• But → Some left SCORE scores blank, and others wrote "N/A” (Missing
Values).
• Process Data
• Replace "N/A" entries with a neutral value like 0 and
• Fill in the missing scores with the correct value
19
2. DATA PROCESSING: EXAMPLE
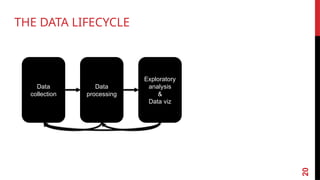
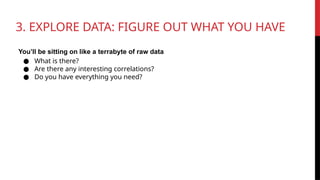
3. EXPLORE DATA:FIGURE OUT WHAT YOU HAVE
You’ll be sitting on like a terrabyte of raw data
● What is there?
● Are there any interesting correlations?
● Do you have everything you need?
22.
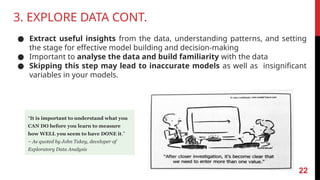
3. EXPLORE DATACONT.
● Extract useful insights from the data, understanding patterns, and setting
the stage for effective model building and decision-making
● Important to analyse the data and build familiarity with the data
● Skipping this step may lead to inaccurate models as well as insignificant
variables in your models.
“It is important to understand what you
CAN DO before you learn to measure
how WELL you seem to have DONE it.”
– As quoted by John Tukey, developer of
Exploratory Data Analysis
22
23.
3. EXPLORE DATA:EXAMPLE
You want to understand more about the scores and how they relate to other
factors like study hours.
● Exploratory Analysis: Find Connection between study hours and scores by
calculating the average score, find the range of scores, and notice that some
students scored exceptionally well.
● Data Visualization: Visually show the relationship between study hours and
average scores for different groups of students in order to reveal that students
who study more tend to have higher average scores.
23
4. BUILD AMODEL
Steps to the solution.
Example: build a machine learning
model that predicts a student's test
score based on their study hours.
● Train the model using the
→
historical data,
● Once it's trained, you can input a
student's study hours to get a
predicted test score.
25
5. INTERPRETATION
❏ DerivingInsights and make policy decisions if needed
❏ Present the results from your analysis to the stakeholders.
❏ Convince People: Explain the specific conclusion and critical findings,
probably in understandable manner.
27
The last step is getting a bunch of non-technical people to
understand what your magical model is doing and why it’s right
and they should listen to you.
Translate these findings into actionable insights.
28.
5. INTERPRETATION
❏ PolicyDecisions: You can lead to policy decisions that encourage
regular study time or improved teaching methods.
❏ Convincing people to do what you want:
• Often, you must share findings with non-technical groups
like marketing or executives. Your goal is clear
communication, allowing stakeholders to create actionable
plans based on the results.
28
Example: Let's say your analysis confirmed that there's a strong positive
correlation between study hours and test scores. This insight is crucial for both
students and educators to understand the importance of consistent study
habits.
29.
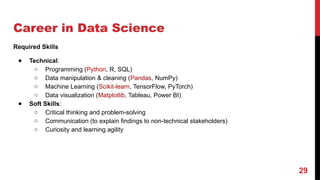
Career in DataScience
Required Skills
● Technical:
○ Programming (Python, R, SQL)
○ Data manipulation & cleaning (Pandas, NumPy)
○ Machine Learning (Scikit-learn, TensorFlow, PyTorch)
○ Data visualization (Matplotlib, Tableau, Power BI)
● Soft Skills:
○ Critical thinking and problem-solving
○ Communication (to explain findings to non-technical stakeholders)
○ Curiosity and learning agility
29
30.
30
“The ability totake data—to be able to
understand it, to process it, to extract value
from it, to visualize it, to communicate it—that’s
going to be a hugely important skill in the next
decades …”
Hal Varian
Chief Economist at Google