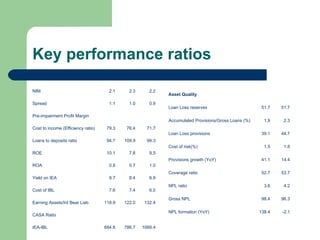
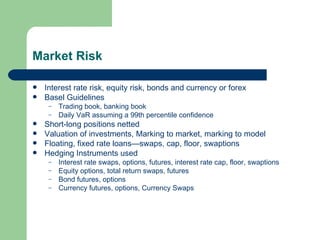
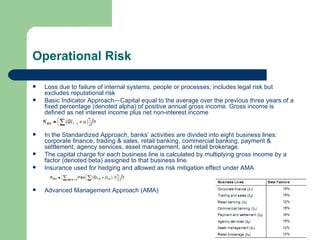
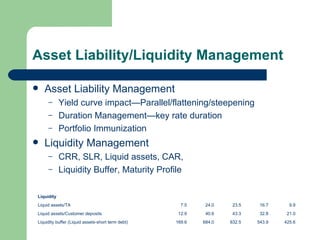
Banking Sector Hardik Doshi
Banking is a Risky Business Highly Levered entities. Highly Correlated with Economy. Business of borrowing and lending risk. Too big to fall, contagion effect Deposit insurance, fiduciary duty Root cause of turning real estate crisis into banking and financial crisis
Layman’s Perspective Banking Business & Segments Personal banking Accounts Savings Current Deposits Demand (Current) Savings Time Lockers Retail Loans Cards Corporate banking Corporate Loans Forex & Derivatives desk Working capital loans Structured Finance Project Finance Investment banking Treasury Micro Finance Services & Other Products Trade Services Letter of Credit Bank Guarantee Export bill negotiation Wealth Management IPO Insurance M&A
An analyst perspective Macro Analysis Positioning Competitive edge Macro Factors Micro Analysis Efficiency Margins Performance Safety Valuation Corporate & Risk Governance
Macro Factors GDP growth Monetary Policy—Money supply, repo rate, reverse repo rate, CRR, bank rate Fiscal Policy, fiscal consolidation Inflation Interest rate and yield curve movements Public debt Fund flows FII, ECB Unemployment, Wage growth Consumption Demand supply for credit, deposits, SLR rate Currency stability, import-export Government borrowing program and yields Interbank market, Liquidity in the market, call money External factors like change in bank regulation, political factors etc
Structure of assets/liabilities Simple but yet very complex and perplexing Loans are assets Deposits are liabilities Asset/Liability Structure Loans/Total Assets 55.7 52.8 51.5 55.9 46.9 (Cash+ Interbank)/Total Assets 7.5 11.4 10.4 7.6 9.9 Securities/Total Assets 30.3 30.6 33.0 30.7 38.1 Total 93.5 94.8 94.9 94.2 94.9 Deposits/Total assets 58.2 59.2 54.3 50.8 47.3 Borrowed Funds/Total Assets 25.3 25.9 25.3 27.8 26.2 Assets/equity 12.1 15.9 10.6 10.0 9.2
Structure of securities Mostly bonds & derivatives Held to maturity Available for sale Trading Purpose  generate income  duration management provide liquidity cash management
Source/Application of funds Composition    + Total Deposits 70 70 68 65 64    + Short-Term Borrowings 2 8 8 7 2    + Long-Term Borrowings 29 23 24 28 34 IBL 100 100 100 100 100 Composition    +  Net Loans 62 59 58 61 52    + Short-Term Investments 0 14 15 10 0    + Long-Term Investments 34 20 23 24 43    +  Interbank Assets 5 7 5 4 5 IEA 100 100 100 100 100
Revenue Drivers Interest Income Fee Income Trading Income Operating Expenses Provisions Income Statement           Interest income 146.1 250.0 340.9 362.5 301.5 Interest expense 101.0 176.8 257.7 264.9 207.3    Net Interest Income 45.1 73.3 83.3 97.6 94.2 Trading Income 14.9 10.3 30.5 21.9 26.2 Fees and commissions 32.5 54.4 67.7 65.7 60.0 Other operating income 63.9 98.1 160.8 191.4 207.4 + Non-Interest Income 111.4 162.9 259.0 279.0 293.6 - Non-Interest Expense 109.3 180.1 272.2 287.9 278.2    Pretax Pre-Provision Profit 47.2 56.1 70.1 88.8 109.7 - Provision for Loan Losses 8.1 22.1 27.7 39.1 44.7 - Net Non-Operating Losses (Gains) -0.1 -0.4 -0.6 0.0 -0.8    Pretax Income 39.1 34.4 43.0 49.7 65.8
Key performance ratios NIM 2.1 2.3 2.2 Spread 1.1 1.0 0.9 Pre-impairment Profit Margin       Cost to income (Efficiency ratio) 79.3 76.4 71.7 Loans to deposits ratio 94.7 109.9 99.3 ROE 10.1 7.8 9.5 ROA 0.8 0.7 1.0 Yield on IEA 8.7 8.4 6.9 Cost of IBL 7.6 7.4 6.0 Earning Assets/Int Bear Liab 118.9 122.0 132.4 CASA Ratio IEA-IBL 684.8 786.7 1069.4 Asset Quality Loan Loss reserves 51.7 51.7 Accumulated Provisions/Gross Loans (%) 1.9 2.3 Loan Loss provisions 39.1 44.7 Cost of risk(%) 1.5 1.8 Provisions growth (YoY) 41.1 14.4 Coverage ratio 52.7 53.7 NPL ratio 3.6 4.2 Gross NPL 98.4 96.3 NPL formation (YoY) 138.4 -2.1
Valuation Banks are valued mostly on the bases of P/B ratio, relative valuation and other key performance measures Evaluate country/market based on penetration, concentration BPS 250.0 266.5 401.9 420.2 460.1 P/B 2.4 3.2 1.9 0.8 2.1 EPS 41.4 30.9 32.9 32.1 41.9 P/E 14.2 27.6 23.4 10.4 22.7 Dividend Payout 23.5 32.5 35.4 34.2 28.6
Valuation
What is this hype about Basel? Global standards on banking regulation and disclosure Three pillars Minimum Capital Requirements Supervisory Review Process Market Discipline Capital requirement, Risk weighted Assets RWA-weighted average of assets according to different risk weights e.g. cash and treasury bills will have zero weight. Risk weights are assigned by Basel Total risk-weighted assets are determined by multiplying the capital requirements for market risk and operational risk by 12.5 and adding the resulting figures to the sum of risk-weighted assets for credit risk Trend in Basel, what's upcoming? Methods for market risk calculation Value At Risk Methods for Credit risk calculation Standardized Approach Internal Ratings based Approach Advanced IRB Approach Methods for Operational risk calculation Basic Indictor Approach Standardized Approach Advanced Measurement Approaches (AMA)---Loss distribution approach (LDA) Regulatory Requirements Tier1 ratio 9.2 7.4 10.7 10.3 12.9 CAR 13.4 11.7 13.5 14.7 19.2 RWA 2085.9 #VALUE! 4211.2 4393.5 3556.6
Risk management Market Risk Credit Risk Operational Risk Liquidity Risk Derivatives Value at Risk, Expected Shortfall
Value At Risk Historical simulation Delta Normal—mean variance method Monte-Carlo simulation method VAR siblings—LVAR, EAR, CFAR, SAR Z-factor for 95% confidence 1.65 Volatility Mean returns Periodic VAR Annualizing factor Annualized VAR Daily 2.58% 0.05% -4.21% Daily VAR 15.8 -67.42% More conservative Weekly 5.12% 0.28% -8.16% Weekly VAR 7.2 -60.88% More conservative Monthly 10.68% 1.41% -16.21% Monthly VAR 3.5 -61.03% More conservative
Market Risk Interest rate risk, equity risk, bonds and currency or forex Basel Guidelines Trading book, banking book Daily VaR assuming a 99th percentile confidence Short-long positions netted Valuation of investments, Marking to market, marking to model Floating, fixed rate loans—swaps, cap, floor, swaptions Hedging Instruments used Interest rate swaps, options, futures, interest rate cap, floor, swaptions Equity options, total return swaps, futures Bond futures, options Currency futures, options, Currency Swaps
Credit Risk Downgrade, Default and counterparty risk Securitization as a way to reduce credit risk Hedging instruments used Credit Derivatives Credit options Credit forwards Credit default swaps
Standardized Approach External Credit assessment institutions Claims on Sovereigns Claims on non-central government public sector entities (PSEs) Claims on multilateral development banks (MDBs) Claims on banks Claims on securities firms Claims on corporates Claims included in the regulatory retail portfolios Claims secured by residential property Claims secured by commercial real estate Past due loans (Net NPA) 150% risk weight when specific provisions are less than 20% of the outstanding amount of the loan; 100% risk weight when specific provisions are no less than 20% of the outstanding amount of the loan; 100% risk weight when specific provisions are no less than 50% of the outstanding amount of the loan, but with supervisory discretion to reduce the risk weight to 50%. Does not take into consideration collateral while calculating exposure amount Credit Risk mitigation techniques
Internal Ratings Approach Foundation and Advanced Approach The IRB approach is based on measures of unexpected losses (UL) and expected losses (EL). The risk-weight functions produce capital requirements for the UL portion. Expected losses are treated separately Capital requirements are not set for expected losses as they are met against provisions. Any difference is adjusted in capital Exposures—Corporate(5), Sovereign, bank, retail(3), equity Risk components ─ estimates of risk parameters provided by banks some of which are supervisory estimates. Risk-weight functions ─ the means by which risk components are transformed into risk-weighted assets and therefore capital requirements. Minimum requirements ─ the minimum standards that must be met in order for a bank to use the IRB approach for a given asset class. Expected Loss=EAD*LGD*PD Altman Z-score model
Capital & Risk Weighted Assets Probability of Default (PD) For corporate and bank exposures, the PD is the greater of the one-year PD associated with the internal borrower grade to which that exposure is assigned, or 0.03%. Loss given default (LGD) Under the foundation approach, senior claims on corporates, sovereigns and banks not secured by recognised collateral will be assigned a 45% LGD All subordinated claims on corporates, sovereigns and banks will be assigned a 75% LGD. IRB approach takes into consideration collateral while calculating exposure
Operational Risk Loss due to failure of internal systems, people or processes; includes legal risk but excludes reputational risk Basic Indicator Approach—Capital equal to the average over the previous three years of a fixed percentage (denoted alpha) of positive annual gross income. Gross income is defined as net interest income plus net non-interest income In the Standardized Approach, banks’ activities are divided into eight business lines: corporate finance, trading & sales, retail banking, commercial banking, payment & settlement, agency services, asset management, and retail brokerage. The capital charge for each business line is calculated by multiplying gross income by a factor (denoted beta) assigned to that business line. Insurance used for hedging and allowed as risk mitigation effect under AMA Advanced Management Approach (AMA)
Asset Liability/Liquidity Management Asset Liability Management Yield curve impact—Parallel/flattening/steepening Duration Management—key rate duration Portfolio Immunization Liquidity Management CRR, SLR, Liquid assets, CAR,  Liquidity Buffer, Maturity Profile Liquidity Liquid assets/TA 7.5 24.0 23.5 16.7 9.9 Liquid assets/Customer deposits 12.9 40.6 43.3 32.8 21.0 Liquidity buffer (Liquid assets-short term debt) 169.6 684.0 832.5 543.9 425.6
Susceptibility & Sustainability Stress testing—adequacy of capital Scenario Analysis Sensitivity Analysis Back testing VAR models
Some Statistics
 

Banking Sector

  • 1.
  • 2.
    Banking is aRisky Business Highly Levered entities. Highly Correlated with Economy. Business of borrowing and lending risk. Too big to fall, contagion effect Deposit insurance, fiduciary duty Root cause of turning real estate crisis into banking and financial crisis
  • 3.
    Layman’s Perspective BankingBusiness & Segments Personal banking Accounts Savings Current Deposits Demand (Current) Savings Time Lockers Retail Loans Cards Corporate banking Corporate Loans Forex & Derivatives desk Working capital loans Structured Finance Project Finance Investment banking Treasury Micro Finance Services & Other Products Trade Services Letter of Credit Bank Guarantee Export bill negotiation Wealth Management IPO Insurance M&A
  • 4.
    An analyst perspectiveMacro Analysis Positioning Competitive edge Macro Factors Micro Analysis Efficiency Margins Performance Safety Valuation Corporate & Risk Governance
  • 5.
    Macro Factors GDPgrowth Monetary Policy—Money supply, repo rate, reverse repo rate, CRR, bank rate Fiscal Policy, fiscal consolidation Inflation Interest rate and yield curve movements Public debt Fund flows FII, ECB Unemployment, Wage growth Consumption Demand supply for credit, deposits, SLR rate Currency stability, import-export Government borrowing program and yields Interbank market, Liquidity in the market, call money External factors like change in bank regulation, political factors etc
  • 6.
    Structure of assets/liabilitiesSimple but yet very complex and perplexing Loans are assets Deposits are liabilities Asset/Liability Structure Loans/Total Assets 55.7 52.8 51.5 55.9 46.9 (Cash+ Interbank)/Total Assets 7.5 11.4 10.4 7.6 9.9 Securities/Total Assets 30.3 30.6 33.0 30.7 38.1 Total 93.5 94.8 94.9 94.2 94.9 Deposits/Total assets 58.2 59.2 54.3 50.8 47.3 Borrowed Funds/Total Assets 25.3 25.9 25.3 27.8 26.2 Assets/equity 12.1 15.9 10.6 10.0 9.2
  • 7.
    Structure of securitiesMostly bonds & derivatives Held to maturity Available for sale Trading Purpose generate income duration management provide liquidity cash management
  • 8.
    Source/Application of fundsComposition    + Total Deposits 70 70 68 65 64    + Short-Term Borrowings 2 8 8 7 2    + Long-Term Borrowings 29 23 24 28 34 IBL 100 100 100 100 100 Composition    + Net Loans 62 59 58 61 52    + Short-Term Investments 0 14 15 10 0    + Long-Term Investments 34 20 23 24 43    + Interbank Assets 5 7 5 4 5 IEA 100 100 100 100 100
  • 9.
    Revenue Drivers InterestIncome Fee Income Trading Income Operating Expenses Provisions Income Statement           Interest income 146.1 250.0 340.9 362.5 301.5 Interest expense 101.0 176.8 257.7 264.9 207.3    Net Interest Income 45.1 73.3 83.3 97.6 94.2 Trading Income 14.9 10.3 30.5 21.9 26.2 Fees and commissions 32.5 54.4 67.7 65.7 60.0 Other operating income 63.9 98.1 160.8 191.4 207.4 + Non-Interest Income 111.4 162.9 259.0 279.0 293.6 - Non-Interest Expense 109.3 180.1 272.2 287.9 278.2    Pretax Pre-Provision Profit 47.2 56.1 70.1 88.8 109.7 - Provision for Loan Losses 8.1 22.1 27.7 39.1 44.7 - Net Non-Operating Losses (Gains) -0.1 -0.4 -0.6 0.0 -0.8    Pretax Income 39.1 34.4 43.0 49.7 65.8
  • 10.
    Key performance ratiosNIM 2.1 2.3 2.2 Spread 1.1 1.0 0.9 Pre-impairment Profit Margin       Cost to income (Efficiency ratio) 79.3 76.4 71.7 Loans to deposits ratio 94.7 109.9 99.3 ROE 10.1 7.8 9.5 ROA 0.8 0.7 1.0 Yield on IEA 8.7 8.4 6.9 Cost of IBL 7.6 7.4 6.0 Earning Assets/Int Bear Liab 118.9 122.0 132.4 CASA Ratio IEA-IBL 684.8 786.7 1069.4 Asset Quality Loan Loss reserves 51.7 51.7 Accumulated Provisions/Gross Loans (%) 1.9 2.3 Loan Loss provisions 39.1 44.7 Cost of risk(%) 1.5 1.8 Provisions growth (YoY) 41.1 14.4 Coverage ratio 52.7 53.7 NPL ratio 3.6 4.2 Gross NPL 98.4 96.3 NPL formation (YoY) 138.4 -2.1
  • 11.
    Valuation Banks arevalued mostly on the bases of P/B ratio, relative valuation and other key performance measures Evaluate country/market based on penetration, concentration BPS 250.0 266.5 401.9 420.2 460.1 P/B 2.4 3.2 1.9 0.8 2.1 EPS 41.4 30.9 32.9 32.1 41.9 P/E 14.2 27.6 23.4 10.4 22.7 Dividend Payout 23.5 32.5 35.4 34.2 28.6
  • 12.
  • 13.
    What is thishype about Basel? Global standards on banking regulation and disclosure Three pillars Minimum Capital Requirements Supervisory Review Process Market Discipline Capital requirement, Risk weighted Assets RWA-weighted average of assets according to different risk weights e.g. cash and treasury bills will have zero weight. Risk weights are assigned by Basel Total risk-weighted assets are determined by multiplying the capital requirements for market risk and operational risk by 12.5 and adding the resulting figures to the sum of risk-weighted assets for credit risk Trend in Basel, what's upcoming? Methods for market risk calculation Value At Risk Methods for Credit risk calculation Standardized Approach Internal Ratings based Approach Advanced IRB Approach Methods for Operational risk calculation Basic Indictor Approach Standardized Approach Advanced Measurement Approaches (AMA)---Loss distribution approach (LDA) Regulatory Requirements Tier1 ratio 9.2 7.4 10.7 10.3 12.9 CAR 13.4 11.7 13.5 14.7 19.2 RWA 2085.9 #VALUE! 4211.2 4393.5 3556.6
  • 14.
    Risk management MarketRisk Credit Risk Operational Risk Liquidity Risk Derivatives Value at Risk, Expected Shortfall
  • 15.
    Value At RiskHistorical simulation Delta Normal—mean variance method Monte-Carlo simulation method VAR siblings—LVAR, EAR, CFAR, SAR Z-factor for 95% confidence 1.65 Volatility Mean returns Periodic VAR Annualizing factor Annualized VAR Daily 2.58% 0.05% -4.21% Daily VAR 15.8 -67.42% More conservative Weekly 5.12% 0.28% -8.16% Weekly VAR 7.2 -60.88% More conservative Monthly 10.68% 1.41% -16.21% Monthly VAR 3.5 -61.03% More conservative
  • 16.
    Market Risk Interestrate risk, equity risk, bonds and currency or forex Basel Guidelines Trading book, banking book Daily VaR assuming a 99th percentile confidence Short-long positions netted Valuation of investments, Marking to market, marking to model Floating, fixed rate loans—swaps, cap, floor, swaptions Hedging Instruments used Interest rate swaps, options, futures, interest rate cap, floor, swaptions Equity options, total return swaps, futures Bond futures, options Currency futures, options, Currency Swaps
  • 17.
    Credit Risk Downgrade,Default and counterparty risk Securitization as a way to reduce credit risk Hedging instruments used Credit Derivatives Credit options Credit forwards Credit default swaps
  • 18.
    Standardized Approach ExternalCredit assessment institutions Claims on Sovereigns Claims on non-central government public sector entities (PSEs) Claims on multilateral development banks (MDBs) Claims on banks Claims on securities firms Claims on corporates Claims included in the regulatory retail portfolios Claims secured by residential property Claims secured by commercial real estate Past due loans (Net NPA) 150% risk weight when specific provisions are less than 20% of the outstanding amount of the loan; 100% risk weight when specific provisions are no less than 20% of the outstanding amount of the loan; 100% risk weight when specific provisions are no less than 50% of the outstanding amount of the loan, but with supervisory discretion to reduce the risk weight to 50%. Does not take into consideration collateral while calculating exposure amount Credit Risk mitigation techniques
  • 19.
    Internal Ratings ApproachFoundation and Advanced Approach The IRB approach is based on measures of unexpected losses (UL) and expected losses (EL). The risk-weight functions produce capital requirements for the UL portion. Expected losses are treated separately Capital requirements are not set for expected losses as they are met against provisions. Any difference is adjusted in capital Exposures—Corporate(5), Sovereign, bank, retail(3), equity Risk components ─ estimates of risk parameters provided by banks some of which are supervisory estimates. Risk-weight functions ─ the means by which risk components are transformed into risk-weighted assets and therefore capital requirements. Minimum requirements ─ the minimum standards that must be met in order for a bank to use the IRB approach for a given asset class. Expected Loss=EAD*LGD*PD Altman Z-score model
  • 20.
    Capital & RiskWeighted Assets Probability of Default (PD) For corporate and bank exposures, the PD is the greater of the one-year PD associated with the internal borrower grade to which that exposure is assigned, or 0.03%. Loss given default (LGD) Under the foundation approach, senior claims on corporates, sovereigns and banks not secured by recognised collateral will be assigned a 45% LGD All subordinated claims on corporates, sovereigns and banks will be assigned a 75% LGD. IRB approach takes into consideration collateral while calculating exposure
  • 21.
    Operational Risk Lossdue to failure of internal systems, people or processes; includes legal risk but excludes reputational risk Basic Indicator Approach—Capital equal to the average over the previous three years of a fixed percentage (denoted alpha) of positive annual gross income. Gross income is defined as net interest income plus net non-interest income In the Standardized Approach, banks’ activities are divided into eight business lines: corporate finance, trading & sales, retail banking, commercial banking, payment & settlement, agency services, asset management, and retail brokerage. The capital charge for each business line is calculated by multiplying gross income by a factor (denoted beta) assigned to that business line. Insurance used for hedging and allowed as risk mitigation effect under AMA Advanced Management Approach (AMA)
  • 22.
    Asset Liability/Liquidity ManagementAsset Liability Management Yield curve impact—Parallel/flattening/steepening Duration Management—key rate duration Portfolio Immunization Liquidity Management CRR, SLR, Liquid assets, CAR, Liquidity Buffer, Maturity Profile Liquidity Liquid assets/TA 7.5 24.0 23.5 16.7 9.9 Liquid assets/Customer deposits 12.9 40.6 43.3 32.8 21.0 Liquidity buffer (Liquid assets-short term debt) 169.6 684.0 832.5 543.9 425.6
  • 23.
    Susceptibility & SustainabilityStress testing—adequacy of capital Scenario Analysis Sensitivity Analysis Back testing VAR models
  • 24.
  • 25.