The document provides an analysis of ITC Limited including:
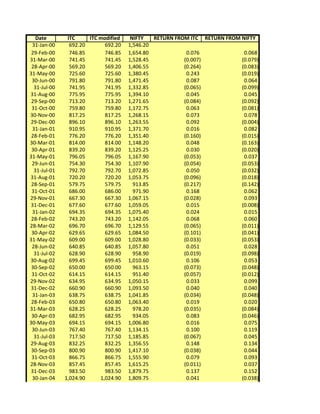
1. Historical stock price data for ITC and benchmark indices from 2000-2008.
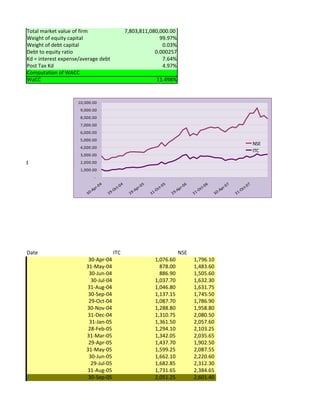
2. Key financial metrics such as earnings per share, price to earnings ratio, and book value from 2003-2008.
3. The average monthly return on ITC shares over the period was 1.14% with an annual return of 13.70%.