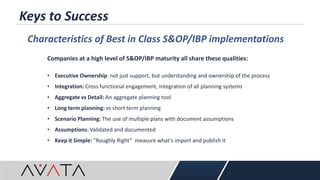
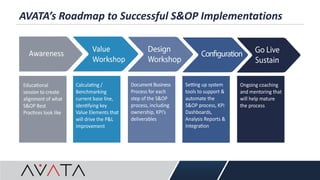
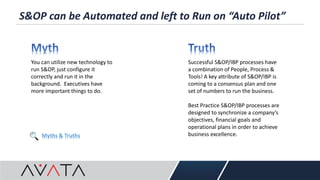
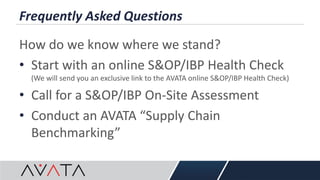
Presents
S&OP / IBP Express
Specialized by Oracle Preferred by CustomersRecognized by Industry
Welcome
• Presenters
› Jim Heatherington, Vice President of Sales
› Ferguson Neale, Principal Consultant
The AVATA Difference
Su p p ly Ch ain Practition ers
Coupled with Deep VCP Expertise
Gartner Recognized as Industry Experts
Oracle Demantra Specialized
Fusion Co-Development Partner
#1 Oracle VCP Cloud/BPS Partner
Partner Award for Excellence in VCP
Specialized by Oracle Preferred by CustomersRecognized by Industry
Agenda
• What is the Process (S&OP/IBP)
• S&OP/IBP Best Practices
• IBP express & Benefits
• AVATA’s Roadmap
• Online IBP Assessment
IBP Survey: You see the future through what lens?
Financial forecasting is derived from the following:
20 %
10 %
10 %
60 %
Advancing the S&OP Process
S&OP Mid-Term Planning
 Horizon (1 to 24 Months)
 Annual & Business Plan
 Aggregate Plan, RRP
Frequency: Monthly
Buckets: Monthly
Level: Family / Sub-Family
S&OP/IBP Long-Term
Planning
 Horizon 3-5+ years
 Business & Strategic
 Aggregate Plan, RRP
Frequency: Yearly (quarterly)
Buckets: Years (quarters)
Level: Total S/BU or family
Short-Term Planning
 Horizon (1-3 Months)
 Detailed Planning
 MPR / RCCP
Frequency: Weekly
Buckets: Weeks
Level: Item / SKU
Detail Planning
 Horizon (1-8 Weeks)
 Finite Scheduling
 CRP / FCS
Frequency: Daily
Buckets: Days or Less
Level: Item / SKU
AGGREGATE
VS.
DETAIL
PLANNING
S&OP: Focusing on the Gaps
CURRENT VIEW WITH:
• Operational Performance Changes
• Significant Financial Impact
• Assumptions
• Risk and Opportunities
Who takes responsibility?
When do you take action?
Now 12 24
Project Performance
Current S&OP Business Plan
Gap
Most companies have elements of S&OP in place..
.. but are not truly doing S&OP.
of companies surveyed do not
do S&OP at the executive level
(No Executive Business Review
and little executive involvement.)
of companies stated that their
S&OP process is in a lower
maturity stage
70-80%
over
50%
S&OP Defined: Characteristics
Characteristic Best in Class Disadvantaged
Cycle Monthly Weekly or quarterly
Planning Horizon 24+ months rolling 3 to 12 months or less as year progresses
Time Focus Month 4 and beyond Next few months
Language
Segments (product and market)
Families
SKU and detail
Who Participates Executive and middle management Middle management, Planners
Outcome Gap-closing strategies Production output
Level of Decision Making Tactical and strategic Tactical and short term
Level of
Integration/Process
Connects to business plan and
strategy as well as master plan
Meeting to review numbers
IBP Survey: How do your predict your future?
(Many inputs are required to project the future)
Financial “build-up” is based on:
Why the Gap in S&OP Maturity?
Missing Elements for Success:
• Holistic Organizational Understanding
• Integrated Process Design
• Tools for Standing –Up the Process
Advancing the S&OP Process
Step 1 Step 2 Step 3 Step 4
Value of S&OP Process
Improved
Communications
Problem
Solving
Problem
Prevention
Strategic
Decision Making
Commitment to the S&OP Process
Management
Advisors
Executives
Support Services
Advanced S&OP (IBP) environments are automated
Demand Review: Unconstrained volume forecast in monthly
family aggregation typically with a 24 months horizons.
Supply & Inventory Review: Rough-cut plans
with costs and capacity constraints to fulfill
demand request.
Financial Review: Assessment of the financial
implications and reconciliation.
Executive Review: Executive S&OP of current and
future state of the entire organization.
IBP express is a 4-step process
Built on OBIEE - Extension to APCC Developed by AVATA and Endorsed by Oracle​
Advantages of IBP express
• Business Process Driven Solution
• Built in Oracle’s Supply Chain Tools
• Preconfigured S&OP/IBP Reports & Dashboards
• Roadmap to 90 day first S&OP/IBP Cycle
• What-If Scenarios
• No Prerequisite of Planning Maturity or Planning Software
• Independent or Integrated to Oracle Planning Tools
IBP express Dashboards
IBP express Dashboards: Supply Review
Supply Review Includes:
• Inventory Plan
• Supply Plan
• IBP Plan
• Budget
Project effects on
Inventory plans
RCCP Illustrate Gaps
between Supply & Demand
IBP express Dashboards: Financial Review
Financial Review Includes:
• IBP Plan
• Annual Budget
• Margins
• Year/Year
• Month/Month
Review Gaps in
Budget vs Plan
Review Month over
Month IBP Plan
IBP express Dashboards: Scenario Review
Executive Scenario Views:
• “What If” Questions
• Alternative Assumptions
• Risk/Reward Plans
Impact of
Demand Sliding
Aggregate View of
Different IBP Plans
IBP Survey: How do you view your Business, Current & Future
IBP express Dashboards: Demand Review
IBP Demand Review:
• Current IBP Plan
• Waterfall View of Last 6
Months
Documented Range of Improvements
Source: AMR, Aberdeen, Ventana, and Avata
IMPROVEMENT % IMPROVEMENT %
Revenue Growth 10-31% Inventory Value 33-37%
Gross Margin 25-29% Inventory Reduction 18-46%
Demand Plan Accuracy 18-43% Safety Stock Reduction 11-45%
On-Time Delivery In Full 10-50% Working Capital 25-30%
Order Fill Rate 29-34% Asset Utilization 32-49%
Perfect Order 22-30% Increased Productivity 30-45%
Customer Satisfaction 29-39% Return on Assets 24-30%
Inventory Turns 24-28%
Keys to Success
Characteristics of Best in Class S&OP/IBP implementations
Companies at a high level of S&OP/IBP maturity all share these qualities:
• Executive Ownership: not just support, but understanding and ownership of the process
• Integration: Cross functional engagement, Integration of all planning systems
• Aggregate vs Detail: An aggregate planning tool
• Long term planning: vs short term planning
• Scenario Planning: The use of multiple plans with document assumptions
• Assumptions: Validated and documented
• Keep it Simple: “Roughly Right” measure what’s import and publish it
AVATA’s Roadmap to Successful S&OP Implementations
S&OP can be Automated and left to Run on “Auto Pilot”
You can utilize new technology to
run S&OP, just configure it
correctly and run it in the
background. Executives have
more important things to do.
Successful S&OP/IBP processes have
a combination of People, Process &
Tools! A key attribute of S&OP/IBP is
coming to a consensus plan and one
set of numbers to run the business.
Best Practice S&OP/IBP processes are
designed to synchronize a company’s
objectives, financial goals and
operational plans in order to achieve
business excellence.Myths & Truths
Frequently Asked Questions
How do we know where we stand?
• Start with an online S&OP/IBP Health Check
(We will send you an exclusive link to the AVATA online S&OP/IBP Health Check)
• Call for a S&OP/IBP On-Site Assessment
• Conduct an AVATA “Supply Chain
Benchmarking”
Looking for More?
Webinar Download
Client Demos
Brochure
• Salesforce CRM Oracle 10-7
• Upgrading ASCP 11-11
• S&OP in Cloud for JDE 12-10
• Statistical Engine Tuning 1-19
• Health Checks 2-23
• Trade Promotion Mgt 3-15
• Optimizing your Supply Chain 4-19
Website
Upcoming Webinars
S&OP / IBP
SURVEY EVALUATION
Contact Information
We’d love to hear from you.
Jim Heatherington
Phone
www.avata.com
www.LinkedIn.com/company/Avata
www.twitter.com/ValueChainGuru
www.facebook.com/avatainc
www.youtube.com/avatasupplychainmanagement
(C) +1 412-337-4642
jim.heatherington@avata.com
(303) 205-8461
Email
sales@avata.com
Thank You!

AVATA S&OP / IBP Express

  • 1.
    Presents S&OP / IBPExpress Specialized by Oracle Preferred by CustomersRecognized by Industry
  • 2.
    Welcome • Presenters › JimHeatherington, Vice President of Sales › Ferguson Neale, Principal Consultant
  • 3.
    The AVATA Difference Sup p ly Ch ain Practition ers Coupled with Deep VCP Expertise Gartner Recognized as Industry Experts Oracle Demantra Specialized Fusion Co-Development Partner #1 Oracle VCP Cloud/BPS Partner Partner Award for Excellence in VCP Specialized by Oracle Preferred by CustomersRecognized by Industry
  • 4.
    Agenda • What isthe Process (S&OP/IBP) • S&OP/IBP Best Practices • IBP express & Benefits • AVATA’s Roadmap • Online IBP Assessment
  • 5.
    IBP Survey: Yousee the future through what lens? Financial forecasting is derived from the following: 20 % 10 % 10 % 60 %
  • 6.
    Advancing the S&OPProcess S&OP Mid-Term Planning  Horizon (1 to 24 Months)  Annual & Business Plan  Aggregate Plan, RRP Frequency: Monthly Buckets: Monthly Level: Family / Sub-Family S&OP/IBP Long-Term Planning  Horizon 3-5+ years  Business & Strategic  Aggregate Plan, RRP Frequency: Yearly (quarterly) Buckets: Years (quarters) Level: Total S/BU or family Short-Term Planning  Horizon (1-3 Months)  Detailed Planning  MPR / RCCP Frequency: Weekly Buckets: Weeks Level: Item / SKU Detail Planning  Horizon (1-8 Weeks)  Finite Scheduling  CRP / FCS Frequency: Daily Buckets: Days or Less Level: Item / SKU AGGREGATE VS. DETAIL PLANNING
  • 7.
    S&OP: Focusing onthe Gaps CURRENT VIEW WITH: • Operational Performance Changes • Significant Financial Impact • Assumptions • Risk and Opportunities Who takes responsibility? When do you take action? Now 12 24 Project Performance Current S&OP Business Plan Gap
  • 8.
    Most companies haveelements of S&OP in place.. .. but are not truly doing S&OP. of companies surveyed do not do S&OP at the executive level (No Executive Business Review and little executive involvement.) of companies stated that their S&OP process is in a lower maturity stage 70-80% over 50%
  • 9.
    S&OP Defined: Characteristics CharacteristicBest in Class Disadvantaged Cycle Monthly Weekly or quarterly Planning Horizon 24+ months rolling 3 to 12 months or less as year progresses Time Focus Month 4 and beyond Next few months Language Segments (product and market) Families SKU and detail Who Participates Executive and middle management Middle management, Planners Outcome Gap-closing strategies Production output Level of Decision Making Tactical and strategic Tactical and short term Level of Integration/Process Connects to business plan and strategy as well as master plan Meeting to review numbers
  • 10.
    IBP Survey: Howdo your predict your future? (Many inputs are required to project the future) Financial “build-up” is based on:
  • 11.
    Why the Gapin S&OP Maturity? Missing Elements for Success: • Holistic Organizational Understanding • Integrated Process Design • Tools for Standing –Up the Process
  • 12.
    Advancing the S&OPProcess Step 1 Step 2 Step 3 Step 4 Value of S&OP Process Improved Communications Problem Solving Problem Prevention Strategic Decision Making Commitment to the S&OP Process Management Advisors Executives Support Services Advanced S&OP (IBP) environments are automated
  • 13.
    Demand Review: Unconstrainedvolume forecast in monthly family aggregation typically with a 24 months horizons. Supply & Inventory Review: Rough-cut plans with costs and capacity constraints to fulfill demand request. Financial Review: Assessment of the financial implications and reconciliation. Executive Review: Executive S&OP of current and future state of the entire organization. IBP express is a 4-step process Built on OBIEE - Extension to APCC Developed by AVATA and Endorsed by Oracle​
  • 14.
    Advantages of IBPexpress • Business Process Driven Solution • Built in Oracle’s Supply Chain Tools • Preconfigured S&OP/IBP Reports & Dashboards • Roadmap to 90 day first S&OP/IBP Cycle • What-If Scenarios • No Prerequisite of Planning Maturity or Planning Software • Independent or Integrated to Oracle Planning Tools
  • 15.
  • 16.
    IBP express Dashboards:Supply Review Supply Review Includes: • Inventory Plan • Supply Plan • IBP Plan • Budget Project effects on Inventory plans RCCP Illustrate Gaps between Supply & Demand
  • 17.
    IBP express Dashboards:Financial Review Financial Review Includes: • IBP Plan • Annual Budget • Margins • Year/Year • Month/Month Review Gaps in Budget vs Plan Review Month over Month IBP Plan
  • 18.
    IBP express Dashboards:Scenario Review Executive Scenario Views: • “What If” Questions • Alternative Assumptions • Risk/Reward Plans Impact of Demand Sliding Aggregate View of Different IBP Plans
  • 19.
    IBP Survey: Howdo you view your Business, Current & Future
  • 20.
    IBP express Dashboards:Demand Review IBP Demand Review: • Current IBP Plan • Waterfall View of Last 6 Months
  • 21.
    Documented Range ofImprovements Source: AMR, Aberdeen, Ventana, and Avata IMPROVEMENT % IMPROVEMENT % Revenue Growth 10-31% Inventory Value 33-37% Gross Margin 25-29% Inventory Reduction 18-46% Demand Plan Accuracy 18-43% Safety Stock Reduction 11-45% On-Time Delivery In Full 10-50% Working Capital 25-30% Order Fill Rate 29-34% Asset Utilization 32-49% Perfect Order 22-30% Increased Productivity 30-45% Customer Satisfaction 29-39% Return on Assets 24-30% Inventory Turns 24-28%
  • 22.
    Keys to Success Characteristicsof Best in Class S&OP/IBP implementations Companies at a high level of S&OP/IBP maturity all share these qualities: • Executive Ownership: not just support, but understanding and ownership of the process • Integration: Cross functional engagement, Integration of all planning systems • Aggregate vs Detail: An aggregate planning tool • Long term planning: vs short term planning • Scenario Planning: The use of multiple plans with document assumptions • Assumptions: Validated and documented • Keep it Simple: “Roughly Right” measure what’s import and publish it
  • 23.
    AVATA’s Roadmap toSuccessful S&OP Implementations
  • 24.
    S&OP can beAutomated and left to Run on “Auto Pilot” You can utilize new technology to run S&OP, just configure it correctly and run it in the background. Executives have more important things to do. Successful S&OP/IBP processes have a combination of People, Process & Tools! A key attribute of S&OP/IBP is coming to a consensus plan and one set of numbers to run the business. Best Practice S&OP/IBP processes are designed to synchronize a company’s objectives, financial goals and operational plans in order to achieve business excellence.Myths & Truths
  • 25.
    Frequently Asked Questions Howdo we know where we stand? • Start with an online S&OP/IBP Health Check (We will send you an exclusive link to the AVATA online S&OP/IBP Health Check) • Call for a S&OP/IBP On-Site Assessment • Conduct an AVATA “Supply Chain Benchmarking”
  • 26.
    Looking for More? WebinarDownload Client Demos Brochure • Salesforce CRM Oracle 10-7 • Upgrading ASCP 11-11 • S&OP in Cloud for JDE 12-10 • Statistical Engine Tuning 1-19 • Health Checks 2-23 • Trade Promotion Mgt 3-15 • Optimizing your Supply Chain 4-19 Website Upcoming Webinars S&OP / IBP SURVEY EVALUATION
  • 27.
    Contact Information We’d loveto hear from you. Jim Heatherington Phone www.avata.com www.LinkedIn.com/company/Avata www.twitter.com/ValueChainGuru www.facebook.com/avatainc www.youtube.com/avatasupplychainmanagement (C) +1 412-337-4642 jim.heatherington@avata.com (303) 205-8461 Email sales@avata.com
  • 28.