Download to read offline


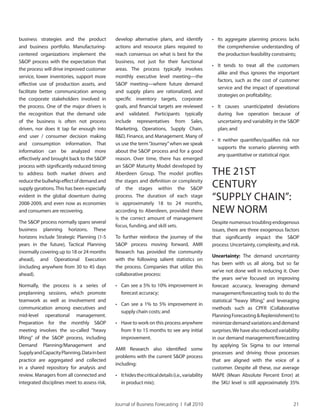
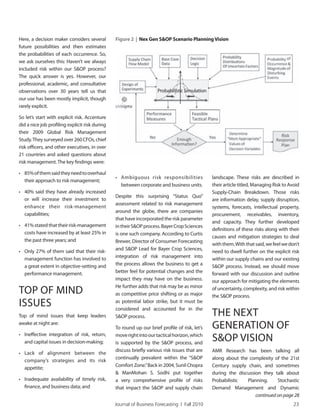
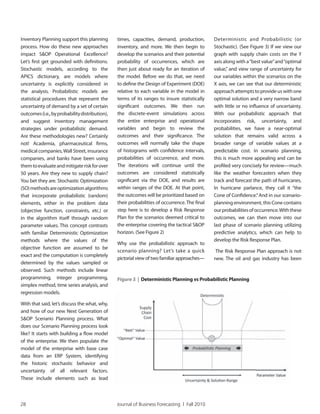

This article discusses how businesses can improve their Sales & Operations Planning (S&OP) process by incorporating scenario planning using probabilistic planning, predictive analytics, and simulation to better address uncertainty, complexity, and risk. Currently, S&OP processes do not adequately account for these factors and can hide critical details. The article recommends using predictive analytics on demand data and scenario planning with quantitative methods to generate alternative plans and assess risks. This will help businesses better balance supply and demand when facing uncertainties.


