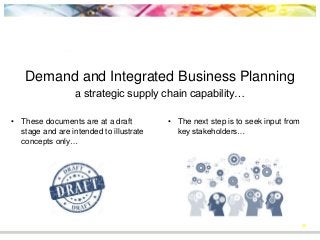
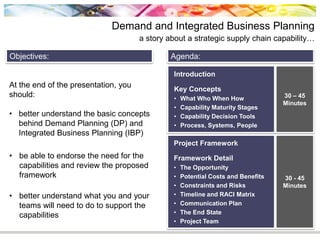
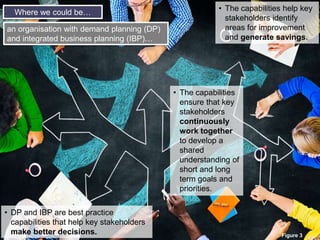
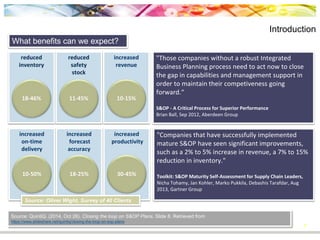
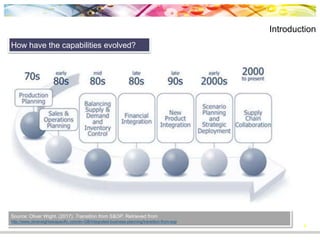
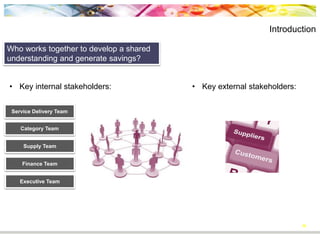
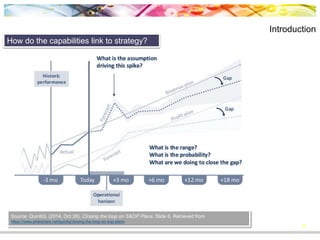
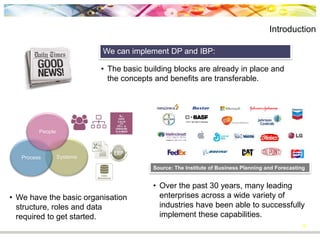
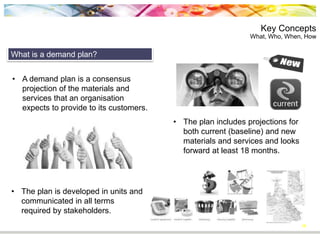
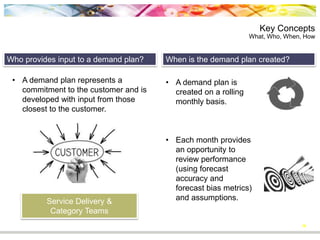
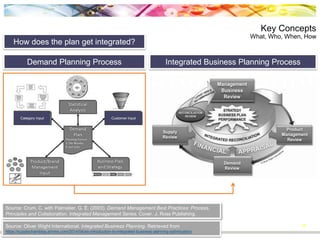
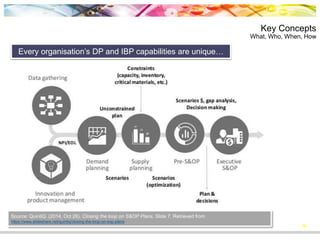
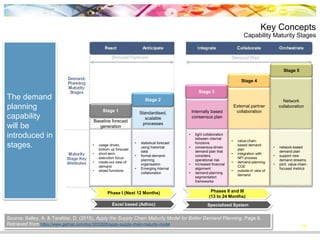
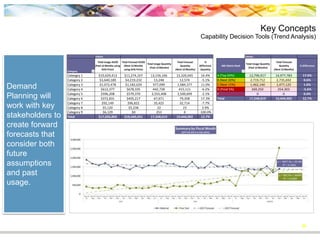
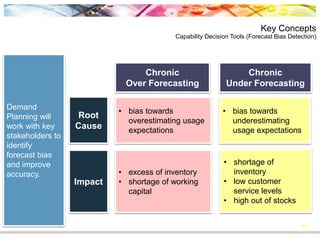
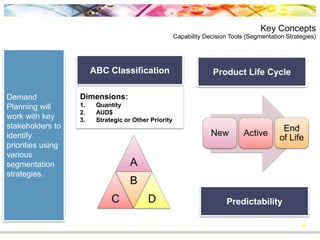
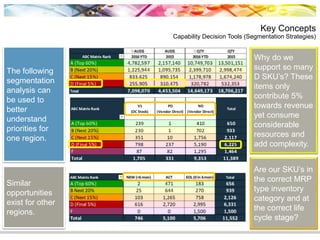
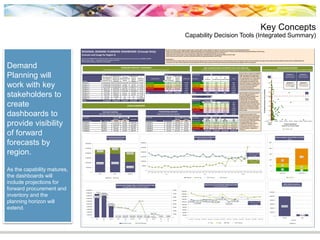
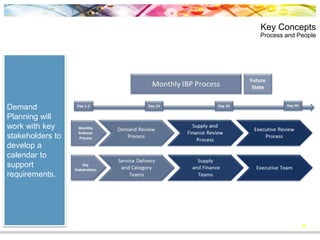
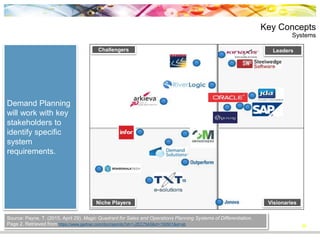
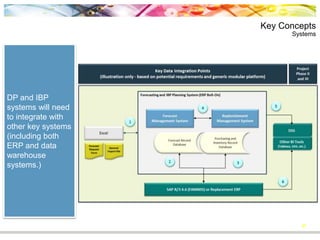
This document provides an overview of demand planning (DP) and integrated business planning (IBP) capabilities. It discusses how these capabilities can help organizations work together to develop shared plans, identify improvement areas, and generate savings. The document outlines the basic concepts of DP and IBP, including how they evolve over maturity stages. It also presents some decision tools and dashboards that DP and IBP use to analyze trends, detect forecast bias, conduct segmentations, and provide integrated visibility of forecasts. Implementing these capabilities will help align short and long term goals across the organization.
The document provides an overview and introduction to Sales & Operations Planning (S&OP) and the author's approach to implementing S&OP. It discusses the business benefits of S&OP, including improved forecast accuracy, reduced supply chain volatility, and improved decision making. It also outlines key aspects of implementing S&OP such as ensuring the appropriate process, people, performance metrics, and systems are in place to connect demand planning, supply planning, and finance. The author advocates for taking a holistic view of S&OP that integrates these elements to align strategic planning with operational execution.
Spinnaker provides an overview of integrated business planning (IBP) from both a process and technology perspective. They discuss typical performance gaps companies experience with demand and supply planning and the root causes. Spinnaker's framework separates IBP into demand, supply, and IBP processes with activities assigned to each. They also review SAP's IBP suite and how it can help achieve advanced IBP capabilities through applications for sales and operations planning, demand planning, supply planning and inventory planning. Spinnaker outlines critical foundations needed for successful IBP implementation including executive support, data quality, and change management.
S&OP Leadership Exchange: Tailoring S&OP to Fit your BusinessPlan4Demand
866.P4D.INFO | Plan4Demand.com | Info@plan4demand.com
Andrew McCall, S&OP Solutions Lead at Plan4Demand Discusses how tailoring your S&OP process to fit your business is critical to achieving bottom line success.
Speeding up the Supply Chain requires a new Supply Chain Planning approach - Enhanced User Experience
Introduce state-of-the art user experience with communication capabilities (SAP JAM) and MS Excel Spreadsheets.
Built on SAP HANA
Demand Networks require real-time monitoring and a focus on short-term planning
This document outlines an integrated business planning process presented by Charles P. Sitkin. It discusses the evolution of management concerns and strategic planning. The key components of the planning process include developing a mission statement, strategic excellence positions, goals, objectives, action plans, operational plans, budgets, and results management. The process aims to integrate strategic planning with operational planning and performance management to ensure the organization achieves its strategic goals.
AVATA is adding to their express solutions suite with “IBP express”, a hosted service offering that provides the framework for conducting the S&OP/IBP process with supported dashboard reports and KPI’s. IBP express will allow for a rapid deployment enabling your first S&OP/IBP cycle within 90-days.
IBP express is both a technology tool and service offering that supports advancing your current S&OP process or implementing S&OP/IBP for the first time. IBP express includes the required Education, Workshops, Coaching & Technology that will deliver a rapid ROI.
Enabling Best-Practice Demand Management and S&OP with Advanced Technology
Featured Presenter:
Doug Dedman, Vice President, Global Services, Steelwedge Software
Are you taking full advantage of all your demand signals? The sheer velocity of change – in business complexity, global volatility and available data – makes the prospect of managing regional and global planning a more elusive mission. Powerful demand planning can take you from a reactive to a proactive mode and turbo-charge your S&OP process.
In this webinar, you will learn how next-generation technology has enabled companies to more accurately forecast what their businesses will require.
Join us to learn more about how the right demand management approach and platform can enable you to:
Understand and grasp each demand type
Ensure accountability to the demand plan
Benefit from statistical forecasting where it makes sense while maintaining flexibility to use other forecasting methods
Collaborate internally and with customers when it makes sense
Achieve real-time visibility and synergy across all channels
To learn more about Steelwedge's Advanced S&OP Technology please visit: http://www.steelwedge.com/solutions/
This document provides an overview and introduction to demand planning and supply chain concepts. It discusses key components of demand planning including demand forecasting, inventory planning, and replenishment planning. The goals are to have the right inventory available at the right locations to meet customer demand and achieve target service levels. Integrated demand planning systems allow organizations to more accurately forecast demand, optimize inventory levels across the supply chain, and generate recommended replenishment orders.
This workshop focused on the elements of focus, alignment, and commitment building as it relates to an effective S&OP process. It was presented at the Business Forecasting and Analytics Forum in Boston on June 6th, 2017
Best Practices in Demand Planning and Sales ForecastingHatim Ratlami
The document discusses best practices for demand planning and sales forecasting. It begins with an abstract noting organizations spend significant resources on forecasting but poor practices can hamper goals. The top 10 demand planning mantras are then presented, including getting data quality right before forecasting, understanding data, defining metrics, leveraging statistical tools, establishing processes and calendars, assessing promotions, seeking consensus forecasts, being proactive in planning, managing exceptions, and utilizing market intelligence over forecasting. The document concludes with discussing the author and consulting firm that specializes in demand planning and provides related training and services.
SAP IBP can address pain areas in demand and supply planning for ABC Group. IBP allows gathering and cleansing historic data from multiple sources. It offers improved forecasting methods like demand sensing and statistical algorithms. IBP enables what-if scenario modeling and integrated inventory KPI dashboards. Alerts can be better managed to adjust forecasts and plans. IBP provides supply optimization and a supply chain control tower for end-to-end visibility. IBP would be implemented in parallel with APO, with master data and optimization results closely aligned between the two systems.
Building Outside-in Supply Chain ProcessesLora Cecere
This document discusses outside-in processes and their importance for supply chain planning. It is authored by Lora Cecere, founder of Supply Chain Insights. Some key points:
- An outside-in process starts with market data from sources like weather patterns, geolocation data, and product reviews to understand demand. This is opposed to starting from a supply-side view.
- Outside-in processes are important because assumptions about logistics and demand are no longer valid given increased volatility. Starting from customer demand provides more accuracy for planning.
- Most companies still operate with functional silos rather than taking a holistic, outside-in view of planning across the end-to-end supply chain. This can
The document provides an overview of executive sales and operations planning (S&OP), including what it is, how to implement it successfully, and the benefits it provides. It discusses S&OP as a executive decision-making process to balance demand and supply. Successful implementation requires organizational change, data-driven decision making, and commitment from top management. When done properly, S&OP can lead to a simpler, better integrated process for strategic planning and decision making.
Executive S&OP Case Study presented at GPSEGguestdd5f19
The document describes the benefits of implementing an integrated sales and operations planning (S&OP) process. It provides an example of a company that improved forecast accuracy by over 20% and inventory turns by 5-10% after implementing S&OP. Key steps in the company's S&OP process include creating an unconstrained demand plan, developing supply plan proposals, and holding partnership and executive meetings to approve balanced plans.
S&OP is a monthly global process to balance supply and demand, bringing all business operational plans into one integrated plan. All activities is based on a common Forecast data set. The ultimate target for S&OP therefore is to balance Supply and Demand.
Sales & Operations Planning (S&OP) and integrated business planning (IBP) align demand, supply and finance, allowing a holistic view across all departments so that businesses can test the financial impact of different “what if” options and respond to unplanned events--both positive and negative. Visit http://www.steelwedge.com/resources/s-and-op-intro
GitaCloud SAP Integrated Business Planning IBP - Order Based Planning Webinar...Ashutosh Bansal
This is the slide deck used for the webinar hosted jointly by GitaCloud and SAP on 23rd February, 2018. It covers SAP Integrated Business Planning IBP Response & Supply application with a focus on Order Based Planning processes. This webinar includes a 55 minute showcase demonstration of SAP IBP release 1802.
At GitaCloud, we are passionate about enabling digital supply chains. You can reach out to GitaCloud team by sending us an email at connect@gitacloud.com. You can also access learning.gitacloud.com for additional SAP IBP self-paced learning content. Visit www.gitacloud.com to learn more about GitaCloud.
The document discusses the sales and operational planning (S&OP) process. It provides an overview of S&OP, including definitions, objectives, critical success factors, challenges, benefits, leaders, policies, and implementation. S&OP is described as a monthly executive-level process that reconciles supply and demand plans, ties operations to financial plans, and sets strategy. The goals are to improve coordination, communication, inventory management, and meet customer demand profitably.
This document provides an overview of Sales & Operations Planning (S&OP), a centralized planning process that aims to align demand, supply, and financial plans across all levels of an organization. S&OP differs from traditional functional planning approaches by taking a holistic view and involving senior management to reach consensus on a single integrated plan. The presentation describes the typical S&OP process, which involves monthly meetings to review data, develop demand and supply plans, identify issues, and make decisions. Critical success factors for effective S&OP implementation include top management involvement, structured routine meetings, cross-functional participation, and integrated planning technology. Benefits of S&OP include improved goal alignment, communication, inventory management, and revenue predictability.
S&OP Framework and Case Study (PlayStation) Presented at the Business Forecasting and Predictive Intelligence Summit. San Francisco October 17th -18th 2013
This document discusses demand planning and the influences on the supply chain. It begins by introducing demand planning and how understanding consumer behavior is key. It then outlines several factors that influence demand, including the marketing mix of product, place, price, and promotion. It also discusses demand patterns like trends, seasonality, and cycles. The document emphasizes that demand planning requires analyzing data from various sources to understand the consumer and forecast future demand. It concludes that demand planning is both an art and a science that requires collaboration between stakeholders.
Spinnaker's SAP team hosts a webinar discussing our perspective on how companies should think about adopting SAP’s IBP solution. This webinar will answer the following questions:
What critical planning capabilities do world-class companies need?
How well does SAP IBP enable these capabilities?
How should you adopt the solution over time?
In today’s competitive manufacturing, distribution, and retail environments, firms must innovate and improve their supply chain capabilities to achieve profitability and growth objectives. Companies need real-time analytics to become more demand-driven and rapidly adjust supply chain decisions based on downstream behavior and consumption.
In response to these challenges, SAP’s IBP solution represents a significant step forward in building SAP’s supply chain planning capabilities. This webinar summarizes Spinnaker’s perspective on why companies should consider SAP IBP and provides insight on how to develop the right roadmap for your organization to build on and improve critical planning capabilities.
GitaCloud SAP IBP for Inventory Webinar May 25th 2018Ashutosh Bansal
This slide deck was used during the webinar jointly hosted by GitaCloud, SAP, and Demand Driven Institute on 25th May, 2018. It focuses on SAP Integrated Business Planning IBP for Inventory 1805 application capabilities.
The content includes:
1. IBP for Inventory Overview from Beatrice Hulde (IBP for Inventory Solution Owner, SAP)
2. Demand Driven MRP Overview from Chad Smith (Co-Partner, Demand Driven Institute)
3. Detailed showcase of SAP IBP for Inventory across MEIO and DDMRP approaches from Ashutosh Bansal (President & CEO, GitaCloud)
SAP IBP for Inventory can improve revenue and margin through a reduction in stock-outs related lost sales, reduction in expedite costs & inventory carrying costs, and help you run a more efficient business by right sizing inventories to release working capital. Interested in evaluating SAP IBP for your business? You can reach out to GitaCloud team at connect@gitacloud.com.
If you would like to ramp-up on IBP on your own, access learning.gitacloud.com for SAP IBP Digital Learning content.
Visit www.gitacloud.com to learn more about GitaCloud.
The document summarizes a seminar on supply chain planning theory and best practices. It includes an agenda for the event covering topics like demand planning, replenishment planning, production planning, buffer stocks, and industry trends. Recent trends discussed include increased collaboration across supply chain partners and a movement toward centralized planning over decentralized approaches. The presentation aims to explain key supply chain planning concepts and challenges through case studies and examples.
Hierarchical planning - process that translates annual business & marketing plans & demand forecasts into a production plan for a product family (products that share similar characteristics) in a plant or facility leading to the Aggregate Production Plan (APP)
Planning horizon of APP is at least one year & is usually rolled forward by three months every quarter
Includes costs relevant to the aggregate planning decision include inventory, setup, machine operation, hiring, firing, training, & overtime costs
Thank you for the presentation. I appreciate you taking the time to share your insights on aligning corporate strategic vision with S&OP/IBP processes.
This document discusses how a large paint company implemented business process management (BPM) to improve its order taking and query handling processes. It used SAP BPM, CRM, and NetWeaver to create a next-generation interaction model that eliminated paper-based order taking and allowed call agents to process over 100,000 orders per day. The new system provided dynamic SKU identification, order restrictions based on business rules, and integration with telephony. It also helped address master data management challenges by separating responsibilities between different SAP applications like MDM, BPM, and PI. The BPM-orchestrated processes improved efficiency, visibility, quality, and the user experience.
SAP Learning Hub - Integrated Business PlanningLejlaseperovic
SAP Integrated Business Planning (IBP) is a cloud-based planning tool from SAP for supply chain management. It consists of five applications: Supply Chain Control Tower, Sales & Operations Planning, Integrated Business Planning for inventory, demand, and response/supply. These applications allow users to integrate demand, supply, inventory, and finance planning in one system. IBP aims to provide more advanced planning capabilities than traditional systems. It has web and Excel interfaces and is used across various industries by companies worldwide. SAP's Learning Hub provides an IBP Learning Room with courses to help users gain skills in IBP's configuration and specialized applications.
Demand Planning Leadership Exchange: 10 Tips for SAP DP | Part 1 Plan4Demand
For More Information visit www.plan4demand.com | Call 866-P4D-INFO | or Email info@plan4demand.com
Whether you are just implementing SAP's Demand Planning Module or have been "Live" for ages, Part 1 of this 2 Part series will cover SAP DP Forecasting and design tips for all occasions.
Watch to learn practical tips and gain real world insights into these specific areas!
- Demand Planning Hierarchies
- Demand Histories
- Statistical Forecasting
- Product Lifecycle Management
- Total Forecast Fit
Presented by Gary D. Griffith and Jerry Sanderson
Check out this webinar on-demand at http://www.plan4demand.com/Video-10-Tips-for-SAP--APO-DP-Part-1
Next-generation integrated business planning: The Deloitte Perspective | AnaplanAnaplan
How can smart planning help your business become more agile and connected? What business activities can benefit from an integrated, real-time planning approach?
In this informative webinar, Bart Hughes from Deloitte will share perspectives on what business planning activites to integrate and when to do so on the journey to integrated business planning (IBP). You’ll gain perspective from Deloitte planning process experts across Finance, Sales, HR, and Supply Chain on how next-generation IBP can benefit your business and the steps you can take to get there.
https://www.anaplan.com/webinars/next-generation-integrated-business/
Eclipse Con2009 Practical Process OrchestrationDietmar Schmidt
The Business Process Execution Language for Web Services (BPEL) is frequently used to implement business processes on a technical level. BPEL allows describing long-running workflows using graphical editors to present workflows on human-friendly diagrams.
Recently open source implementations like the Orchestration Director Engine (ODE) developed from the Apache Foundation and the Eclipse BPEL project have reached a maturity level which enables their use in a productive environment.
Advanced integration features like dynamic endpoint resolution or policy driven configuration require a SOA runtime framework. We present the integration of ODE and the Eclipse BPEL editor with Eclipse Swordfish. Our extensions to the eclipse BPEL editor support the whole process development cycle including both visual and textual process design, deployment and testing. Web service meta data can be imported from the Swordfish service registry, orchestrated services can directly be registered as service providers and used by other services. Sample projects and wizards reduce the required familiarization effort.
Contains most of the standard SAP CS process, related data objects, configuration aspects in Logistics modules SD, PM, and integration touchpoints with FI-CO.
Quality Statements and Seven Steps to Strategic Quality PlanningDr.Raja R
What is a quality statement?, Quality statements and tenders, What does a quality statement include?, Define the term strategy?,
Vision Statement, Mission Statement, Quality Policy Statement and seven steps to strategic Quality Planning
Here is the Part 4 of six sigma training course. Skillogic is providing training for both six sigma black and green belt courses along with certification.
Skillogic classroom training available in Bangalore, Chennai and Hyderabad. For mode details visit website.
What is the business value of my project?Joe Raynus
Most projects do not meet their expected business goals even if they are completed on time and on budget. The presentation argues that project teams need to focus more on strategic alignment and delivering business value rather than just meeting schedules and budgets. It recommends that project managers develop a clear problem statement and value proposition upfront, and define project outcomes and benefits in a business case to better link project work to organizational strategy and goals. Taking a more strategic approach will help ensure projects are delivering the expected value and benefits to stakeholders.
Assignment:
Course Project: Analyze Resource Implications
Note: Please review the Course Project Overview (found under Week 1) before beginning this assignment.
When planning for change in student support programs, you must consider myriad financial and human resources implications. For this part of your Course Project, you will determine which resources will be required to make your program a reality. Consider the current financial and political environment at your institution when analyzing the necessary resources.
***Assignment****
How will you use data to guide your decisions in allocating financial and human resources? Prepare a 2- to 3-page paper, to be submitted outlining the following:
· The financial resources required for the new program
· The human resources required to start and sustain the new program
· A description of the roles and responsibilities of the relevant staff
· A rationale to support your decisions
Note: It is not necessary to specify dollar amounts for budgetary items or specific position titles. Simply describe the types of resources (financial and human) needed to support your program.
Assignment length: 2–3 pages
SWOT Analysis
Running head: SWOT ANALYSIS
1
SWOT ANALYSIS
2
SWOT Analysis
In the BlueShield Company procedures followed were mainly granted and modeled by the training programs offered by the company as well as our education system. This allows for the company to therefore, be a better organization. However, the models we learned are not applicable in reality. We, therefore, have to plan in order to be well prepared (Leiber et al., 2018).
Planning mainly constitutes analyzing our organization. In this, the planning will have to consider the last place of our organization and its future. The organization has to be inspected to find out its strengths, weaknesses, possible threats, as well as the available opportunities in order for it to be successful (Menga et al., 2015).
Objectives
The main objective of this SWOT analysis is to state the main ambition of BlueShield company and inspect the weaknesses, possible opportunities as well as threats that would deter the company from achieving its set goal. The analysis would also outline the present state of the company and its future.
Strengths
Weaknesses
· The professional staff is engaged in the company.
· There is a huge number of employees in the company.
· Unskilled labor force to supplement the number of employees.
· Employees focus more on the output, they therefore, make errors which lead to clients’ dissatisfaction. This action will cost the company and can cost them dearly.
· Customers who visit the company per year are almost close to 120 million which is a good number.
· Collaborations with other companies have always been strong.
· The process of supplying facilities by the company is realized by courier vehicles.
· Outreach programs in society are strengthened in the company’s welfare activities.
· The company has many depar.
The Value Initiative tool suite provides a set of tools to help clients identify value-creating ideas and optimize their project portfolios. The key tools include the Enterprise Value Map, ValueLink, MapIt!, PriorIt!, and Portfolio Landscape. The Enterprise Value Map depicts how value is created and can be used to measure performance, identify projects, and develop hypotheses. ValueLink electronically links improvement initiatives to the Value Map. MapIt! and PriorIt! help allocate projects across the Value Map and prioritize based on risk and value. Portfolio Landscape is a comprehensive tool that manages the full portfolio optimization process. The tools help clients focus on the right projects and initiatives to improve performance.
Linking Strategy to Metrics - KPI working Group Presentation 5Chikodi Onyemerela
This document discusses the importance of linking strategy to metrics for the British Council. It defines key terms like strategy, metrics, and KPIs. The document provides examples of different types of metrics that could be used by the British Council, including product, market, communication, and new product development metrics. It also discusses frameworks like the balanced scorecard that can be used to link strategic objectives to metrics across key areas like finance, customers, internal processes, and learning/growth. Overall, the document advocates for using the right metrics to measure strategy and ensure resources are focused on achieving organizational goals.
Integrating A.I. and Machine Learning with your Demand ForecastSteve Sager
This document provides an overview of Demand Guru, a demand forecasting and predictive analytics solution. Some key points:
- Demand Guru uses machine learning and external data sources to model demand, account for causal factors, and test scenarios. This improves upon traditional statistical forecasting.
- It incorporates over 550,000 external time series datasets on topics like weather, economic, market and other data. This allows for better understanding of demand drivers.
- The solution can model "what if" scenarios to understand how changes might impact demand and make more confident decisions. This is done in a risk-free virtual environment.
- Demand Guru is presented as augmenting rather than replacing existing demand
Best Practices in Financial Planning and Analysis | 2013 Business Analytics S...Cartegraph
Loras College is proud to present our annual Business Analytics Symposium on March 27, 2014 at the Grand River Center in Dubuque, IA. Industry experts will share their insights about the evolving field of business analytics opportunities. Learn about everything from best practices when analyzing data to the importance and benefits of building a culture of analytics within your organization.
To learn more, secure your seat or to take advantage of group discounts visit www.loras.edu/bigdata.
INTEGRATIVE PROJECT BSC FLEXIBILITY & THE CUSTOMER PERSPECTIVE2.docxmariuse18nolet
INTEGRATIVE PROJECT: BSC FLEXIBILITY & THE CUSTOMER PERSPECTIVE 2
INTEGRATIVE PROJECT: BSC FLEXIBILITY & THE CUSTOMER PERSPECTIVE PAGE 4
INTEGRATIVE PROJECT: BSC FLEXIBILITY & THE CUSTOMER PERSPECTIVE PAGE 3
REVIEW: BSC FLEXIBILITY & THE CUSTOMER PERSPECTIVE
SESSION LONG PROJECT
STUDENT, TRIDENT UNIVERSITY INTERNATIONAL
INTEGRATIVE PROJECT: BSC FLEXIBILITY & THE CUSTOMER PERSPECTIVE 1
PRINCIPLES OF ACCOUNTING: MANAGERIAL ACCOUNTING-BUDGETING PAGE
Abstract
For Module 2, consider your organization's mission and strategy from the perspective of its potential, prospective, and present customers. In this section of the assignment you’ll begin to identify objectives and measures relevant to that perspective. Refer back to the presentation Objectives, Measures, Targets & Action Plans if you need to.
Once you’re reasonably clear on what’s involved, think about your organization and its customers/clients/users/service recipients/whatever-you-wish-to-call-them, and then:
• Identify at least three objectives for the organization's customer service perspective and show how they relate to the mission, vision, and strategy of the organization.
• For each objective, develop at least one meaningful performance measure (metric).
• For each objective, identify at least one expected level of performance (target).
• For each objective, identify at least one new action or program that needs to be developed to ensure successful implementation of the organization's strategy (initiative).
• Comment briefly on the relationships of the customer service objectives that you've identified here to the financial objectives that you identified in the Module 1 SLP assignment. How do they help to fulfill those objectives? If they don't (and they don't have to), what makes them more important than objectives that would relate to finances?
• Finally, do you wish to make any changes to your Module 1 objective write-up in light of your Module 2 experience?
Nike Organization
Every organization should have objectives in their business plan so as to have something to gear them towards success. The objectives should be understood by the organization’s executives and also the employees. This will be of great advantage because everybody in the organization will work hard to attain the targets.
The first target of the organization is to increase the number of customers by 20% in the first financial year. This calculation of the increase will be done by subtracting the average number of customers in the previous financial year from the average number of customers in current financial year. Divide the difference with the average number of customers in the previous financial year and then multiplying by one hundred. The strategy to increase the number of customers is by increasing the type of products produced by Nike. This will attract the customers due to the variety which will not be ex.
Board Reporting Framework - Engage your board members and keep them strategic!Artique Consulting
The document provides an overview of an integrated reporting framework for a board of directors. It includes sections on board reporting requirements, typical reporting frameworks, guiding principles, dashboard examples, and content areas. The framework aims to provide concise, reliable information on strategic objectives and performance, business management, risks, finances, quality, benchmarks, and stakeholder engagement. Dashboards include strategic outcomes, company profile, financial performance, and business development. Key principles are strategic focus, connectivity of information, future orientation, and responsiveness.
Running head pROJECT DELIVERABLE 21pROJECT DELIVERABLE 28.docxjeanettehully
Running head: pROJECT DELIVERABLE 2
1
pROJECT DELIVERABLE 2
8Business Requirements Document
Charles Tinsley
Dr. Mark Cohen
CIS 599
July 28, 2019
Business Requirements Document
Providing better services to customers is one of the keys to a successful business. Fulfilling customer’s requirements helps achieve customers satisfaction; an important tool that drives the business towards achievement. Customers’ requirements are those needs that determine whether or not the customer needs have been satisfied with the products. According to Spacey (2017), a customer requirement is a specification that originates with customers as opposed to internal stakeholders. This can include both functional and non-function requirements for products, services and experiences.Definition of the Scope and how to Control the Scope of the Project
After brainstorming and interviewing customers, there was a need to implement the voice of a customer in the business. Voice of the customer involves capturing customer’s needs and expectations before coming up with a product, services, and brands. According to Saeed et al. study (2013), Innovation and new product development connected with “customer needs and expectations” differs across the marketing, engineering, and industrial design literature. The goods in the market are of a high quality due to the customer’s input during production. Customers know what they want. Therefore, involving them during production ensures that the goods produced to meet their needs. This business aims at providing customers with better services and products. Therefore, ensuring that customers are satisfied by getting their feedback can be used as a control to using Voice of Customers. Assessing increase in profits will also help define whether this strategy is working.
Feedbacks and profits realized after the implementation of Voice of Customer (VoC) will use as a way to realize workability of this scope. Positive feedbacks from customers will mean that their needs have been fully satisfied. However, negative feedbacks will mean more has to be done. Better strategies will have to be implemented to ensure mass satisfaction of the customers. When balancing the books of account, the profits increase that will be realized after the implementation of VoC will mean success in the strategy. However, no profits or losses will be linked to the failure in workability of the strategy.Possible Risks, Constraints, and Assumptions
This strategy has four distinct components, namely; Listening (collecting data), understanding (analyzing data for insights), sharing (distributing the insights), and taking action. Having all the four components to work will involve using a lot of resources from the company. The risks associated will be getting individualized needs from the customers. Every customer has his/her needs. It will be therefore, hard for the analyzers to determine the need that will be likely to cause customers’ satisfaction and achieve busines ...
C&S Wholesale Grocers re-engineered their demand planning process through organizational changes, process rationalization, and new technology. They consolidated teams, standardized processes, and automated manual tasks. This improved forecasting accuracy and expanded capabilities. C&S implemented an Oracle demand planning application to further automate processes, provide better visibility, and improve collaboration with retailers and suppliers. The re-engineering approach of focusing on people, processes, and technology helped C&S maximize efficiency and build a premier supply chain.
Business Concept Funding Proposal PowerPoint Presentation SlidesSlideTeam
If your company needs to submit a Business Concept Funding Proposal PowerPoint Presentation Slides look no further.Our researchers have analyzed thousands of proposals on this topic for effectiveness and conversion. Just download our template, add your company data and submit to your client for a positive response. http://bit.ly/2v8Dxu2
2008 Nov Lessons Learned Lean Six Sigma Balanced Scorecardhfroehling1
This document discusses lessons learned from deploying Lean Six Sigma in services organizations. It provides an overview of key differences between manufacturing and services and discusses challenges in applying Lean Six Sigma tools. The document also discusses approaches to strategic project selection using Balanced Scorecard and Theory of Constraints and outlines lessons learned around deployment criteria, roles, training, and measurement. Current trends indicate Lean Six Sigma is moving towards a more integrated approach and being applied in smaller organizations and healthcare.
Increasing Vehicle Outsourcing ( % Of Car Value ) EssayAlison Reed
The document summarizes recommendations from Team 5 to improve the overdue payment process at Ramsville. They created a current value stream map that identified issues like long lead times of 196,200 seconds. Recommendations include reducing batch sizes to process invoices continuously, increasing checking time at PFR Check to reduce errors, and standardizing data entry to streamline the process. These changes aim to eliminate waste and non-value added activities to improve supplier relationships and satisfaction.
The document discusses Hoshin Kanri, a strategic planning process that involves:
1) Conducting an environmental scan to identify business objectives and targets for key performance indicators.
2) Developing a comprehensive list of projects to meet the objectives and targets, then evaluating projects to create a priority portfolio.
3) Implementing the project portfolio through a review process involving "Project 2x2" reports, and reflecting on results to improve processes and tools for achieving targets.
This issues log document contains information about various issues related to a project. It includes columns for issue ID, description, impact on scope, schedule and cost, action plan/resolution, owner, importance, dates, and status. The document appears to be tracking issues for multiple projects.
This issues log document contains information about various issues related to a project. It includes columns for issue ID, description, impact on scope, schedule and cost, action plan/resolution, owner, importance, dates and status. The document appears to be tracking issues for multiple projects.
This issues log contains information about various issues related to a project. It includes columns for the issue ID, description, impact on scope, schedule and cost, the proposed action plan/resolution, who is responsible for managing the issue, the importance of the issue, and dates for when the issue was entered, needs to be reviewed by, and was resolved. The log does not currently contain any specific issues listed, but provides the framework for tracking project issues.
This issues log document contains information about various issues related to a project. It includes columns for issue ID, description, impact on scope, schedule and cost, action plan/resolution, owner, importance, dates and status. The document appears to be tracking issues for multiple projects.
Similar to Demand and Integrated Business Planning (20)
How are Lilac French Bulldogs Beauty Charming the World and Capturing Hearts....Lacey Max
“After being the most listed dog breed in the United States for 31
years in a row, the Labrador Retriever has dropped to second place
in the American Kennel Club's annual survey of the country's most
popular canines. The French Bulldog is the new top dog in the
United States as of 2022. The stylish puppy has ascended the
rankings in rapid time despite having health concerns and limited
color choices.”
The 10 Most Influential Leaders Guiding Corporate Evolution, 2024.pdfthesiliconleaders
In the recent edition, The 10 Most Influential Leaders Guiding Corporate Evolution, 2024, The Silicon Leaders magazine gladly features Dejan Štancer, President of the Global Chamber of Business Leaders (GCBL), along with other leaders.
❼❷⓿❺❻❷❽❷❼❽ Dpboss Matka Result Satta Matka Guessing Satta Fix jodi Kalyan Final ank Satta Matka Dpbos Final ank Satta Matta Matka 143 Kalyan Matka Guessing Final Matka Final ank Today Matka 420 Satta Batta Satta 143 Kalyan Chart Main Bazar Chart vip Matka Guessing Dpboss 143 Guessing Kalyan night
Industrial Tech SW: Category Renewal and CreationChristian Dahlen
Every industrial revolution has created a new set of categories and a new set of players.
Multiple new technologies have emerged, but Samsara and C3.ai are only two companies which have gone public so far.
Manufacturing startups constitute the largest pipeline share of unicorns and IPO candidates in the SF Bay Area, and software startups dominate in Germany.
Company Valuation webinar series - Tuesday, 4 June 2024FelixPerez547899
This session provided an update as to the latest valuation data in the UK and then delved into a discussion on the upcoming election and the impacts on valuation. We finished, as always with a Q&A
Zodiac Signs and Food Preferences_ What Your Sign Says About Your Tastemy Pandit
Know what your zodiac sign says about your taste in food! Explore how the 12 zodiac signs influence your culinary preferences with insights from MyPandit. Dive into astrology and flavors!
IMPACT Silver is a pure silver zinc producer with over $260 million in revenue since 2008 and a large 100% owned 210km Mexico land package - 2024 catalysts includes new 14% grade zinc Plomosas mine and 20,000m of fully funded exploration drilling.
Understanding User Needs and Satisfying ThemAggregage
https://www.productmanagementtoday.com/frs/26903918/understanding-user-needs-and-satisfying-them
We know we want to create products which our customers find to be valuable. Whether we label it as customer-centric or product-led depends on how long we've been doing product management. There are three challenges we face when doing this. The obvious challenge is figuring out what our users need; the non-obvious challenges are in creating a shared understanding of those needs and in sensing if what we're doing is meeting those needs.
In this webinar, we won't focus on the research methods for discovering user-needs. We will focus on synthesis of the needs we discover, communication and alignment tools, and how we operationalize addressing those needs.
Industry expert Scott Sehlhorst will:
• Introduce a taxonomy for user goals with real world examples
• Present the Onion Diagram, a tool for contextualizing task-level goals
• Illustrate how customer journey maps capture activity-level and task-level goals
• Demonstrate the best approach to selection and prioritization of user-goals to address
• Highlight the crucial benchmarks, observable changes, in ensuring fulfillment of customer needs
Structural Design Process: Step-by-Step Guide for BuildingsChandresh Chudasama
The structural design process is explained: Follow our step-by-step guide to understand building design intricacies and ensure structural integrity. Learn how to build wonderful buildings with the help of our detailed information. Learn how to create structures with durability and reliability and also gain insights on ways of managing structures.
Anny Serafina Love - Letter of Recommendation by Kellen Harkins, MS.AnnySerafinaLove
This letter, written by Kellen Harkins, Course Director at Full Sail University, commends Anny Love's exemplary performance in the Video Sharing Platforms class. It highlights her dedication, willingness to challenge herself, and exceptional skills in production, editing, and marketing across various video platforms like YouTube, TikTok, and Instagram.
Brian Fitzsimmons on the Business Strategy and Content Flywheel of Barstool S...Neil Horowitz
On episode 272 of the Digital and Social Media Sports Podcast, Neil chatted with Brian Fitzsimmons, Director of Licensing and Business Development for Barstool Sports.
What follows is a collection of snippets from the podcast. To hear the full interview and more, check out the podcast on all podcast platforms and at www.dsmsports.net
SATTA MATKA SATTA FAST RESULT KALYAN TOP MATKA RESULT KALYAN SATTA MATKA FAST RESULT MILAN RATAN RAJDHANI MAIN BAZAR MATKA FAST TIPS RESULT MATKA CHART JODI CHART PANEL CHART FREE FIX GAME SATTAMATKA ! MATKA MOBI SATTA 143 spboss.in TOP NO1 RESULT FULL RATE MATKA ONLINE GAME PLAY BY APP SPBOSS
[To download this presentation, visit:
https://www.oeconsulting.com.sg/training-presentations]
This PowerPoint compilation offers a comprehensive overview of 20 leading innovation management frameworks and methodologies, selected for their broad applicability across various industries and organizational contexts. These frameworks are valuable resources for a wide range of users, including business professionals, educators, and consultants.
Each framework is presented with visually engaging diagrams and templates, ensuring the content is both informative and appealing. While this compilation is thorough, please note that the slides are intended as supplementary resources and may not be sufficient for standalone instructional purposes.
This compilation is ideal for anyone looking to enhance their understanding of innovation management and drive meaningful change within their organization. Whether you aim to improve product development processes, enhance customer experiences, or drive digital transformation, these frameworks offer valuable insights and tools to help you achieve your goals.
INCLUDED FRAMEWORKS/MODELS:
1. Stanford’s Design Thinking
2. IDEO’s Human-Centered Design
3. Strategyzer’s Business Model Innovation
4. Lean Startup Methodology
5. Agile Innovation Framework
6. Doblin’s Ten Types of Innovation
7. McKinsey’s Three Horizons of Growth
8. Customer Journey Map
9. Christensen’s Disruptive Innovation Theory
10. Blue Ocean Strategy
11. Strategyn’s Jobs-To-Be-Done (JTBD) Framework with Job Map
12. Design Sprint Framework
13. The Double Diamond
14. Lean Six Sigma DMAIC
15. TRIZ Problem-Solving Framework
16. Edward de Bono’s Six Thinking Hats
17. Stage-Gate Model
18. Toyota’s Six Steps of Kaizen
19. Microsoft’s Digital Transformation Framework
20. Design for Six Sigma (DFSS)
To download this presentation, visit:
https://www.oeconsulting.com.sg/training-presentations
2. 2
Agenda: 1 hour
Demand and Integrated Business Planning
A story about a strategic supply chain capability…
3. 3
• better understand the basic
concepts behind Demand
Planning (DP) and Integrated
Business Planning (IBP)
Objectives
Figure 1
At the end of the
presentation you should:
• be able to endorse the need for
the capabilities and review the
proposed framework
• better understand what you
and your teams will need to do
to support the capabilities
4. 4― Warren Buffett
American business magnate, investor and philanthropist
“Someone's sitting in the
shade today because
someone planted a tree a
long time ago.”
Introduction
Figure 2
5. 5
Where are we today?
• Do we know whether
our short term
operational decisions
are aligned with our
long term strategy?
• Are we continuously working together
towards a single, shared plan?
• Do we understand
our cross
functional (sales,
marketing, supply,
finance) objectives
and priorities?
• Do we understand the needs of our
customers and are we able to
clearly demonstrate our value? • Are we able to
negotiate the
best contract
terms with our
suppliers?
No, not really…Figure 3
6. 6
Where we are…
• We lack visibility into our
customers and our supply
chain requirements… • We aren’t able to adjust to
changing conditions because
we can’t analyse our options
accurately and quickly…
• We aren’t able to
consistently identify
areas for improvement…
an organisation without demand planning (DP)
and integrated business planning (IBP)…
Figure 4
7. 7
• DP and IBP are best practice
capabilities that help key stakeholders
make better decisions.
• The capabilities help key
stakeholders identify
areas for improvement
and generate savings.
• The capabilities
ensure that key
stakeholders
continuously
work together
to develop a
shared
understanding of
short and long
term goals and
priorities.
Figure 5
Where we could be…
an organisation with demand planning (DP)
and integrated business planning (IBP)…
8. 8
Introduction
What benefits can we expect?
"Those companies without a robust Integrated
Business Planning process need to act now to close
the gap in capabilities and management support in
order to maintain their competiveness going
forward.“
S&OP - A Critical Process for Superior Performance
Brian Ball, Sep 2012, Aberdeen Group
"Companies that have successfully implemented
mature S&OP have seen significant improvements,
such as a 2% to 5% increase in revenue, a 7% to 15%
reduction in inventory."
Toolkit: S&OP Maturity Self-Assessment for Supply Chain Leaders,
Nicha Tohamy, Jan Kohler, Marko Pukkila, Debashis Tarafdar, Aug
2013, Gartner Group
reduced
inventory
18-46%
reduced
safety
stock
11-45%
increased
revenue
10-15%
increased
on-time
delivery
10-50%
increased
forecast
accuracy
18-25%
increased
productivity
30-45%
Source: QuintiQ. (2014, Oct 26). Closing the loop on S&OP Plans. Slide 8. Retrieved from
https://www.slideshare.net/quintiq/closing-the-loop-on-sop-plans
Source: Oliver Wight, Survey of 40 Clients
9. 9
Introduction
How have the capabilities evolved?
Source: Oliver Wight. (2017). Transition from S&OP. Retrieved from
http://www.oliverwightasiapacific.com/en-GB/integrated-business-planning/transition-from-sop
10. 10
Introduction
How do DP and IBP help key
stakeholders make better decisions?
SystemsProcess
People
11. 11
Introduction
• Key external stakeholders:
Who works together to develop a shared
understanding and generate savings?
• Key internal stakeholders:
Category Team
Service Delivery Team
Supply Team
Finance Team
Executive Team
12. 12
Introduction
How do the capabilities link to strategy?
Source: QuintiQ. (2014, Oct 26). Closing the loop on S&OP Plans. Slide 6. Retrieved from
https://www.slideshare.net/quintiq/closing-the-loop-on-sop-plans
13. 13
Introduction
• The basic building blocks are already in place and
the concepts and benefits are transferable.
We can implement DP and IBP:
Source: The Institute of Business Planning and Forecasting
• Over the past 30 years, many leading
enterprises across a wide variety of
industries have been able to successfully
implement these capabilities.
SystemsProcess
People
• We have the basic organisation
structure, roles and data
required to get started.
14. 14
― Leonardo da Vinci
Italian polymath whose areas of interest included invention, painting,
sculpting, architecture, science, music, mathematics, engineering, literature,
anatomy, geology, astronomy, botany, writing, history and cartography
“Learning is the only
thing the mind never
exhausts, never fears,
and never regrets.”
Key Concepts
Figure 6
15. Key Concepts
What, Who, When, How
15
• A demand plan is a consensus
projection of the materials and
services that an organisation
expects to provide to its customers.
What is a demand plan?
• The plan is developed in units and
communicated in all terms
required by stakeholders.
• The plan includes projections for
both current (baseline) and new
materials and services and looks
forward at least 18 months.
16. Key Concepts
What, Who, When, How
16
Who provides input to a demand plan?
• A demand plan represents a
commitment to the customer and is
developed with input from those
closest to the customer.
Service Delivery &
Category Teams
• A demand plan is
created on a rolling
monthly basis.
• Each month provides
an opportunity to
review performance
(using forecast
accuracy and
forecast bias metrics)
and assumptions.
When is the demand plan created?
17. 17
How does the plan get integrated?
Key Concepts
What, Who, When, How
Source: Oliver Wight International. Integrated Business Planning. Retrieved from
https://supplychainblog.aimms.com/2014/04/an-introduction-to-integrated-business-planning-optimization/
Demand Planning Process
Customer InputCategory Input
Integrated Business Planning Process
Source: Crum, C. with Palmatier, G. E. (2003). Demand Management Best Practices: Process,
Principles and Collaboration. Integrated Management Series. Cover. J. Ross Publishing.
18. 18
Every organisation’s DP and IBP capabilities are unique…
Key Concepts
What, Who, When, How
Source: QuintiQ. (2014, Oct 26). Closing the loop on S&OP Plans. Slide 7. Retrieved from
https://www.slideshare.net/quintiq/closing-the-loop-on-sop-plans
19. Key Concepts
Capability Maturity Stages
19
Phases II and III
(13 to 24 Months)
Specialised System
Stage 3
Internally based
consensus plan
Stage 4
External partner
collaboration
Stage 5
Network
collaboration
• tight collaboration
between internal
functions
• consensus-driven
demand plan that
considers
operational risk
• increased financial
alignment
• demand-planning
segmentation
frameworks
• value-chain-
based demand
plan
• integration with
NPI process
• demand-planning
COE
• outside-in view of
demand
• network-based
demand plan
• support new
demand streams
• joint, value-chain-
focused metrics
Excel based (Adhoc)
Phase I (Next 12 Months)
Baseline forecast
generation
Standardised,
scalable
processes
Stage 1
Stage 2
• usage driven,
bottom up forecast
• short-term
execution focus
• inside-out view of
demand
• siloed functions
• statistical forecast
using historical
data
• formal demand-
planning
organisation
• Emerging internal
collaboration
The demand
planning
capability
will be
introduced in
stages.
Source: Salley, A. & Tarafdar, D. (2015). Apply the Supply Chain Maturity Model for Better Demand Planning. Page 6.
Retrieved from https://www.gartner.com/doc/3033826/apply-supply-chain-maturity-model
20. Key Concepts
Capability Decision Tools (Trend Analysis)
20
Demand
Planning will
work with key
stakeholders to
create forward
forecasts that
consider both
future
assumptions
and past
usage.
Values Values
Category
Total Usage AUD$
(Past 12 Months using
AVG Price)
Total Forecast AUD$
(Next 12 Months
using AVG Price)
Total Usage Quantity
(Past 12 Months)
Total Forecast
Quantity
(Next 12 Months)
%
Difference
Quantity
ABC Matrix Rank
Total Usage Quantity
(Past 12 Months)
Total Forecast
Quantity
(Next 12 Months)
% Difference
Cateogry 1 $10,629,413 $11,274,107 13,156,166 15,320,045 16.4% A (Top 60%) 12,796,917 14,977,783 17.0%
Category 2 $3,640,189 $4,219,232 13,248 12,574 -5.1% B (Next 20%) 2,719,712 2,735,692 0.6%
Category 3 $1,072,478 $1,182,029 977,099 1,084,377 11.0% C (Next 15%) 1,462,140 1,477,125 1.0%
Category 4 $612,377 $678,335 442,728 415,111 -6.2% D (Final 5%) 269,250 254,303 -5.6%
Category 5 $596,208 $579,370 2,555,408 2,500,699 -2.1% F 0 0 0.0%
Category 6 $372,831 $405,217 67,671 79,358 17.3% Total 17,248,019 19,444,902 12.7%
Category 7 $92,149 $96,822 35,425 32,714 -7.7%
Category 8 $5,120 $5,238 22 23 3.9%
Category 9 $6,129 $0 253 0 -100.0%
Total $17,026,893 $18,440,351 17,248,019 19,444,902 12.7%
21. Key Concepts
Capability Decision Tools (Forecast Bias Detection)
21
• bias towards
overestimating usage
expectations
Chronic
Over Forecasting
Chronic
Under Forecasting
Root
Cause
Impact
• excess of inventory
• shortage of working
capital
• bias towards
underestimating
usage expectations
• shortage of
inventory
• low customer
service levels
• high out of stocks
Demand
Planning will
work with key
stakeholders to
identify
forecast bias
and improve
accuracy.
22. Key Concepts
Capability Decision Tools (Segmentation Strategies)
22
New Active
End
of Life
Product Life CycleABC Classification
A
C
B
D
Dimensions:
1. Quantity
2. AUD$
3. Strategic or Other Priority
Predictability
Demand
Planning will
work with key
stakeholders to
identify
priorities using
various
segmentation
strategies.
23. The following
segmentation
analysis can
be used to
better
understand
priorities for
one region.
Similar
opportunities
exist for other
regions.
Key Concepts
Capability Decision Tools (Segmentation Strategies)
23
Why do we
support so many
D SKU’s? These
items only
contribute 5%
towards revenue
yet consume
considerable
resources and
add complexity.
Are our SKU’s in
the correct MRP
type inventory
category and at
the correct life
cycle stage?
24. Key Concepts
Capability Decision Tools (Integrated Summary)
24
Demand
Planning will
work with key
stakeholders to
create
dashboards to
provide visibility
of forward
forecasts by
region.
As the capability matures,
the dashboards will
include projections for
forward procurement and
inventory and the
planning horizon will
extend.
Values Values Material Count
Category
Total Usage AUD$
(Past 12 Months
using AVG Price)
Total Forecast
AUD$ (Next 12
Months using
AVG Price)
Total Usage
Quantity (Past 12
Months)
Total Forecast
Quantity
(Next 12
Months)
%
Difference
Quantity
ABC Matrix Rank
Total Usage
Quantity
(Past 12 Months)
Total Forecast
Quantity
(Next 12
Months)
% Difference Row Labels
V1
(DC Stock)
PD
(Vendor Direct)
ND
(Vendor Direct)
Total
Category 1 $10,629,413 $11,274,107 13,156,166 15,320,045 16.4% A (Top 60%) 12,796,917 14,977,783 17.0% A (Top 60%) 253 216 14 483
Category 2 $3,640,189 $4,219,232 13,248 12,574 -5.1% B (Next 20%) 2,719,712 2,735,692 0.6% B (Next 20%) 253 462 29 744
Category 3 $1,072,478 $1,182,029 977,099 1,084,377 11.0% C (Next 15%) 1,462,140 1,477,125 1.0% C (Next 15%) 462 1,414 55 1,931
Category 4 $612,377 $678,335 442,728 415,111 -6.2% D (Final 5%) 269,250 254,303 -5.6% D (Final 5%) 801 3,824 497 5,122
Category 5 $596,208 $579,370 2,555,408 2,500,699 -2.1% F 0 0 0.0% F 104 1,130 205 1,439
Category 6 $372,831 $405,217 67,671 79,358 17.3% Total 17,248,019 19,444,902 12.7% Total 1,873 7,046 800 9,719
Category 7 $92,149 $96,822 35,425 32,714 -7.7%
Category 8 $5,120 $5,238 22 23 3.9% Category (All)
Category 9 $6,129 $0 253 0 -100.0%
Total $17,026,893 $18,440,351 17,248,019 19,444,902 12.7% Material Count Potential Life Cycle State
ABC Matrix Rank NEW (<6 mon) ACT EOL (0 in 6 mon) Total
A (Top 60%) 2 446 38 486
B Next 20% 33 614 98 745
C (Next 15%) 134 1,385 414 1,933
D (Final 5%) 598 2,323 2,207 5,128
F 0 0 1,461 1,461
Total 767 4,768 4,218 9,753
Sum of Total Fiscal Year FAMMIS SOA Status Sum of Total Fiscal Year FAMMIS SOA Status Sum of Total Measure Fiscal Year
2016 YTD 2016 YTD Grand Total 2016 YTD 2016 YTD AUD$ AUD$ Qty Qty
Cost Centre Name Cost Centre No SOA SOA Material Group Name Material Group No SOA SOA ABC Matrix Rank 2016 YTD 2015 2016 YTD 2015
Centre 1 710412 1,315,310 85,480 1,400,791 Centre 1 651525 1,432,530 77,444 A (Top 60%) 6,174,126 10,608,662 7,912,750 14,376,856
Centre 2 710353 1,025,020 118,581 1,143,601 Centre 2 651538 1,059,365 179,798 B (Next 20%) 2,346,613 3,271,152 1,730,407 3,053,896
Centre 3 630336 845,272 142,591 987,863 Centre 3 651020 739,438 78,942 C (Next 15%) 1,777,403 2,382,261 997,590 1,534,210
Centre 4 710404 546,687 52,076 598,763 Centre 4 651521 730,392 50,491 D (Final 5%) 597,461 767,902 178,746 294,789
Centre 5 630410 542,998 46,998 589,997 Centre 5 651524 621,823 106,826 Total 10,895,603 17,029,978 10,819,493 19,259,751
0%
10%
20%
30%
40%
50%
60%
70%
80%
90%
-200,000 0 200,000 400,000 600,000 800,000 1,000,000 1,200,000 1,400,000 1,600,000
Predicability(RSauarePast12Month)
PRODUCT IMPORTANCE
(Quantity Past 12 Month Usage)
"A" "B" "C"
y = -9457.6x+2E+06
R² = 0.2965
y = 38124x+36440
R² = 0.5669
0
500,000
1,000,000
1,500,000
2,000,000
2,500,000
3,000,000
Sumof
Jul
Sumof
Aug
Sumof
Sep
Sumof
Oct
Sumof
Nov
Sumof
Dec
Sumof
Jan
Sumof
Feb
Sumof
Mar
Sumof
Apr
Sumof
May
Sumof
Jun
Sumof
Jul
Sumof
Aug
Sumof
Sep
Sumof
Oct
Sumof
Nov
Sumof
Dec
Sumof
Jan
Sumof
Feb
Sumof
Mar
Sumof
Apr
Sumof
May
Sumof
Jun
Sumof
Jul
Sumof
Aug
Sumof
Sep
Sumof
Oct
Sumof
Nov
Sumof
Dec
Sumof
Jan
Sumof
Feb
Sumof
Mar
Sumof
Apr
Sumof
May
Sumof
Jun
2014 2015 2016YTD
Summary by Fiscal Month
(QTY Jul-2013 to Feb-2016)
Material Free Text 2017 Forecast 2017 Forecast
Use the Pivot Tables to review regional usage by either quantity (QTY) or dollars (AUD$). The tables can be used to review data from the following perspectives:
· Category View (use Category, Material Group, Material GroupName, OA TrackingNumber, Material , Primary Vendor or Primary Vendor Name bythe appropriate Measure and PO Type )
· Regional View (use Business Area, Cost Centre, Material, Supply Plant by the appropriate Measure and PO Type)
· Supply View (use Primary Vendor, Primary VendorName, Supply Plant, ABC Matrix Rank by the appropriate Measure and PO Type)
· Finance View (use Cost Element, Cost Centre, ABC Matrix Rank by the appropriate Measure and PO Type)
Considerations:
· The forecast summary tables utilise the concept of material average price (tocontrol for the impacts of price variance allowing a clearer comparison of past to future quantities). The usage summary tables utilise the AUD$ derived directly from FAMMIS KSB1 data.
· In the future, the report will be expanded to include projections for forward procurement and forward inventory (as the demand planning capability is further developed).
18,902,531 19,259,751
10,819,493
4,528,237
6,479,430
10,288,075
0
5,000,000
10,000,000
15,000,000
20,000,000
25,000,000
30,000,000
2014 2015 2016YTD
Summary by Fiscal Year
(QTY Jul-2013 to Feb-2016)
Material Free Text
REGIONAL DEMAND PLANNING DASHBOARD (Concept Only)
Forecast and Usage for Region B
Data Source: FAMMIS KSB1 for WA (Goods Issues) and WE (PO Goods Receipts) document types and cost centres BA0000 to BA9999
Measure: QTY or AUD$ Period: Fiscal Year from Jul-2013 to Feb-2016
Data and Approach Require Validation by Stakeholders
17,301,802
17,949,590
10,273,823
917,324 645,670 202,949 527,581 571,161
286,719
5,943 3,000
74,054
59,196
32,813 29,170
27,501
19,672
48,661
504
4,528
0
10,000
20,000
30,000
40,000
50,000
60,000
70,000
80,000
0
2,000,000
4,000,000
6,000,000
8,000,000
10,000,000
12,000,000
14,000,000
16,000,000
18,000,000
20,000,000
2014 2015 2016YTD 2014 2015 2016YTD 2014 2015 2016YTD 2015 2014
71 63 39 10 78
Summary by Supply Type and Plant by Fiscal Year
(QTY>1000, Material Only, Jul-2013 to Feb-2016)
WA (Goods Issues) WE (PO Receipts)
Use the table to validate the FAMMIS
MRP Type against the 2 dimensional
ABC ranking (QTY and AUD$). Review
V1 materials with a D or F class (these
materials add cost and complexity
and should be reconsidered unless
they fulfil a clinical or strategic need).
Review PD and ND materials with an
A or B class (to ensure sufficient
customer service levels are
maintained). Double click on a cell to
R squared is an indicator of the
degree of fit with the forecast model.
0% indicates that the model explains
none of the variability (of the data
around its mean). 100% indicates that
the model explains all of the
variability (of the data around its
mean). A low value does not
necessarily mean that a model is a
poor fit. However, judgement is
required.
1,364,869
1,259,858
1,379,8621,351,7981,333,869
1,537,787
1,200,203
1,391,248
y = 4074.1x+1E+06
R² = 0.0101
0
200,000
400,000
600,000
800,000
1,000,000
1,200,000
1,400,000
1,600,000
1,800,000
2,000,000
Sum of Jul Sum of Aug Sum of Sep Sum of Oct Sum of Nov Sum of Dec Sum of Jan Sum of Feb Sum of Mar Sum of Apr Sum of May Sum of Jun
Summary by Fiscal Month (Material Only)
(QTY Jul-2013 to Feb-2016)
2014 2015 2016 2017 Forecast
TOP COST CENTRES
(AUD$ 2016 YTD Demand Type = Material)
TOP MATERIAL GROUPS
(AUD$ 2016 YTD Demand Type = Material)
FOUR QUADRANT MODEL
(for differentially managing the demand forecast, classification period: Jul-2014 to Feb-2016)
Quadrant 3
Low Importance and
HighPredictability
Quadrant 1
HighImportance and
High Predictability
Quadrant 4
Low Importance and
Low Predictability
Quadrant 2
HighImportance and
Low Predictability
3
1
4
2
ABC CLASSIFICATION and PRODUCT LIFE CYCLE ANALYSIS
(for differentially managing the demand forecast, classification period: Jul-2014 to Feb-2016)
FORWARD FORECAST SUMMARIES
(QTY and AUD$, past 12 months and next 12 months, using Excel linear trend algorithm and 2016YTD material average price)
Use the table to review the product
life cycle stage against the 2
dimensional ABC ranking (QTY and
AUD$). Review NEW and ACT
materials with a D class (these
materials add cost and complexity
and should be reconsidered unless
they fulfil a clinical or strategic need).
Review EOL materials and consider
phase out and replacement options.
Double click on a cell to get a detail
list to review.
9,899,006
996,598
0
2,000,000
4,000,000
6,000,000
8,000,000
10,000,000
12,000,000
No SOA SOA
2016YTD
SOA Status Summary
(AUD$ 2016YTD Material and Free Text)
Material
329
157
359
386
504
1,429
0
500
1,000
1,500
2,000
2,500
continuous intermittent
Demand Signal Type (Material Only)
(Count)
A B C
USAGE SUMMARIES
25. Key Concepts
Process and People
25
Demand
Planning will
work with key
stakeholders to
develop a
calendar to
support
requirements.
26. Key Concepts
Systems
26
Demand Planning
will work with key
stakeholders to
identify specific
system
requirements.
Visionaries
LeadersChallengers
Niche Players
Source: Payne, T. (2015, April 29). Magic Quadrant for Sales and Operations Planning Systems of Differentiation.
Page 2. Retrieved from https://www.gartner.com/doc/reprints?id=1-2EC75A5&ct=150501&st=sb
27. Key Concepts
Systems
27
DP and IBP
systems will need
to integrate with
other key systems
(including both
ERP and data
warehouse
systems.)
28. 28
― Charles Kettering
Founder of Delco, American inventor, engineer, businessman
“High achievement
always takes place
in the framework of
high expectation.”
Project Framework
Figure 7
29. Framework
Considerations
29
• The project framework has been endorsed by two specialised Gartner analysts
and a leadership partner.
• The project goal statements align with demand management best practices:
Oliver Wight, Institute of Business Forecasting and Planning, Gartner
• The project will be using a phased approach both to minimise risk and to provide
an opportunity for progress review and approval at each phase.
• The project will be using a task based approach to ensure all project goal and
scope statements are considered and delivered at the appropriate time.
30. Framework
Considerations
30
The 34 page project framework document outlines the project approach and
considers the following aspects in detail:
• Project Definition
• Project Scope
• Project Plan
• Key Participants
• Project Constraints and Risk Assessment
• Project Principles and Communication
31. 31
― Jeff Bezos
an American engineer, technology and retail entrepreneur,
investor and philanthropist best known as the founder, chairman,
and chief executive officer of Amazon
“If you don’t
understand
the details of
your business
you are going
to fail.”
Framework Detail
Figure 8
32. 32
Supporting documents have been removed to protect confidentiality.
Framework Detail
The Opportunity
The capabilities
will address
critical gaps.
The capabilities
will deliver
defined benefits.
The capabilities
will be delivered
using a task
based and
phased
approach.
A communication
plan has been
developed to
engage key
stakeholders.
The capabilities
will meet
defined process,
system and
people
objectives.
Project roles
have been
clearly defined.
Project team
members have
been selected
from critical,
cross functional
business areas.
Risks have been
identified and
will be managed.
33. 33
Where would we like to be?
The capabilities
would enable us to:
• make better
decisions,
• work together
towards common
goals,
• generate savings.
Do we agree with the
proposed benefits
and the need for the
capabilities?
Organisations with Demand Planning
and Integrated Business Planning
Figure 9
34. 34
Conclusion
What comes next?
• Do we agree with the
proposed, phased
approach?
• Do we have your
support to continue
with Phase I?
• Do we have your
support to progress
to Phase II?
Figure 10
35. Othersupplychainstories…
Aligned Supply Chain Metrics
Twomey, Elaine. (2017, Mar). Retrieved from https://www.slideshare.net/ElaineTwomey1/aligned-supply-chain-metrics
Aligned New Product Development (NPD) Approval Process
Twomey, Elaine. (2017, Feb). Retrieved from https://www.slideshare.net/ElaineTwomey1/aligned-new-product-development-npd-approval-process
36. Othersupplychainstories…
Demand and Integrated Business Planning
Twomey, Elaine. (2016, Jun). Retrieved from https://www.slideshare.net/ElaineTwomey1/demand-and-integrated-business-planning
Supply Chain Experience
Twomey, Elaine. (2017). Retrieved from
https://www.slideshare.net/ElaineTwomey1/supply-chain-experience
Process Improvement and Project Management Portfolio
Twomey, Elaine. (2017). Retrieved from
https://www.slideshare.net/ElaineTwomey1/process-improvement-and-project-management-portfolio
37. 37
References
Sources
Figures (copy links to browser to view sources):
Cover Ozerina, Anna. (Illustrator). Elegant Background [digital image]. Retrieved from
https://www.shutterstock.com/image-vector/elegant-background-place-text-invitation-69112300
Figure 1 Kovop58. (Photographer). Hiker with Backpack [digital image]. Retrieved from
https://www.shutterstock.com/image-photo/young-tourist-hiker-backpack-siting-on-559594144
Figure 2 Isett, Stuart. (Photographer). Warren Buffet [digital image]. Retrieved from
http://images.huffingtonpost.com/2015-12-02-1449084331-7797041-warren_buffet_spotlight.jpg
Figure 3 Cracho, Sfio. (Photographer). Businessman Flying [digital image]. Retrieved from
https://www.shutterstock.com/image-photo/businessman-flying-rocket-backpack-trough-business-181968668
Figure 4 Rido. (Photographer). Business team hiding their faces [digital image]. Retrieved from https://www.shutterstock.com/image-photo/business-
team-hiding-their-faces-behind-95466670
Figure 5 Rawpixel.com. (Photographer). Direction Decision Chance [digital image]. Retrieved from
https://www.shutterstock.com/image-photo/direction-decision-chance-opportunity-intersection-concept-261757220
Figure 6 Myper. (Photographer). Leonardo da Vinci [digital image]. Retrieved from
https://www.shutterstock.com/image-photo/leonardo-da-vinci-one-greatest-mind-9178411
Figure 7 (Photographer). Charles Kettering [digital image]. Retrieved from
http://www.365daysofmotoring.com/showonthisday/article/13413
Figure 8 (Photographer). Jeff Bezos [digital image]. Retrieved from
https://img.washingtonpost.com/rf/image_1484w/2010-2019/WashingtonPost/2013/08/05/National-Enterprise/Images/151367140-2098.jpg
Figure 9 Kurhan. (Photographer). Group of Industrial Workers [digital image]. Retrieved from
https://www.shutterstock.com/image-photo/group-industrial-workers-business-team-isolated-108943724
Figure 10 Alphaspirit. (Photographer). Business Team Drawing a new Complex Project [digital image]. Retrieved from
https://www.shutterstock.com/image-photo/business-team-drawing-new-complex-project-496380232
39. 39
Demand and Integrated Business Planning
a strategic supply chain capability…
• These documents are at a draft
stage and are intended to illustrate
concepts only…
• The next step is to seek input from
key stakeholders…