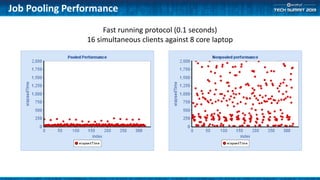
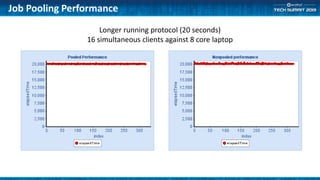
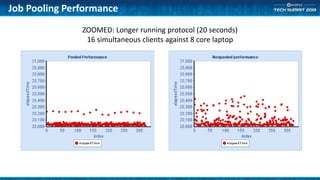
(ATS6-PLAT06) Maximizing AEP
Performance
Steven Bush
R&D, AEP Core Infrastructure
steven.bush@accelrys.com
The information on the roadmap and future software development efforts are
intended to outline general product direction and should not be relied on in making
a purchasing decision.
Content
• Tuning for different types of protocols
• Quick protocols
– Protocol Job Pooling
• Using PoolIDs
• Database connection pooling
• Long protocols
– Profiling protocols
– Tuning parallel subprotocols
– Disk I/O
• Server specifications
– General guidelines
– Cluster, Grid, and Load balancing
• When is it right and how do you choose?
Short Running: General Guidelines
• Job Pooling and blocking requests
– Use Database connection sharing
• Report templates
– “HTML Template” or “Pilotscript” components
– Much faster
– Harder to maintain
– Ideal for reports that rarely change
• Pilotscript is faster than Java is faster than Perl
• Minimize disk I/O
• Hashmap values instead of “Join Data From …”
– Use Cache Persistence mode in SQL Select for each Data
Job Pooling
• Each job execution occurs in a single scisvr process
– Isolated memory
– One bad protocol cannot crash the server
• Without job pooling, each job spawns a new process
• With job pooling, jobs with the same pool ID can reuse
idle processes
Job Pooling Performance
• Prevent reloading system files and configuration data
• Reuse allocated memory
• Skip initialization
• Fast running protocols see substantial improvement
• Longer protocols do not see much improvement
Job Pooling Performance
Fast running protocol (0.1 seconds)
16 simultaneous clients against 8 core laptop
Job Pooling Performance
Longer running protocol (20 seconds)
16 simultaneous clients against 8 core laptop
Job Pooling Performance
ZOOMED: Longer running protocol (20 seconds)
16 simultaneous clients against 8 core laptop
Job Pooling Disadvantages
• Some components may not reinitialize correctly
– Can be difficult to track down these errors
• Stale resources can cause subsequent protocol failure
– Example: persistent DB connections that have timed out at the DB
• Ties up memory resources
– The AEP server manages this and will shut down job pools when memory
resources begin to get low
• Can tie up 3rd party licenses if they are not properly released
• Hard to get a good grasp of how much memory is really being used
• Not as useful for Windows servers with “full” impersonation
Job Pooling Memory limits
• Under heavy memory usage, pooled processes will shut
down
– 80% total RAM usage
– 15% total RAM usage for an individual process
– Example: A server has 8 GB of RAM
• Idle pooled processes will shut down when RAM usage reaches 6.4 GB
• If an individual idle process reaches 1.2 GB, it will shut down
Debugging
• http://<server>:<port>/scitegic/managepools?action=debug
– Shows each pool by ID.
• Configuration
• Processes that belong to the pool
– PID
– Owner (impersonation only)
– Number of times the server has executed jobs (including warm ups)
– State
• Queue
– Apache Process/Threads that are waiting for a server in this pool
Using Job Pooling From Clients
• 9.0:
– Set the __poolID parameter on the Implementation tab of
the top level protocol
– Share the same __poolID with related protocols
Using Job Pooling From Clients
• 8.5
– Pro Client
• Automatic based on jobID
– Create Protocol Link…
• Add __poolID as a parameter to your URL
– http://<server>:<port>/auth/launchjob?_protocol=ABC&__poolID=MyPool
– Reporting Forms
• Add __poolID using “Hidden Form Data”
– Protocol Function
• use “Application ID” or “Pool ID” parameters
– Web Port and Reporting Protocol Links
• Add __poolID as a parameter to your protocol
– Client SDKs
• Pass in __poolID as a parameter when you call the LaunchXXX() methods
• Connection Timeout
– Keeps the connection
open while scisvr is idle
– Supported by ODBC and
JDBC data sources
Database Connection Sharing
Report Templates
• Web applications should consider using templates.
– HTML Template component
• Uses Velocity template engine
– Pilotscript text processing
• Extremely fast
• Good for reports that rarely change format
– Faster, but harder to maintain
– Difficult to handle images
• Typical timings:
– Table component and Viewer: 1.5 seconds
– HTML Template and Viewer: 0.7 seconds
– Pilotscript text manipulation: 0.05 seconds
• Use the reporting collection to create the original report, then view the source
and convert to a template
Long Running: General Guidelines
• Profile protocols for bottlenecks using Ctrl-T timings
• Disk I/O Performance
– Consider improving network disk I/O
– Minimize large scale disk I/O
• Use parallel subprotocols to speed up slow sections
– Offload large calculations to additional servers
– Make use of clusters and grids to spread out processing
• Make remote requests asynchronous or batched when possible
• Download large datasets and process locally
• Create custom readers to minimize excess data reading
– Don’t read 100000 records only to use the first 10 records.
Component Performance Timings
• Displays either percentage or total time for each
component.
– Subprotocols display total time of internal components plus
overhead
• Press Control-T or Right-Click->Show Process Times
• Useful to track down bottlenecks
• Times are relatively accurate.
– In particular, timings on Linux are susceptible to discrepancies
Disk I/O
• Performance of your disk I/O has huge impact
• Linux: Consider switching from NFS to IBM’s GPFS
– Much more scalable
– Much faster
• Minimize large disk read/writes.
Parallel Subprotocols
• Allow parallel execution across multiple CPUs and multiple servers or
cluster/grid nodes
• Work by batching incoming data records and sending out to server list for
processing
• General guidelines:
– Each batch should take a minimum 10 seconds to see a performance benefit, the
longer the better!
– Overhead
• Serializing input and output data records
• 1-3 seconds per batch
• Launching
• Polling for completion
• Serialization of data records
– 2 processes per CPU as starting point
Parallel Subprotocol Mechanism
• Modifies and launches “Parallel Subprotocol Template”
• Input data records are serialized, then shipped to remote
server
• Data is deserialized, processed, then serialized again
• Shipped back to original server and deserialized
• 4 Cache read/write events!
– Avoid sending large data records
– Consider sending file references instead
– For instance: with Imaging collection
Parallel Subprotocol Debugging
• Most remote errors are swallowed up
• Look in <root>/logs/messages/scitegicerror_scisvr.log of
the remote server to see error stacks
• Run with “Debugging” option
– use Shift-Left click or Shift-F5
– Debugging messages will show errors and status from the
subprotocol batches
Server Guidelines
• Predict and analyze your usage
– Type of application
– Number of simulataneous users
• Good starting point
– 2 active jobs per CPU
– RAM: Minimum 1 GB per active job + 2 GB for system processes
– Local disk for temporary files
– GPFS instead of NFS
Deployment Options
• Single Server
– Multiple CPUs
– Ideal for most applications
• Cluster (Linux)
– Distributes individual protocols to remote nodes
– Simple grid
– Ideal for ad-hoc analysis servers that occasionally require heavy processing
• Slower launch times than single server.
• Better data processing scalability
• Grid (Linux)
– Queues individual protocols via 3rd party grid software
– Tested on OGE, PBS, LSF. Custom option is available
– Ideal for large scale processing with very long application run times
• Slowest launch times
• Best data processing scalability
Deployment Options
• Load Balanced (Windows and Linux)
– Multiple identical single servers with a 3rdparty HTTP proxy
– Each individual request is distributed
– Protocol DB is READ-ONLY
• All changes are made through packages
– Parallel subprotocols do NOT distribute across nodes
– Ideal for canned applications that have large numbers of users
• Launch times are comparable to single server
• High scalability and high availability
• NOT useful as an ad-hoc server
• Cannot be used to build models (due to read-only Protocol DB)
• Optimization of protocol performance is application dependent
• For fast running protocols
– look at Job Pooling and Report Templates
– Avoid checkpoints and caches
• For long running protocols
– Use component timings to profile
– Parallelize whenever possible
– Batch and asynchronous remote requests
– Configure Disk I/O for maximum performance
• Deployment options for different applications
Summary

(ATS6-PLAT06) Maximizing AEP Performance

  • 1.
    (ATS6-PLAT06) Maximizing AEP Performance StevenBush R&D, AEP Core Infrastructure steven.bush@accelrys.com
  • 2.
    The information onthe roadmap and future software development efforts are intended to outline general product direction and should not be relied on in making a purchasing decision.
  • 3.
    Content • Tuning fordifferent types of protocols • Quick protocols – Protocol Job Pooling • Using PoolIDs • Database connection pooling • Long protocols – Profiling protocols – Tuning parallel subprotocols – Disk I/O • Server specifications – General guidelines – Cluster, Grid, and Load balancing • When is it right and how do you choose?
  • 4.
    Short Running: GeneralGuidelines • Job Pooling and blocking requests – Use Database connection sharing • Report templates – “HTML Template” or “Pilotscript” components – Much faster – Harder to maintain – Ideal for reports that rarely change • Pilotscript is faster than Java is faster than Perl • Minimize disk I/O • Hashmap values instead of “Join Data From …” – Use Cache Persistence mode in SQL Select for each Data
  • 5.
    Job Pooling • Eachjob execution occurs in a single scisvr process – Isolated memory – One bad protocol cannot crash the server • Without job pooling, each job spawns a new process • With job pooling, jobs with the same pool ID can reuse idle processes
  • 6.
    Job Pooling Performance •Prevent reloading system files and configuration data • Reuse allocated memory • Skip initialization • Fast running protocols see substantial improvement • Longer protocols do not see much improvement
  • 7.
    Job Pooling Performance Fastrunning protocol (0.1 seconds) 16 simultaneous clients against 8 core laptop
  • 8.
    Job Pooling Performance Longerrunning protocol (20 seconds) 16 simultaneous clients against 8 core laptop
  • 9.
    Job Pooling Performance ZOOMED:Longer running protocol (20 seconds) 16 simultaneous clients against 8 core laptop
  • 10.
    Job Pooling Disadvantages •Some components may not reinitialize correctly – Can be difficult to track down these errors • Stale resources can cause subsequent protocol failure – Example: persistent DB connections that have timed out at the DB • Ties up memory resources – The AEP server manages this and will shut down job pools when memory resources begin to get low • Can tie up 3rd party licenses if they are not properly released • Hard to get a good grasp of how much memory is really being used • Not as useful for Windows servers with “full” impersonation
  • 11.
    Job Pooling Memorylimits • Under heavy memory usage, pooled processes will shut down – 80% total RAM usage – 15% total RAM usage for an individual process – Example: A server has 8 GB of RAM • Idle pooled processes will shut down when RAM usage reaches 6.4 GB • If an individual idle process reaches 1.2 GB, it will shut down
  • 12.
    Debugging • http://<server>:<port>/scitegic/managepools?action=debug – Showseach pool by ID. • Configuration • Processes that belong to the pool – PID – Owner (impersonation only) – Number of times the server has executed jobs (including warm ups) – State • Queue – Apache Process/Threads that are waiting for a server in this pool
  • 13.
    Using Job PoolingFrom Clients • 9.0: – Set the __poolID parameter on the Implementation tab of the top level protocol – Share the same __poolID with related protocols
  • 14.
    Using Job PoolingFrom Clients • 8.5 – Pro Client • Automatic based on jobID – Create Protocol Link… • Add __poolID as a parameter to your URL – http://<server>:<port>/auth/launchjob?_protocol=ABC&__poolID=MyPool – Reporting Forms • Add __poolID using “Hidden Form Data” – Protocol Function • use “Application ID” or “Pool ID” parameters – Web Port and Reporting Protocol Links • Add __poolID as a parameter to your protocol – Client SDKs • Pass in __poolID as a parameter when you call the LaunchXXX() methods
  • 15.
    • Connection Timeout –Keeps the connection open while scisvr is idle – Supported by ODBC and JDBC data sources Database Connection Sharing
  • 16.
    Report Templates • Webapplications should consider using templates. – HTML Template component • Uses Velocity template engine – Pilotscript text processing • Extremely fast • Good for reports that rarely change format – Faster, but harder to maintain – Difficult to handle images • Typical timings: – Table component and Viewer: 1.5 seconds – HTML Template and Viewer: 0.7 seconds – Pilotscript text manipulation: 0.05 seconds • Use the reporting collection to create the original report, then view the source and convert to a template
  • 17.
    Long Running: GeneralGuidelines • Profile protocols for bottlenecks using Ctrl-T timings • Disk I/O Performance – Consider improving network disk I/O – Minimize large scale disk I/O • Use parallel subprotocols to speed up slow sections – Offload large calculations to additional servers – Make use of clusters and grids to spread out processing • Make remote requests asynchronous or batched when possible • Download large datasets and process locally • Create custom readers to minimize excess data reading – Don’t read 100000 records only to use the first 10 records.
  • 18.
    Component Performance Timings •Displays either percentage or total time for each component. – Subprotocols display total time of internal components plus overhead • Press Control-T or Right-Click->Show Process Times • Useful to track down bottlenecks • Times are relatively accurate. – In particular, timings on Linux are susceptible to discrepancies
  • 19.
    Disk I/O • Performanceof your disk I/O has huge impact • Linux: Consider switching from NFS to IBM’s GPFS – Much more scalable – Much faster • Minimize large disk read/writes.
  • 20.
    Parallel Subprotocols • Allowparallel execution across multiple CPUs and multiple servers or cluster/grid nodes • Work by batching incoming data records and sending out to server list for processing • General guidelines: – Each batch should take a minimum 10 seconds to see a performance benefit, the longer the better! – Overhead • Serializing input and output data records • 1-3 seconds per batch • Launching • Polling for completion • Serialization of data records – 2 processes per CPU as starting point
  • 21.
    Parallel Subprotocol Mechanism •Modifies and launches “Parallel Subprotocol Template” • Input data records are serialized, then shipped to remote server • Data is deserialized, processed, then serialized again • Shipped back to original server and deserialized • 4 Cache read/write events! – Avoid sending large data records – Consider sending file references instead – For instance: with Imaging collection
  • 22.
    Parallel Subprotocol Debugging •Most remote errors are swallowed up • Look in <root>/logs/messages/scitegicerror_scisvr.log of the remote server to see error stacks • Run with “Debugging” option – use Shift-Left click or Shift-F5 – Debugging messages will show errors and status from the subprotocol batches
  • 23.
    Server Guidelines • Predictand analyze your usage – Type of application – Number of simulataneous users • Good starting point – 2 active jobs per CPU – RAM: Minimum 1 GB per active job + 2 GB for system processes – Local disk for temporary files – GPFS instead of NFS
  • 24.
    Deployment Options • SingleServer – Multiple CPUs – Ideal for most applications • Cluster (Linux) – Distributes individual protocols to remote nodes – Simple grid – Ideal for ad-hoc analysis servers that occasionally require heavy processing • Slower launch times than single server. • Better data processing scalability • Grid (Linux) – Queues individual protocols via 3rd party grid software – Tested on OGE, PBS, LSF. Custom option is available – Ideal for large scale processing with very long application run times • Slowest launch times • Best data processing scalability
  • 25.
    Deployment Options • LoadBalanced (Windows and Linux) – Multiple identical single servers with a 3rdparty HTTP proxy – Each individual request is distributed – Protocol DB is READ-ONLY • All changes are made through packages – Parallel subprotocols do NOT distribute across nodes – Ideal for canned applications that have large numbers of users • Launch times are comparable to single server • High scalability and high availability • NOT useful as an ad-hoc server • Cannot be used to build models (due to read-only Protocol DB)
  • 26.
    • Optimization ofprotocol performance is application dependent • For fast running protocols – look at Job Pooling and Report Templates – Avoid checkpoints and caches • For long running protocols – Use component timings to profile – Parallelize whenever possible – Batch and asynchronous remote requests – Configure Disk I/O for maximum performance • Deployment options for different applications Summary