Download as PDF, PPTX


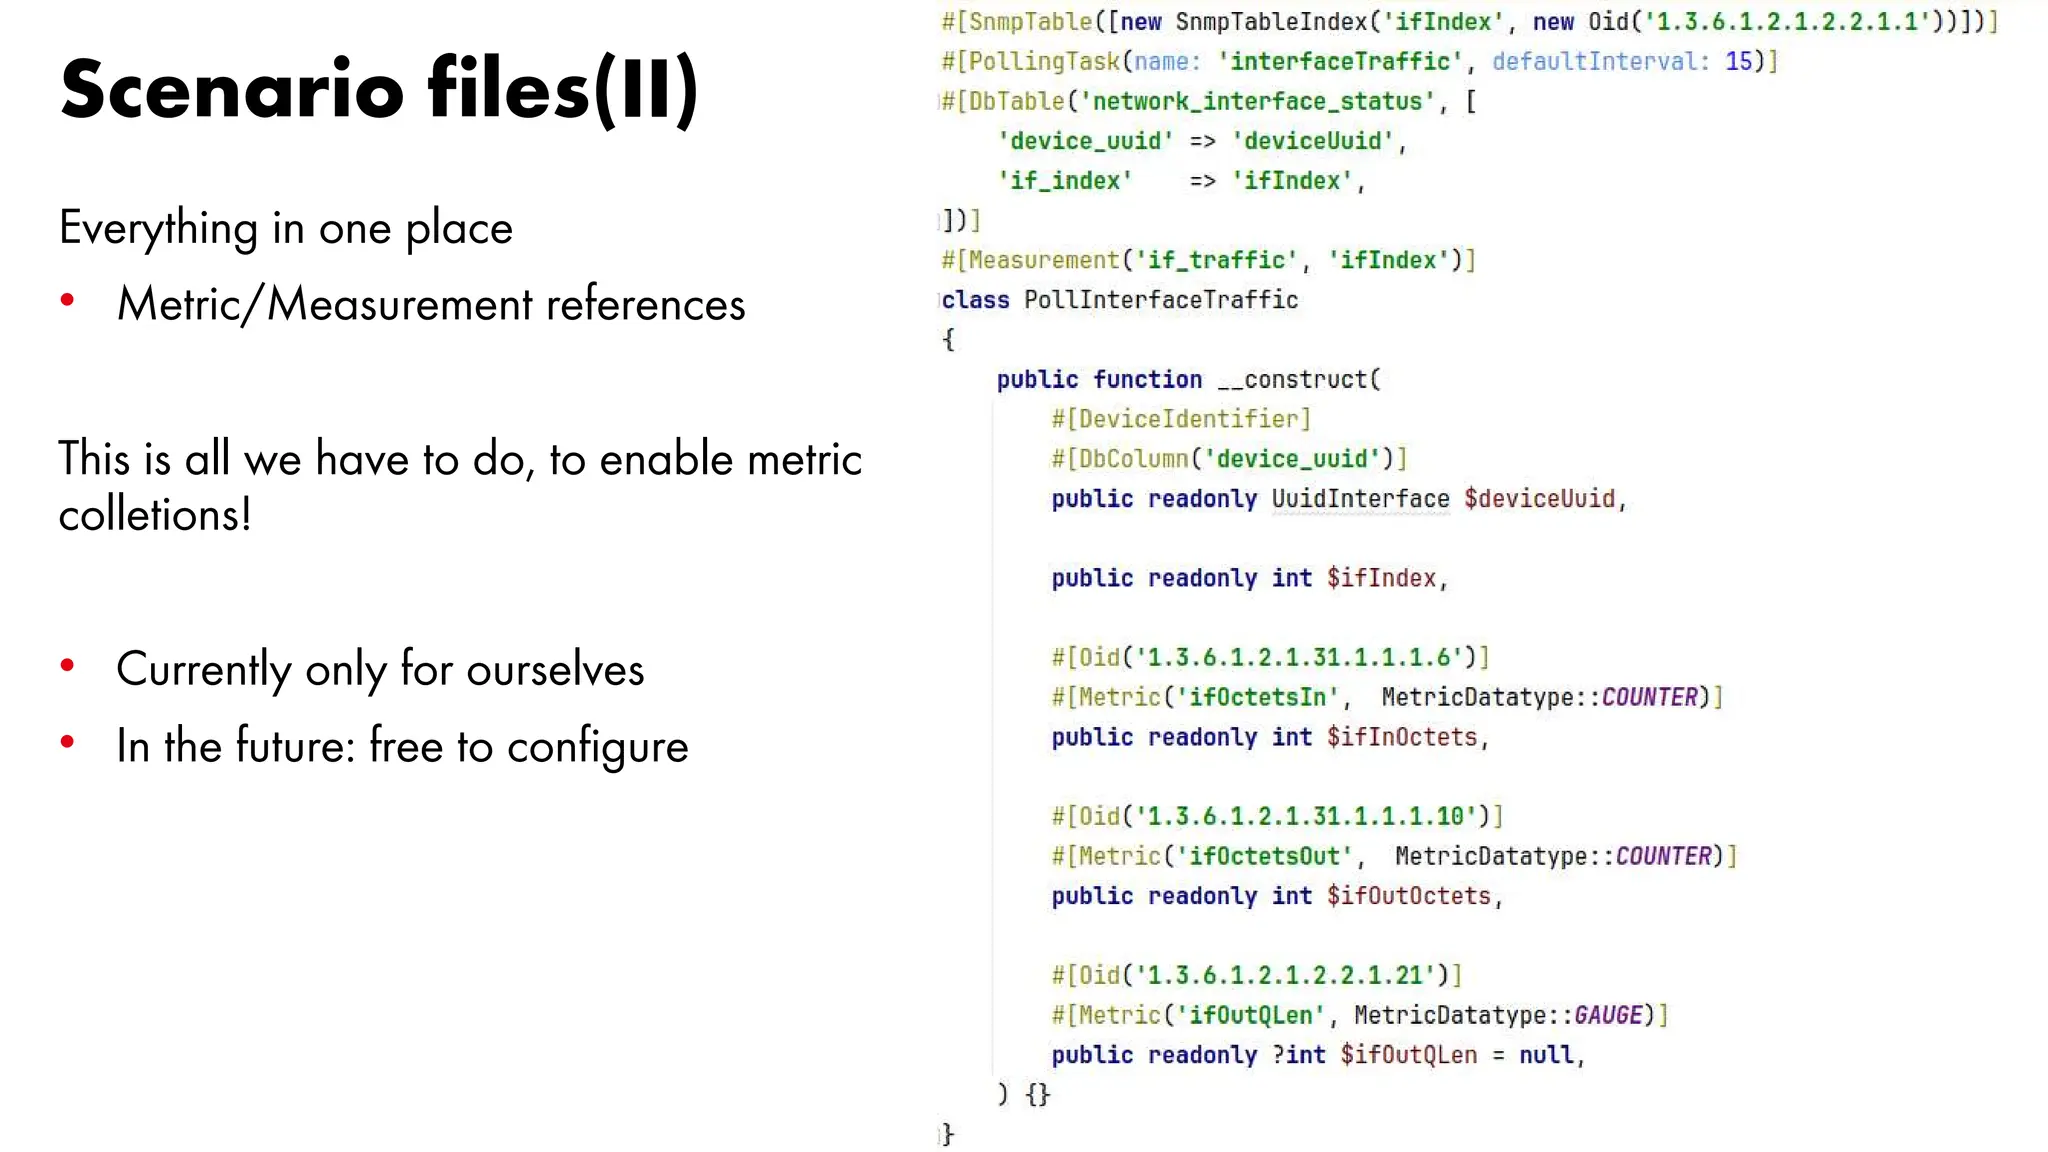
![Data transfer at maxium speed [1/6]
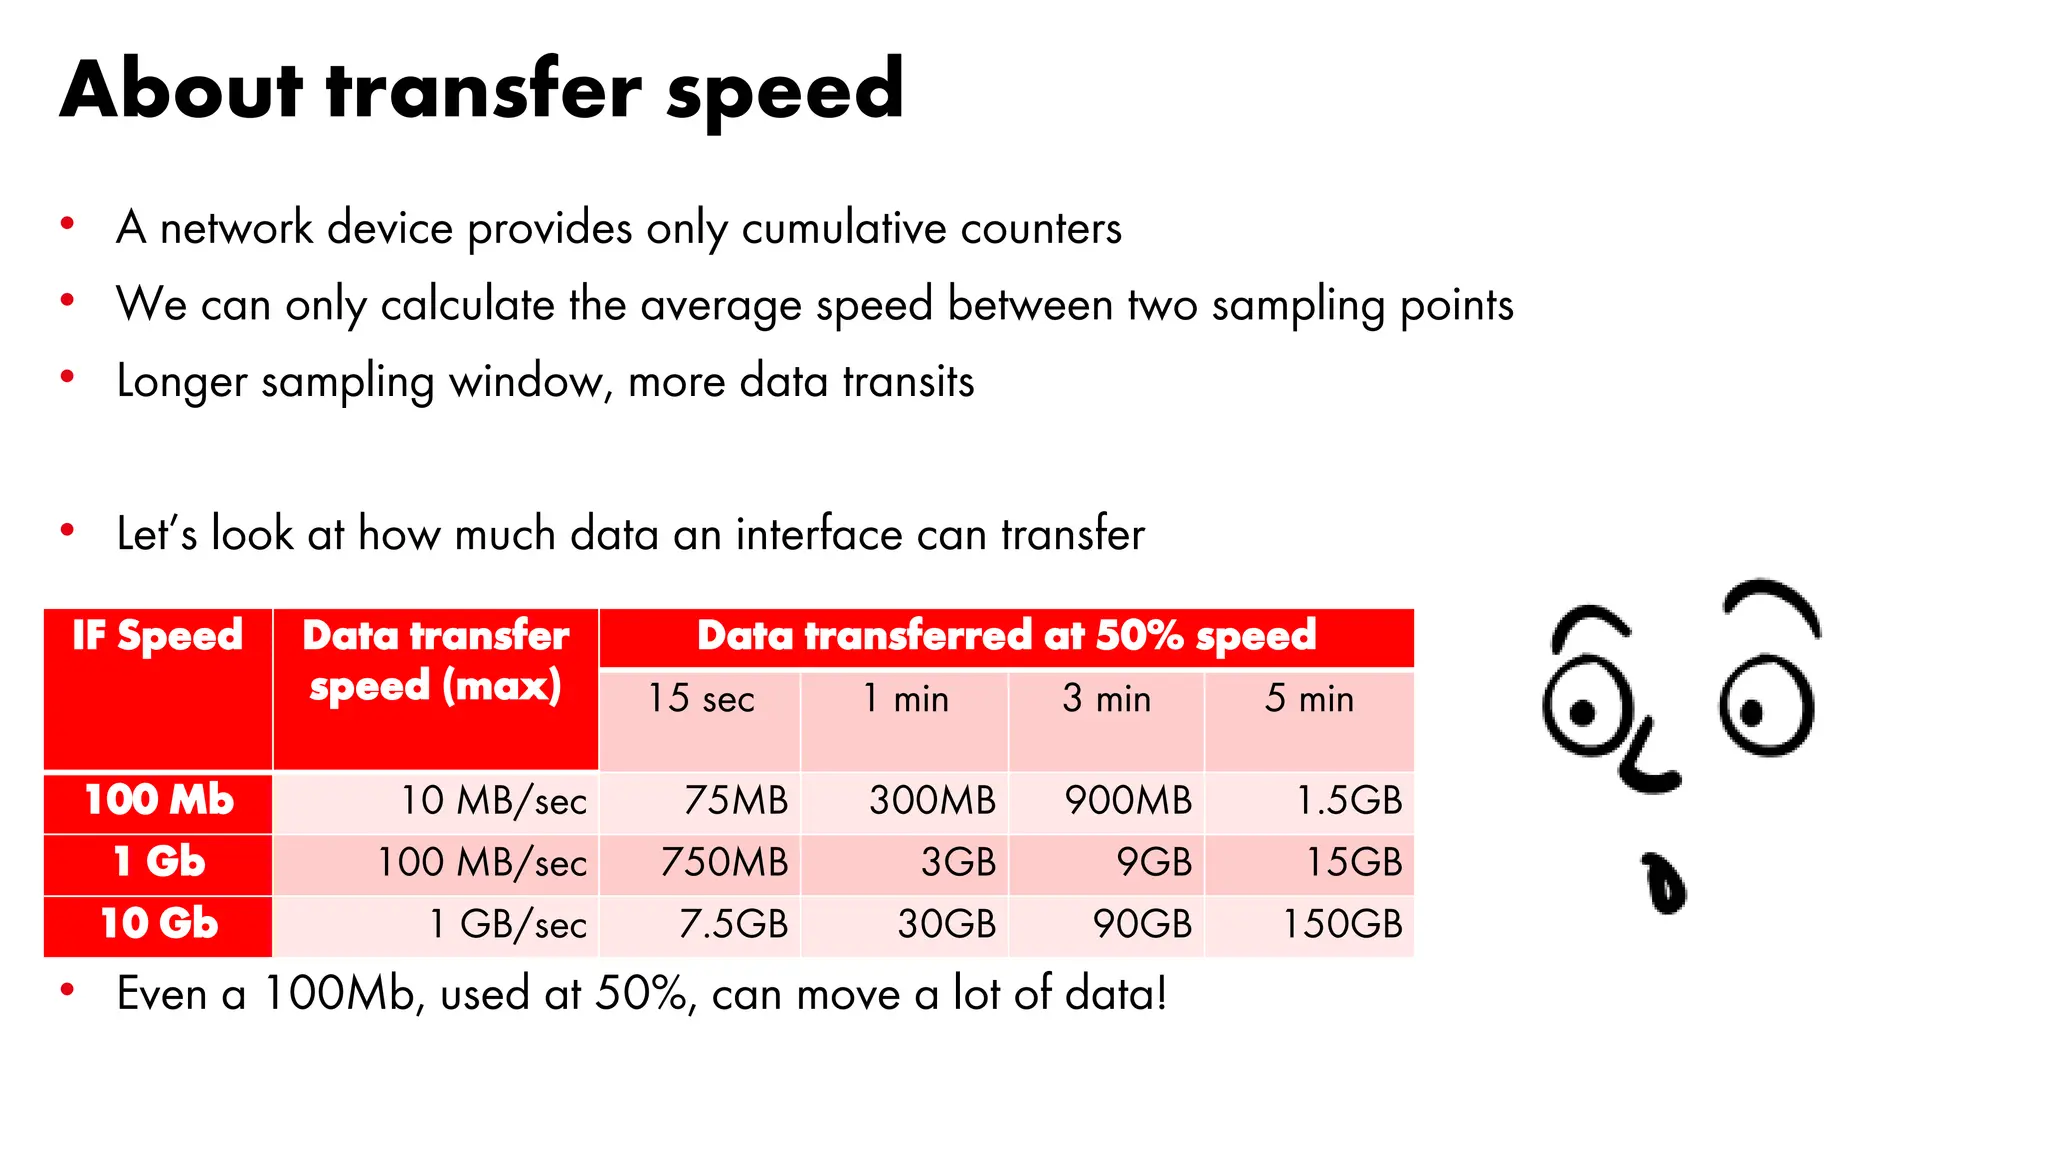
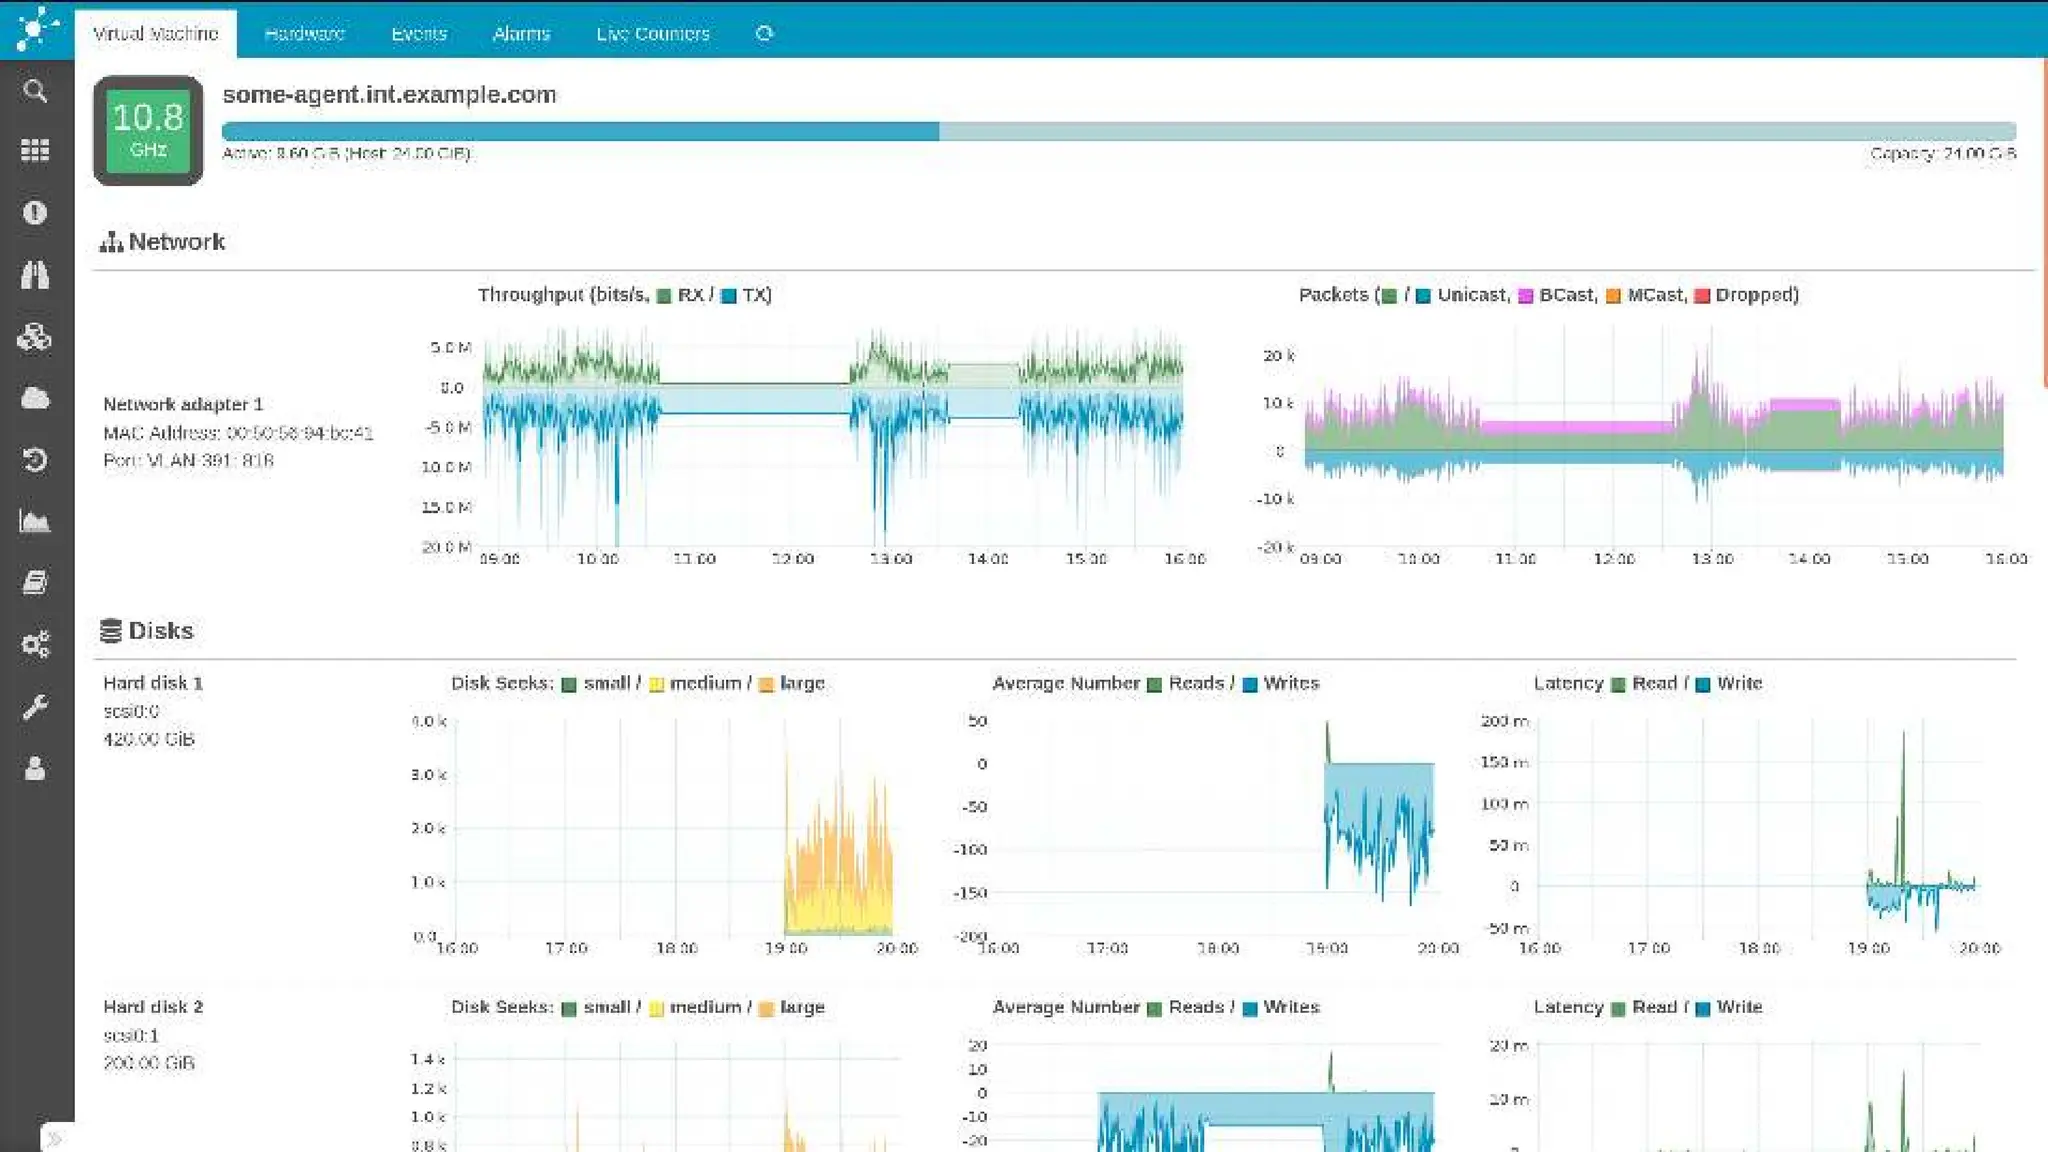
A simulated transfer: 20GB file over a link with different speed
Let’s see what happens with different sampling intervals:
• 5 minutes
• 3 minutes
• 1 minute
• 30 seconds
• 15 seconds](https://image.slidesharecdn.com/icingacampmilan2023compressed-231026084410-a1eb15b9/75/SNMP-Monitoring-at-scale-Icinga-Camp-Milan-2023-35-2048.jpg)
![Data transfer at maxium speed [2/6]
0 5 10 15 20 25 30 35 40 45
0,0
100,0
200,0
300,0
400,0
500,0
600,0
700,0
Time (min)
Transfer
speed
(MB/s)
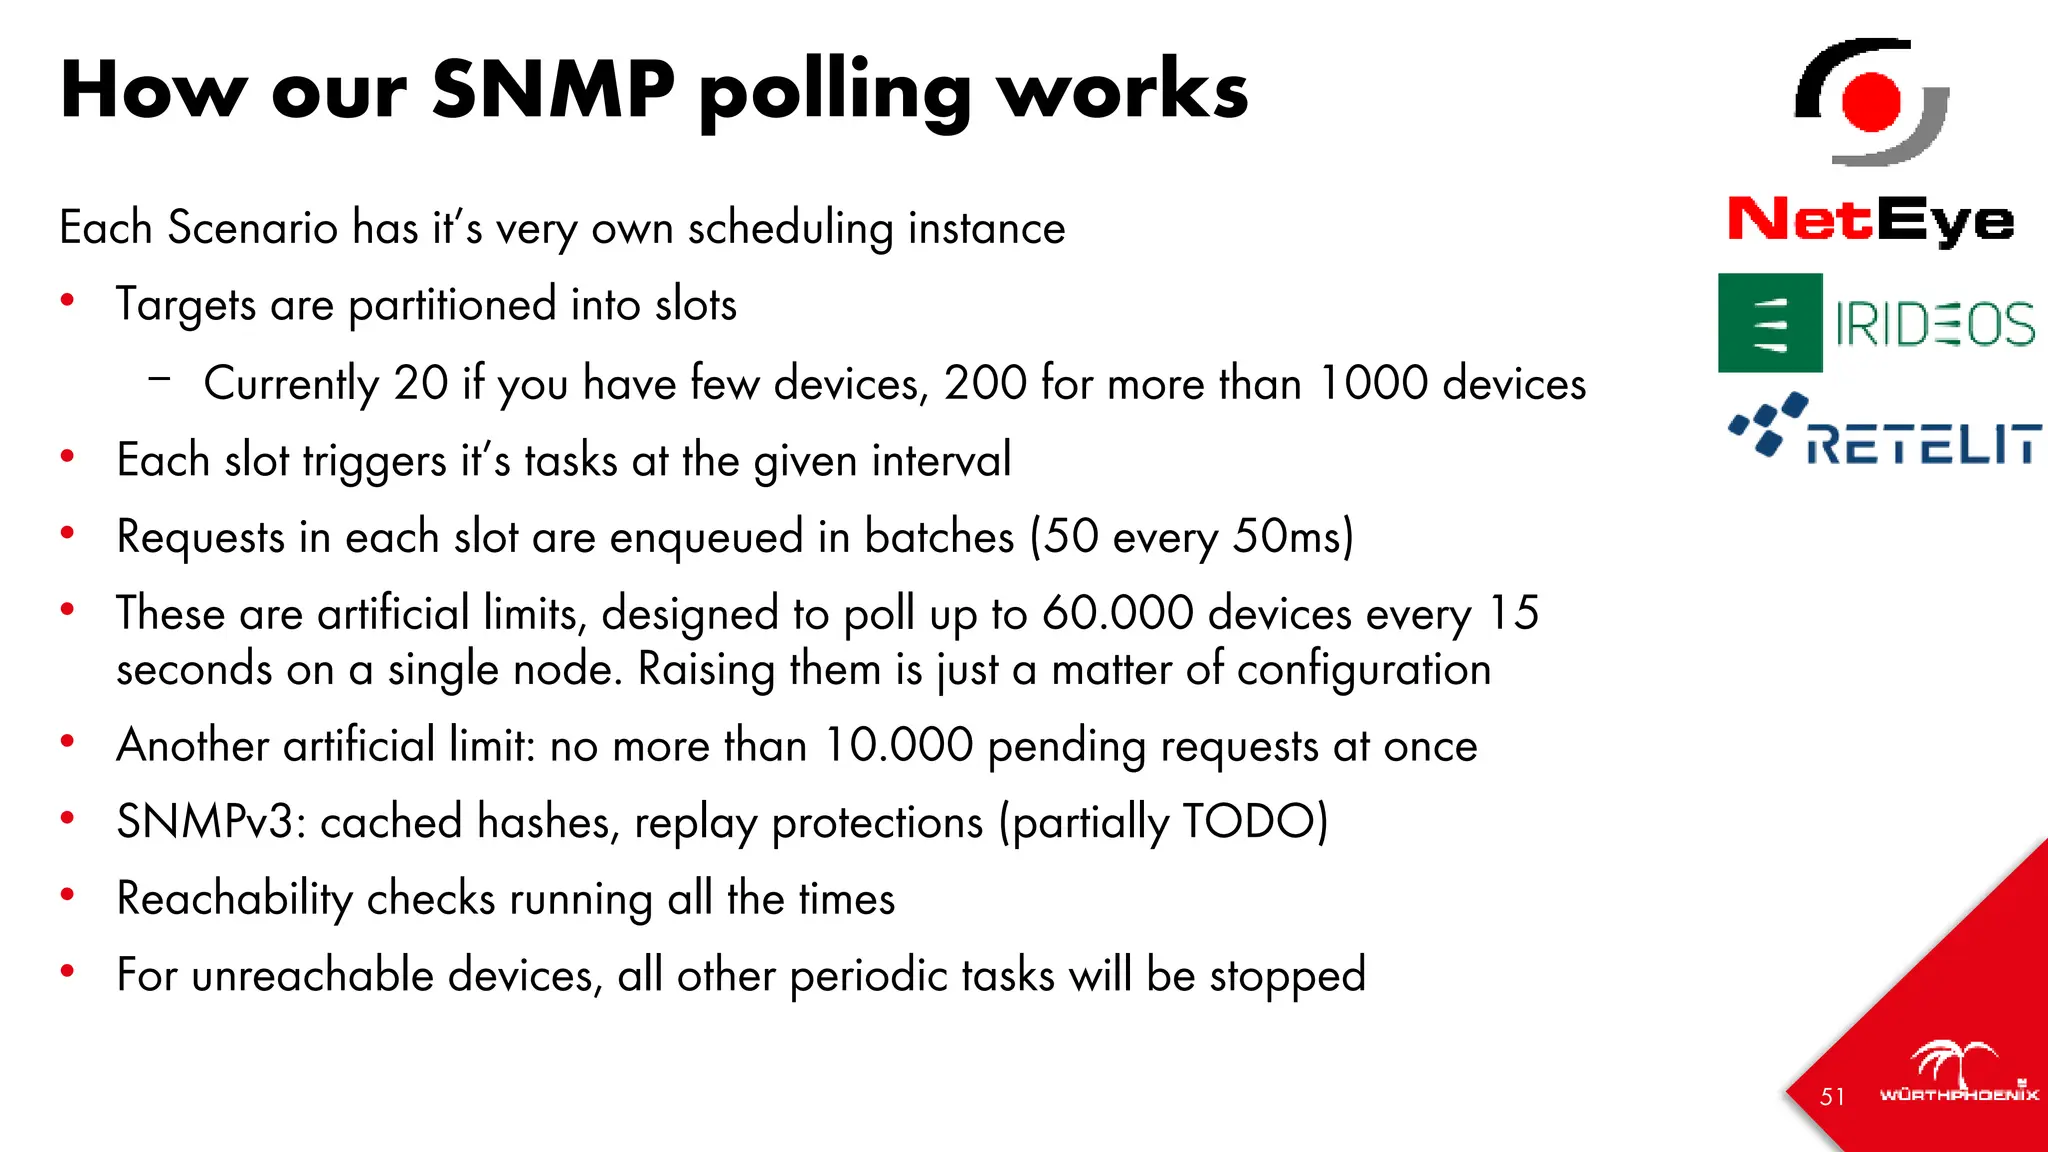
Sampling every 5 minutes: 100Mb is OK, 1Gb seems equal to 10Gb](https://image.slidesharecdn.com/icingacampmilan2023compressed-231026084410-a1eb15b9/75/SNMP-Monitoring-at-scale-Icinga-Camp-Milan-2023-36-2048.jpg)
![Data transfer at maxium speed [3/6]
0 3 6 9 12 15 18 21 24 27
0,0
200,0
400,0
600,0
800,0
1000,0
1200,0
Time (min)
Transfer
speed
(MB/s)
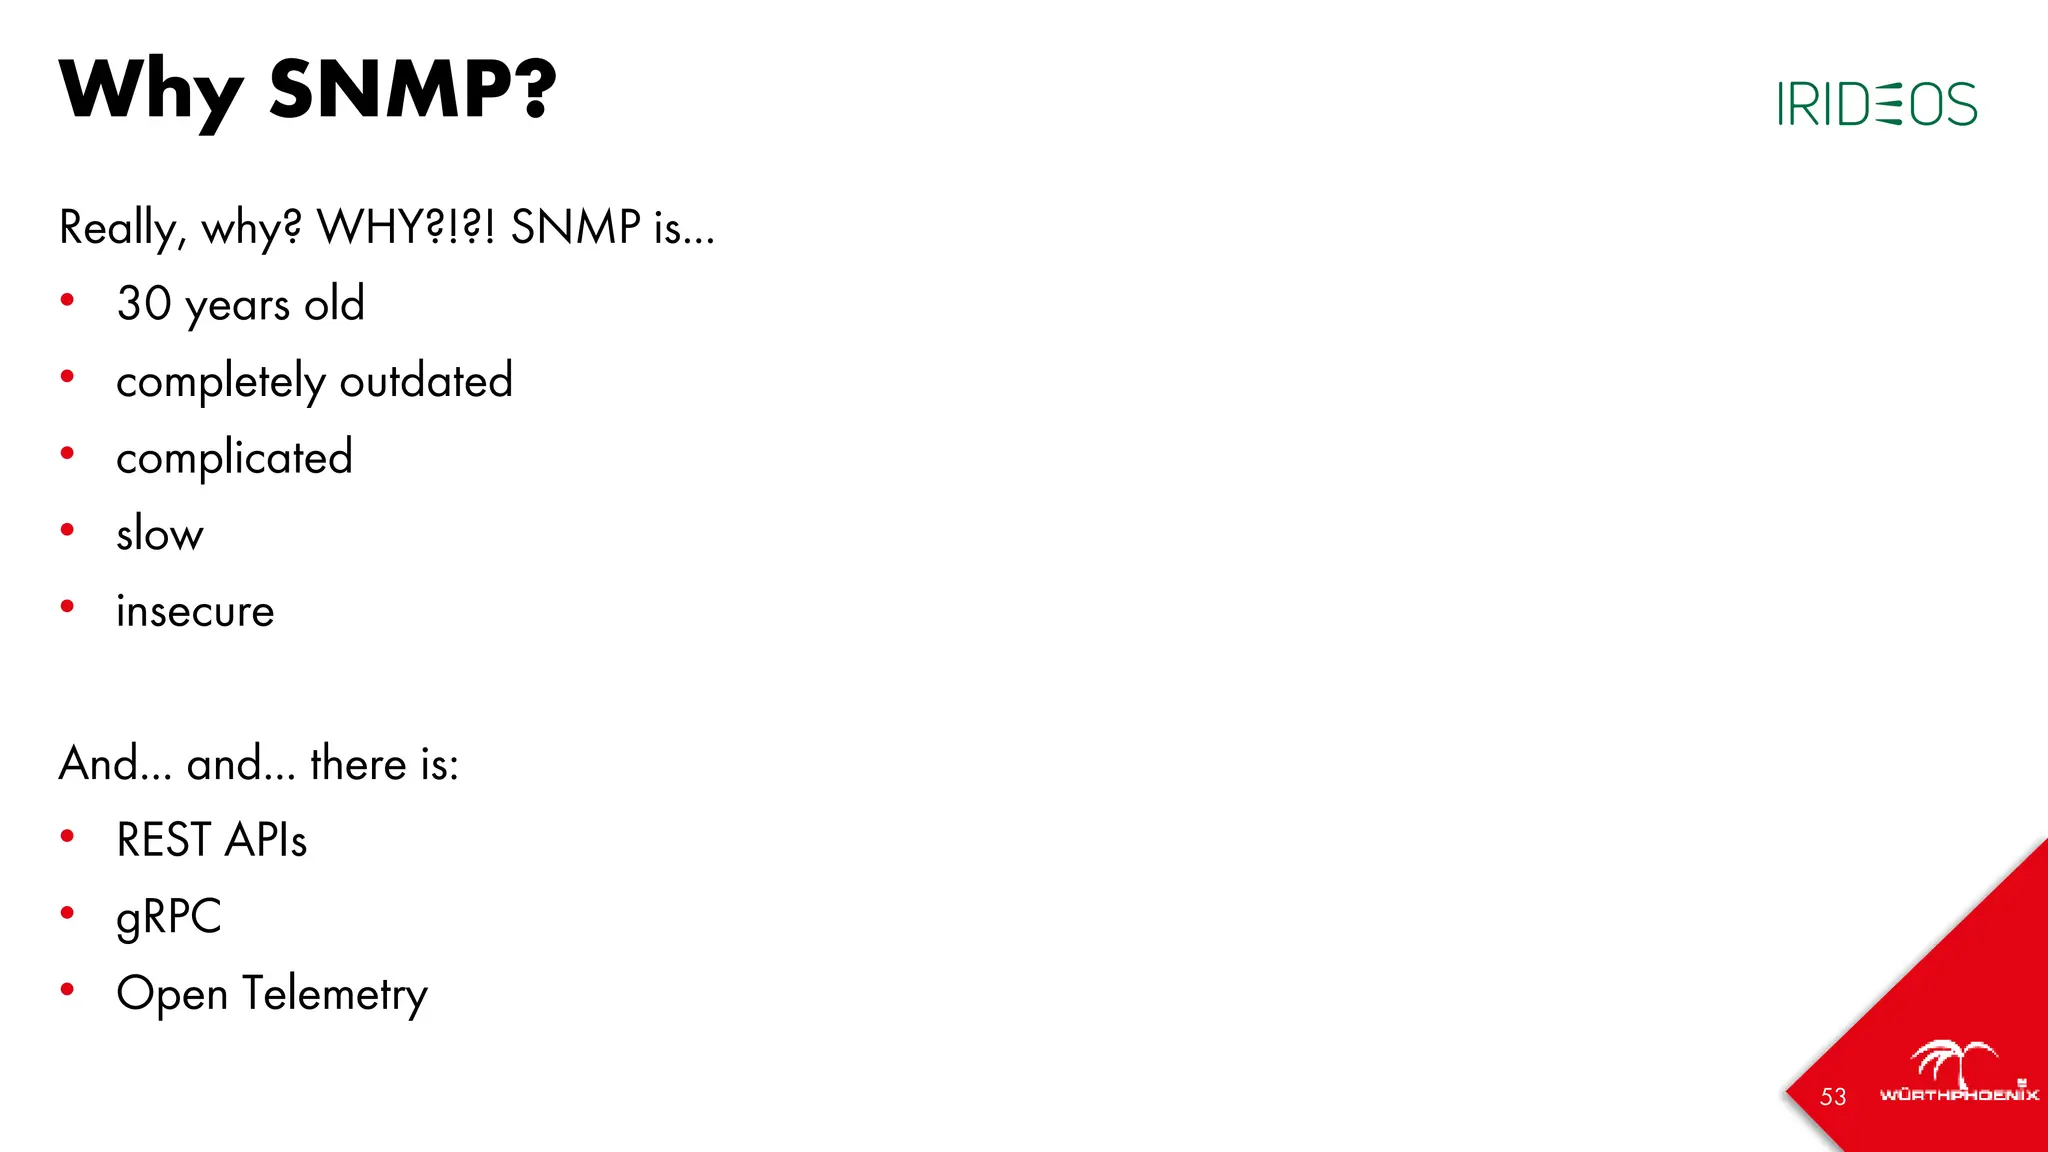
Sampling every 3 minutes: 1 GB is a bit different from 10 Gb, but not so much](https://image.slidesharecdn.com/icingacampmilan2023compressed-231026084410-a1eb15b9/75/SNMP-Monitoring-at-scale-Icinga-Camp-Milan-2023-37-2048.jpg)
![Data transfer at maxium speed [4/6]
0 1 2 3 4 5 6 7 8 9
0,0
500,0
1000,0
1500,0
2000,0
2500,0
3000,0
3500,0
Time (min)
Transfer
speed
(MB/s)
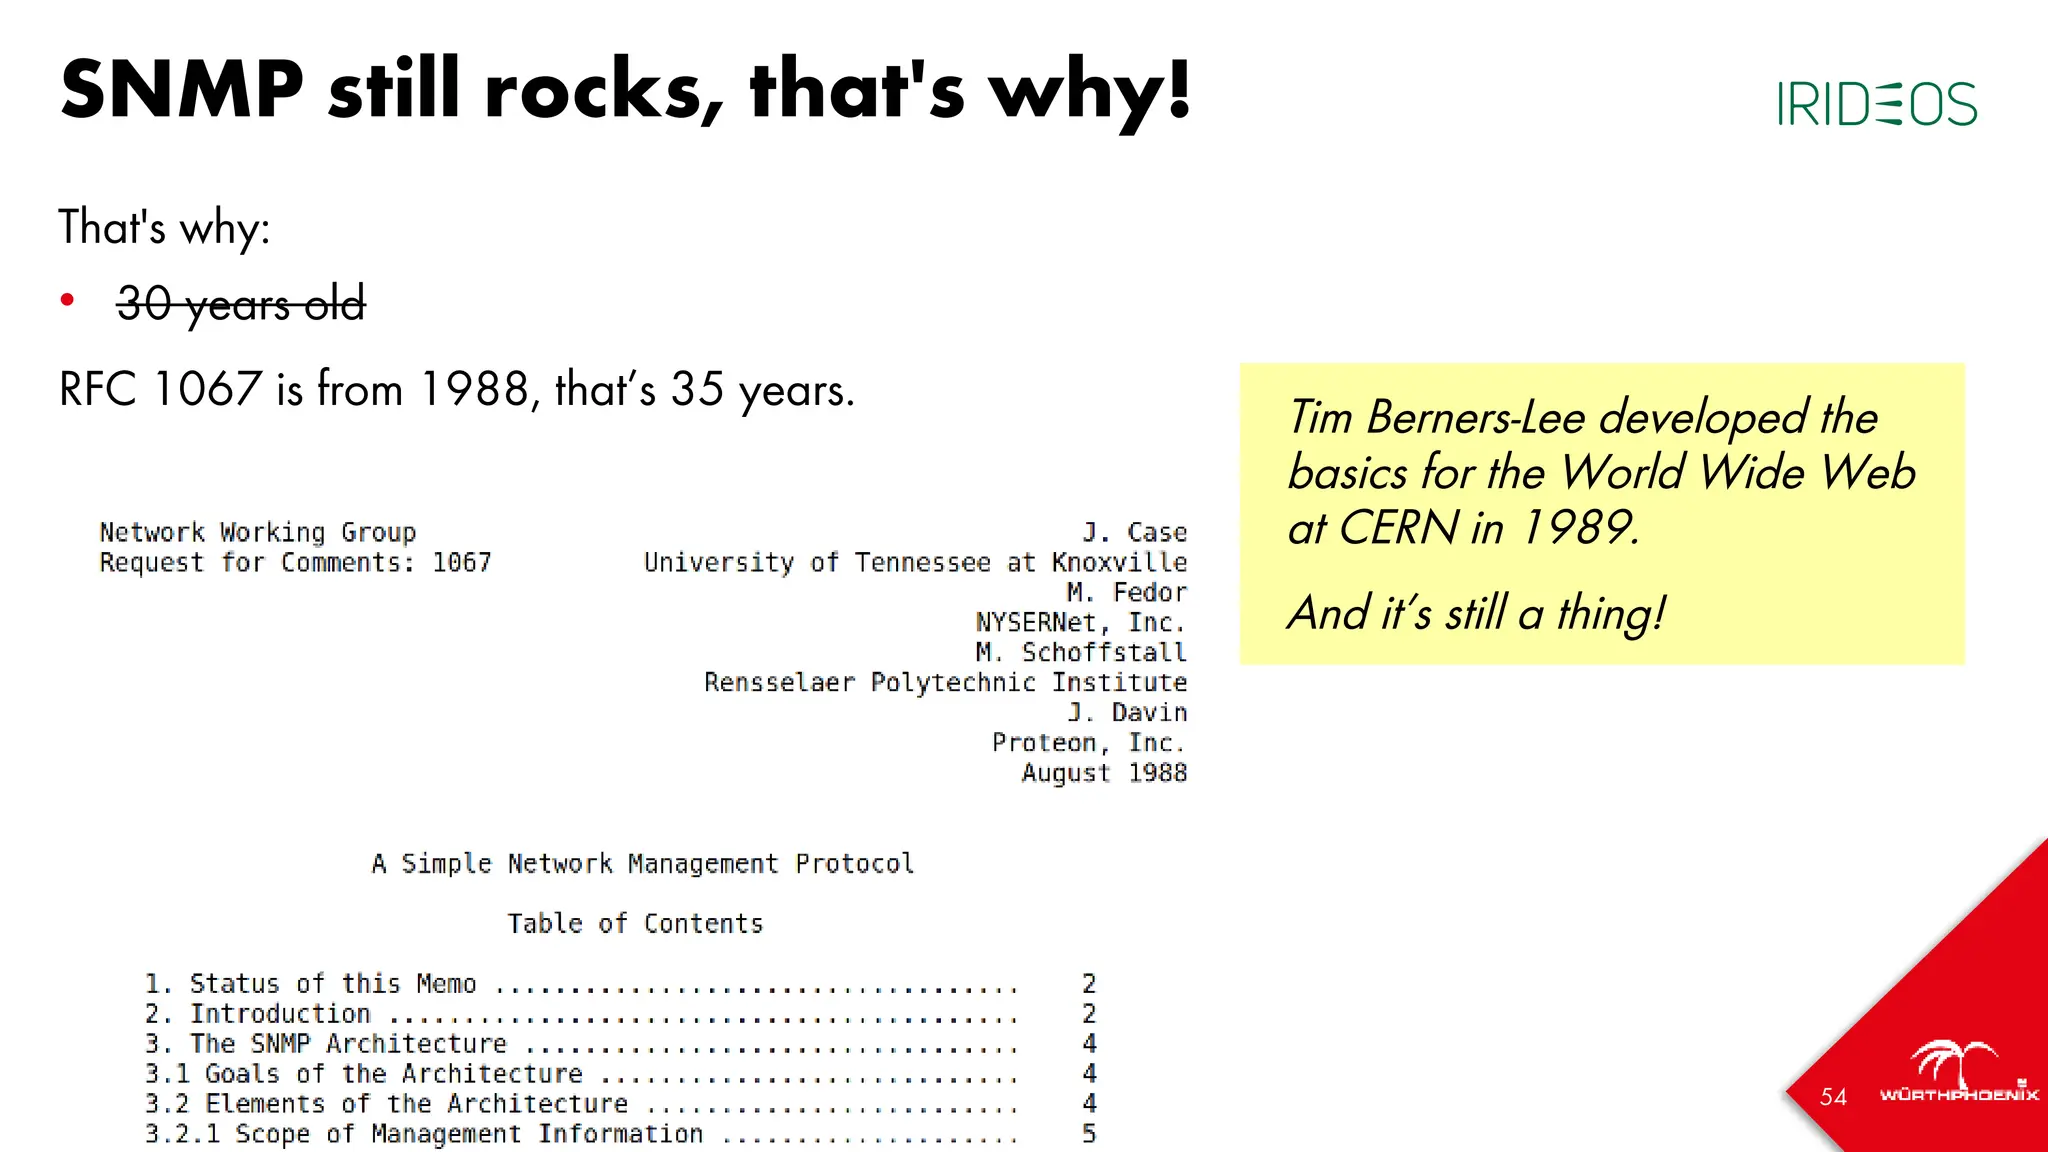
Sampling every 1 minute: now 10Gb is different from 1Gb, but is not enough](https://image.slidesharecdn.com/icingacampmilan2023compressed-231026084410-a1eb15b9/75/SNMP-Monitoring-at-scale-Icinga-Camp-Milan-2023-38-2048.jpg)
![Data transfer at maxium speed [5/6]
0 0,5 1 1,5 2 2,5 3 3,5 4 4,5
0,0
1000,0
2000,0
3000,0
4000,0
5000,0
6000,0
7000,0
Time (min)
Transfer
speed
(MB/s)
Sampling every 30 seconds: still equal to before](https://image.slidesharecdn.com/icingacampmilan2023compressed-231026084410-a1eb15b9/75/SNMP-Monitoring-at-scale-Icinga-Camp-Milan-2023-39-2048.jpg)
![Data transfer at maxium speed [6/6]
0 0,25 0,5 0,75 1 1,25 1,5 1,75 2 2,25
0,0
1000,0
2000,0
3000,0
4000,0
5000,0
6000,0
7000,0
8000,0
9000,0
10000,0
Time (min)
Transfer
speed
(MB/s)
Sampling every 15 seconds: now we can see what the 10 Gb is doing in the time window](https://image.slidesharecdn.com/icingacampmilan2023compressed-231026084410-a1eb15b9/75/SNMP-Monitoring-at-scale-Icinga-Camp-Milan-2023-40-2048.jpg)
![42
Sampling real data [1/5]
• Sampled with Telegraf every 30 seconds, stored in InfluxDB 1.8
• Speed calculated directly by Telegraf (derivative operator)
• Downsampling done with Grafana; rates:
• 1x (30 seconds)
• 2x (60 seconds)
• 6x (3 minutes)
• 10x (5 minutes)](https://image.slidesharecdn.com/icingacampmilan2023compressed-231026084410-a1eb15b9/75/SNMP-Monitoring-at-scale-Icinga-Camp-Milan-2023-42-2048.jpg)
![Sampling real data [2/5]
Sampling: 300 seconds Peak speed: 24 Mb/s](https://image.slidesharecdn.com/icingacampmilan2023compressed-231026084410-a1eb15b9/75/SNMP-Monitoring-at-scale-Icinga-Camp-Milan-2023-43-2048.jpg)
![Sampling real data [3/5]
Sampling: 180 seconds Peak speed: 40 Mb/s](https://image.slidesharecdn.com/icingacampmilan2023compressed-231026084410-a1eb15b9/75/SNMP-Monitoring-at-scale-Icinga-Camp-Milan-2023-44-2048.jpg)
![Sampling real data [4/5]
Sampling: 60 seconds Peak speed: 80 Mb/s](https://image.slidesharecdn.com/icingacampmilan2023compressed-231026084410-a1eb15b9/75/SNMP-Monitoring-at-scale-Icinga-Camp-Milan-2023-45-2048.jpg)
![Sampling real data [5/5]
Sampling: 30 seconds Peak speed: 160 Mb/s](https://image.slidesharecdn.com/icingacampmilan2023compressed-231026084410-a1eb15b9/75/SNMP-Monitoring-at-scale-Icinga-Camp-Milan-2023-46-2048.jpg)


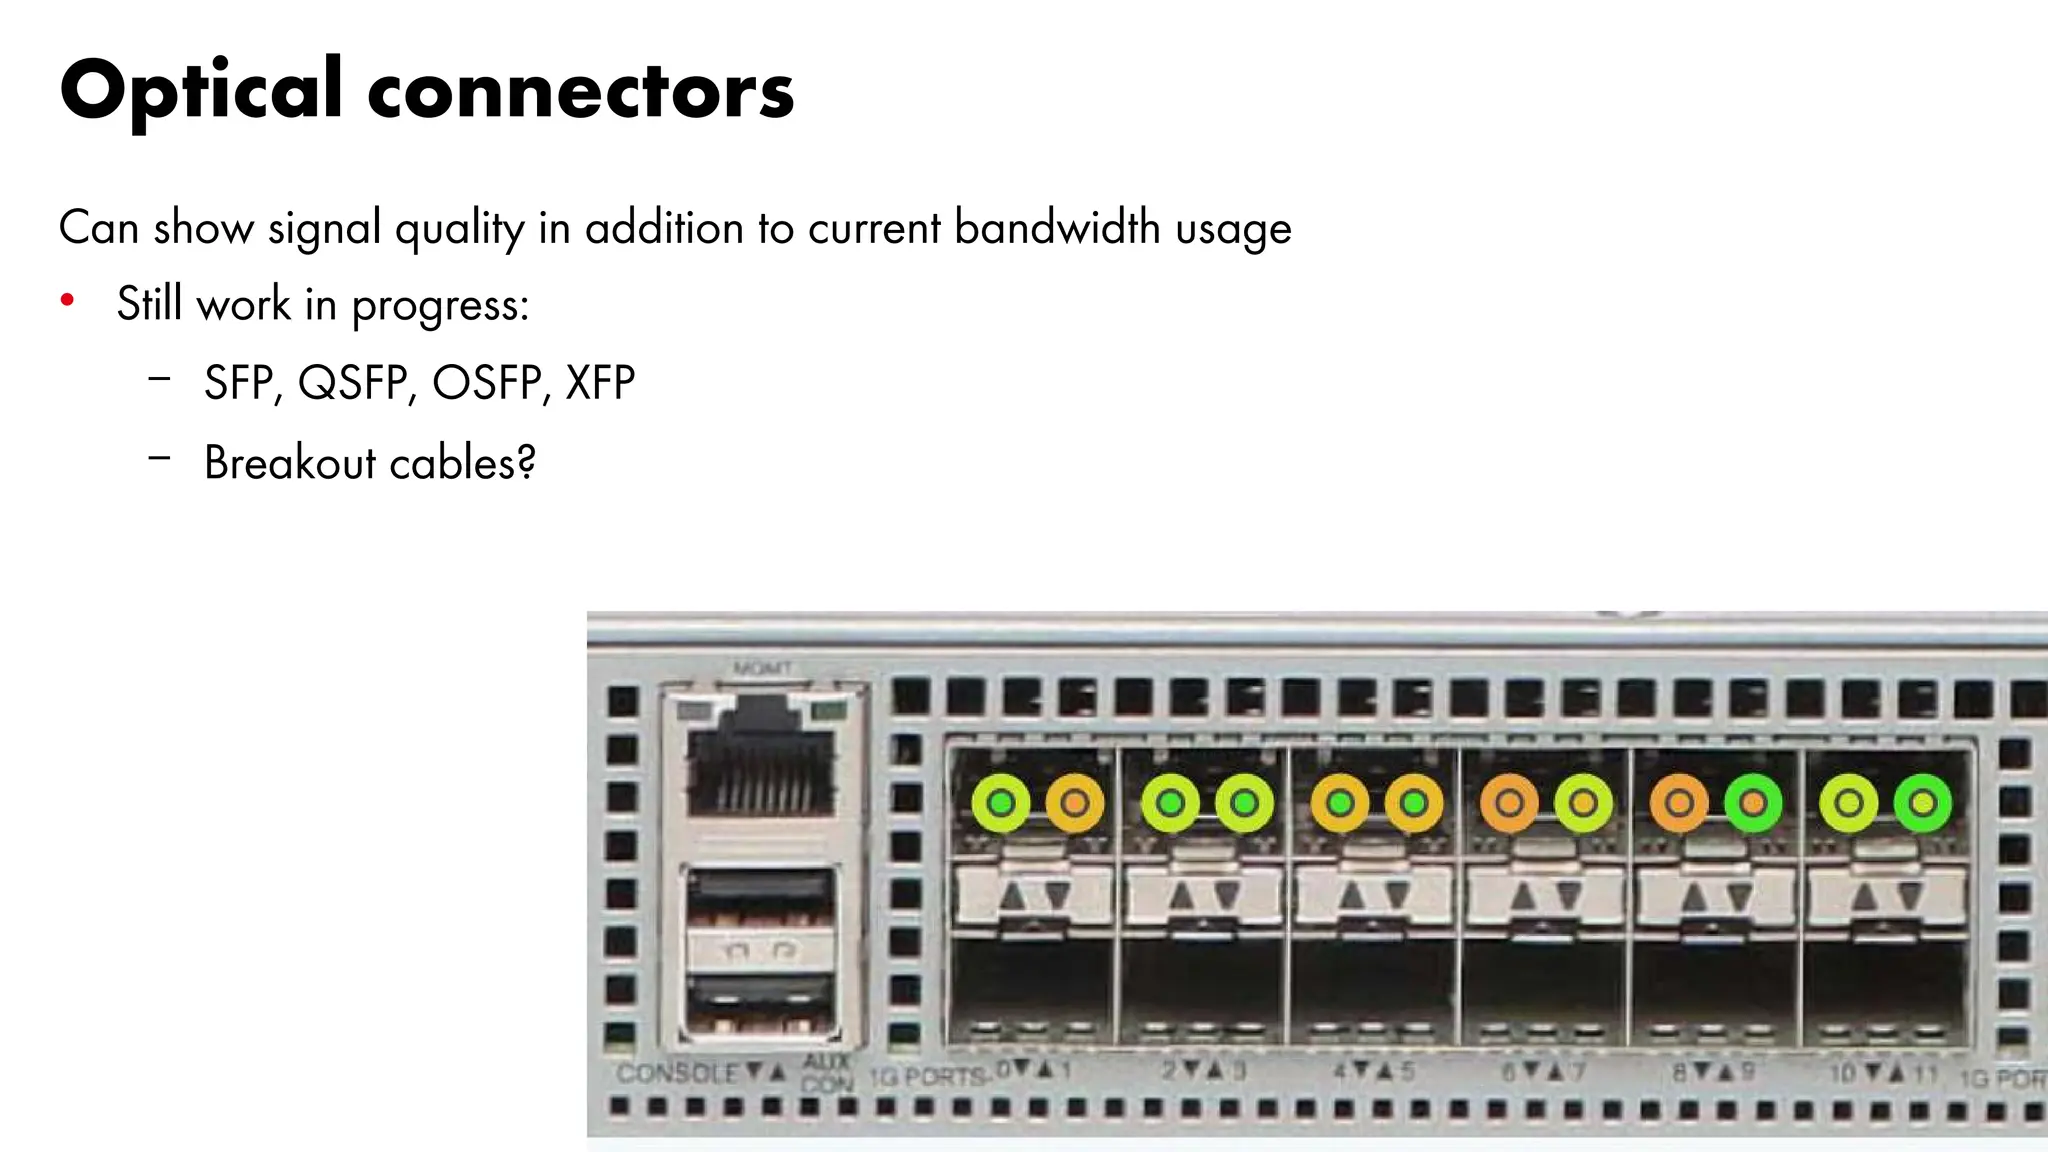
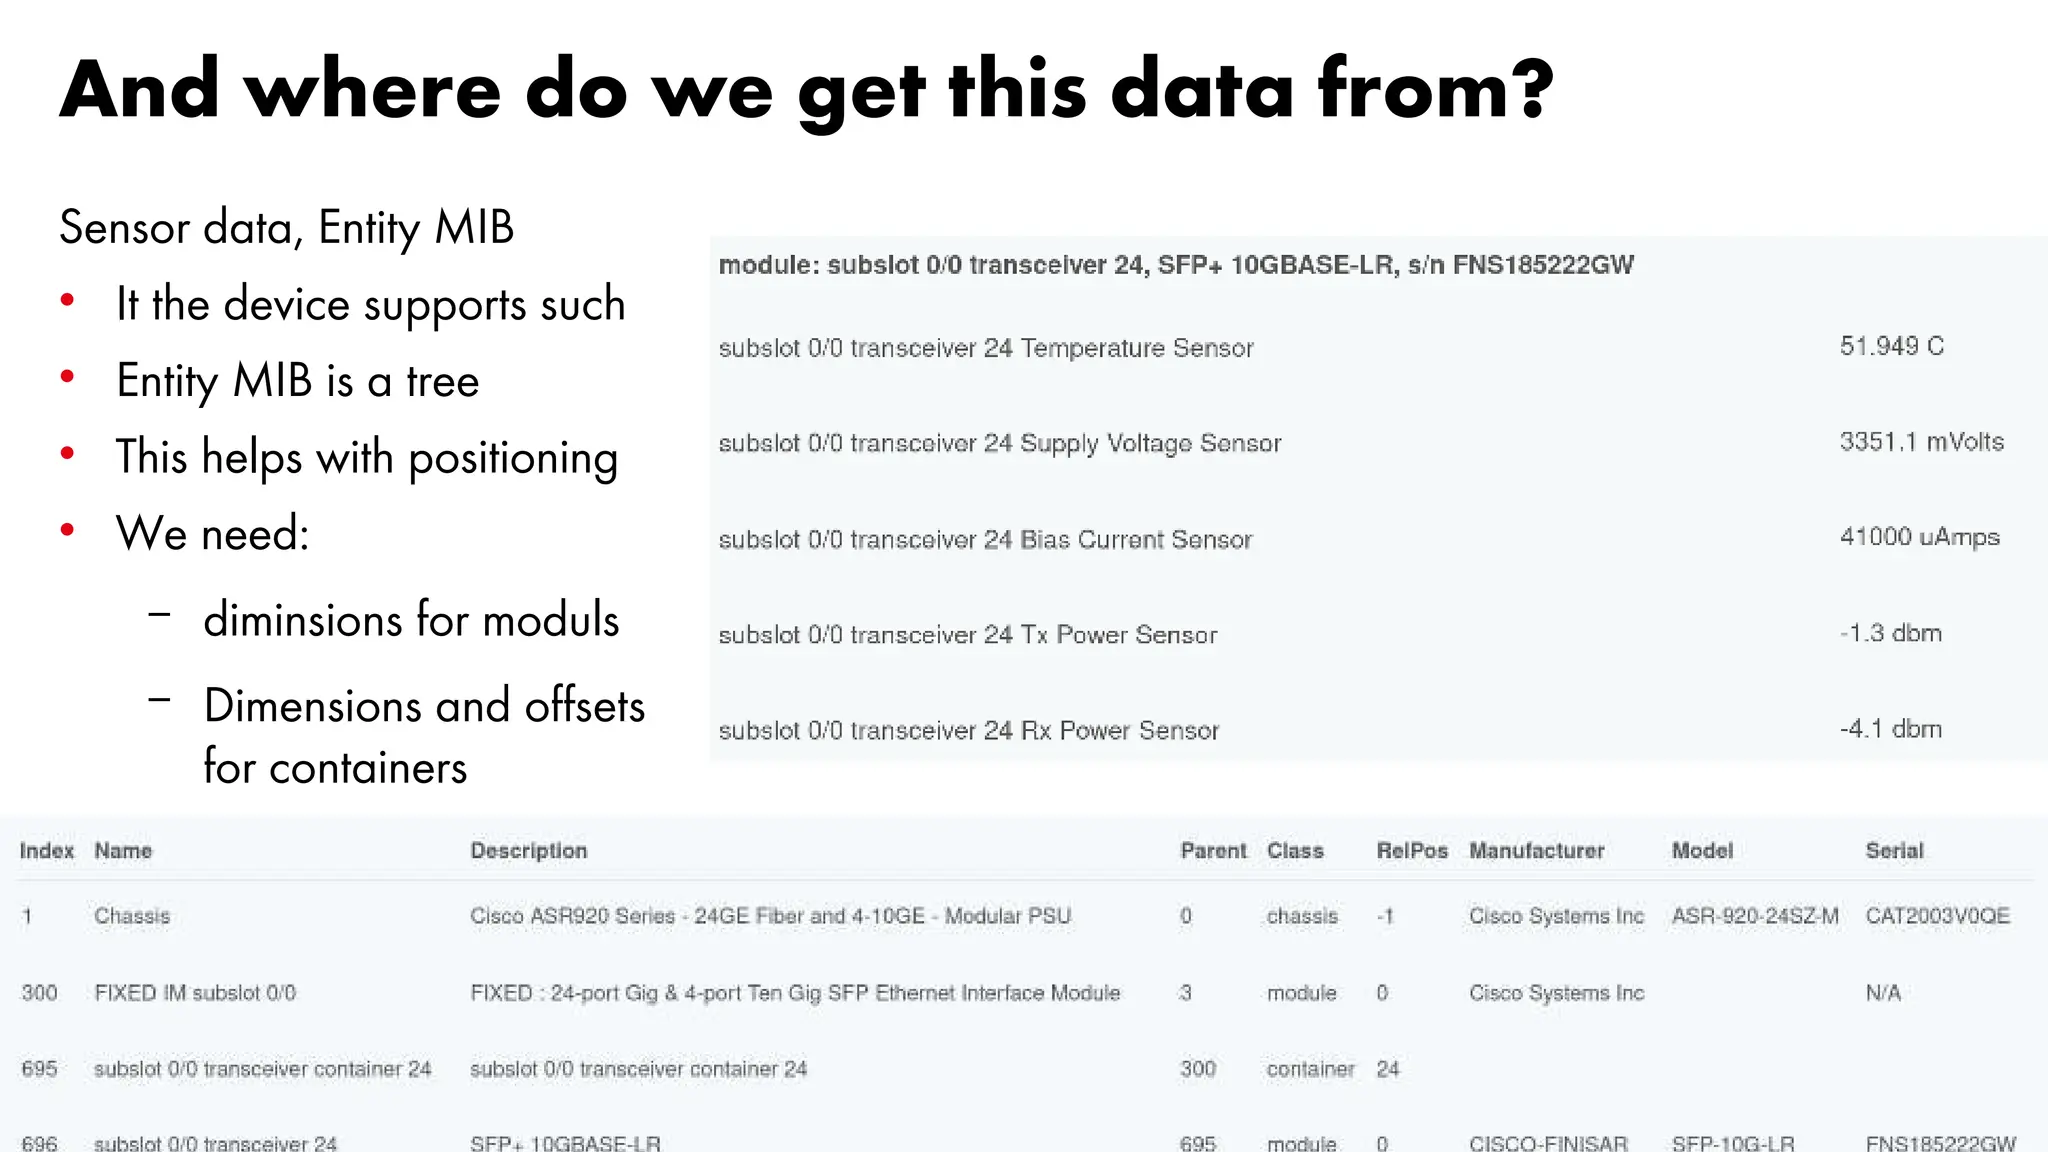
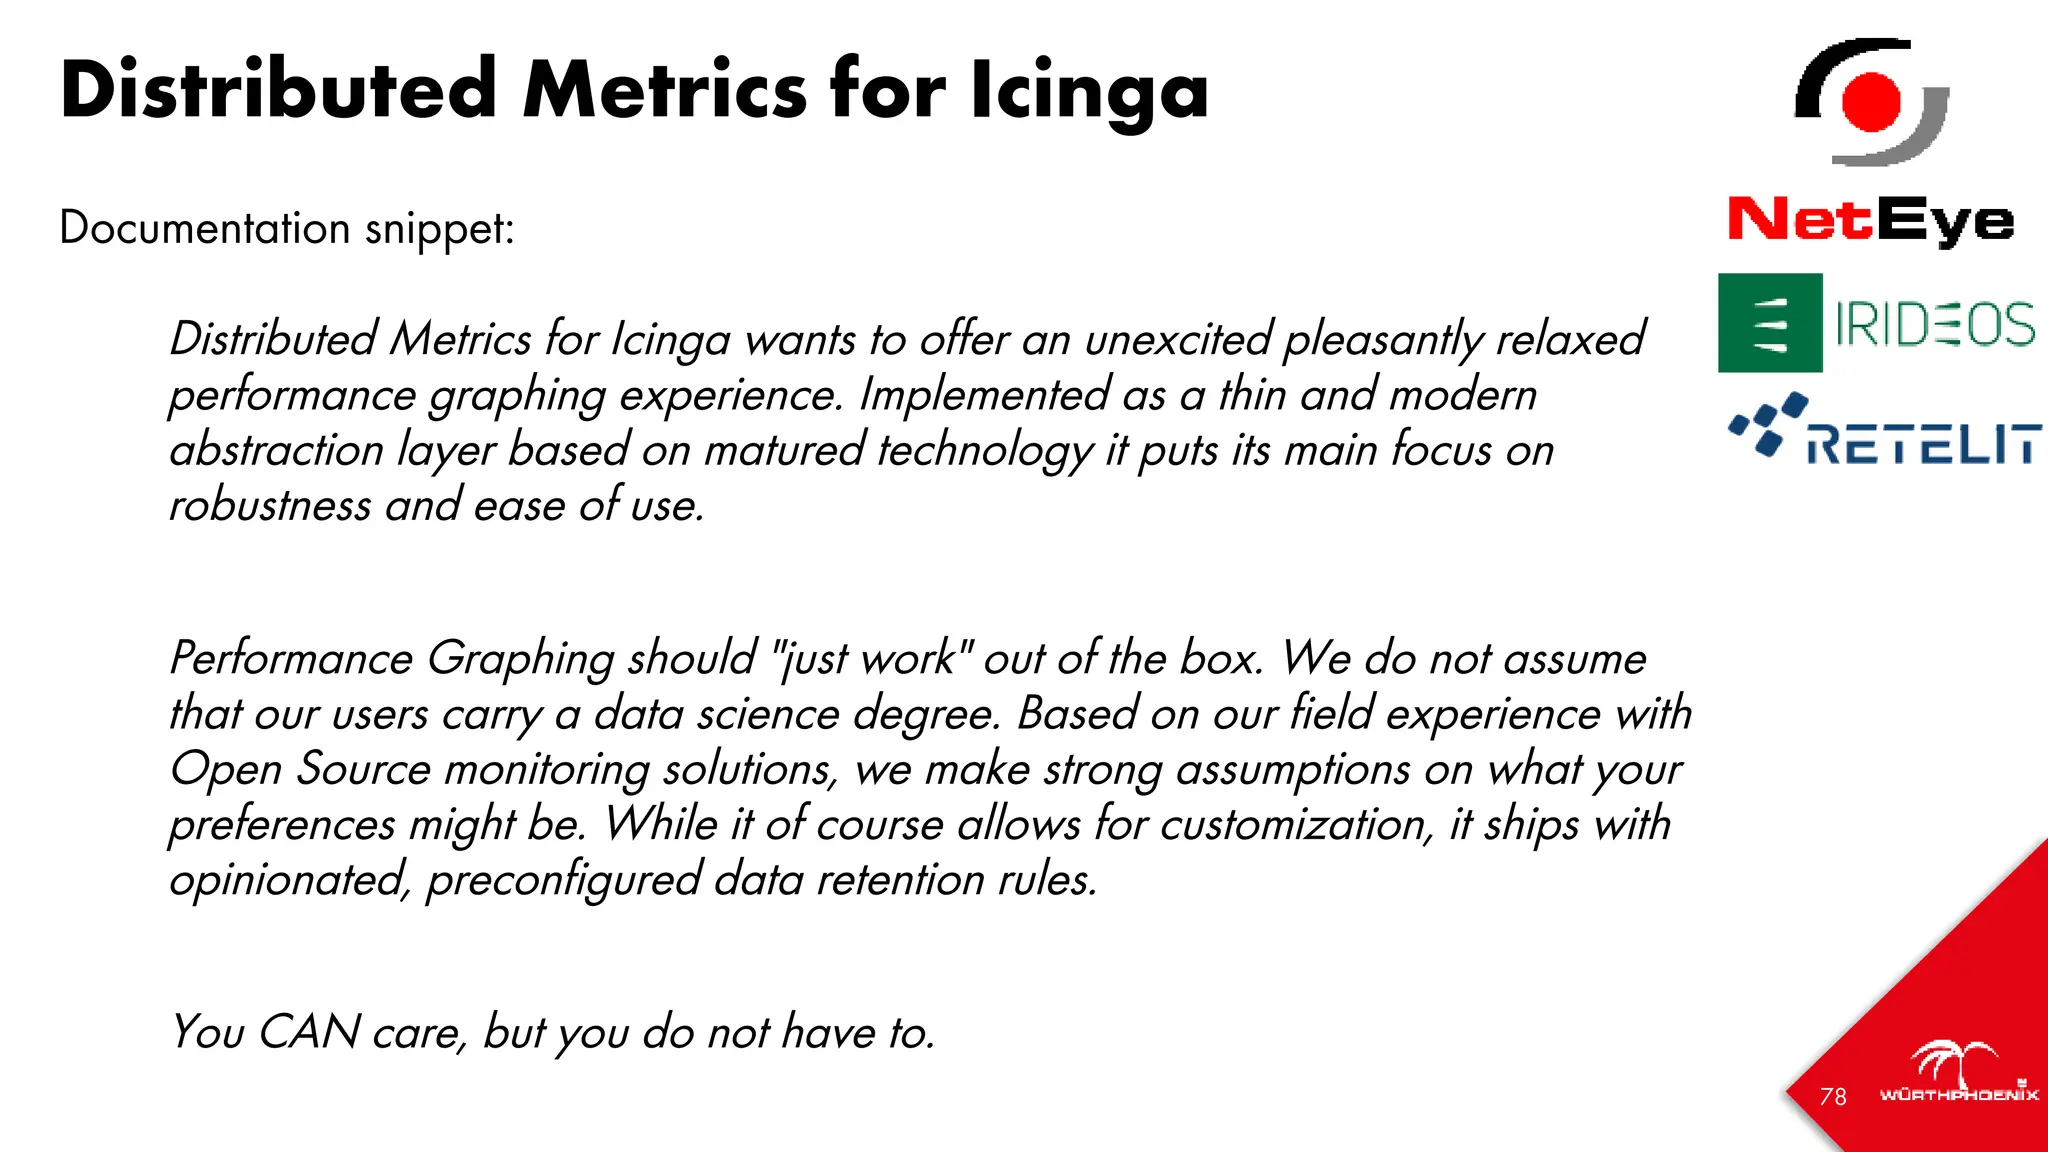
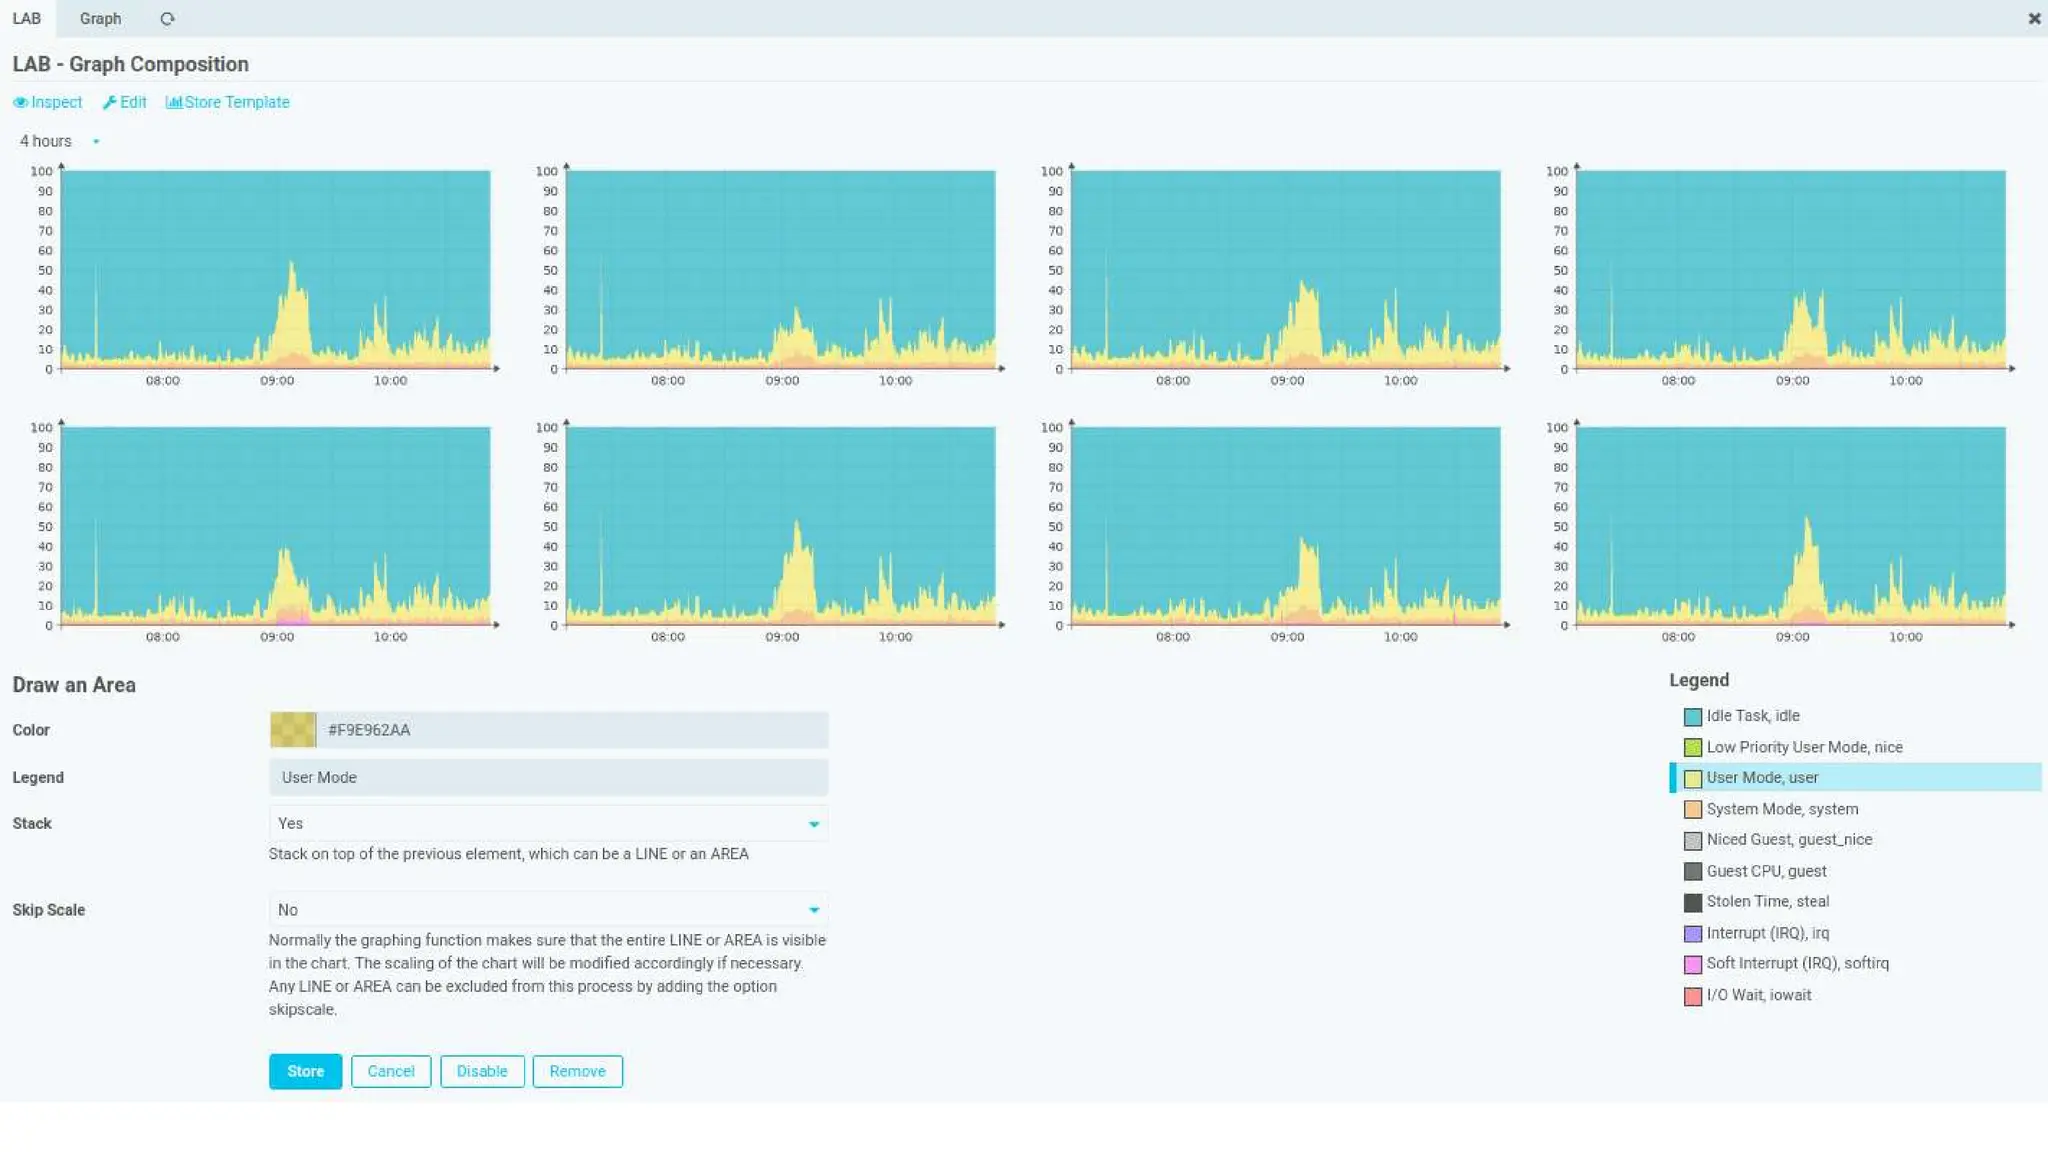


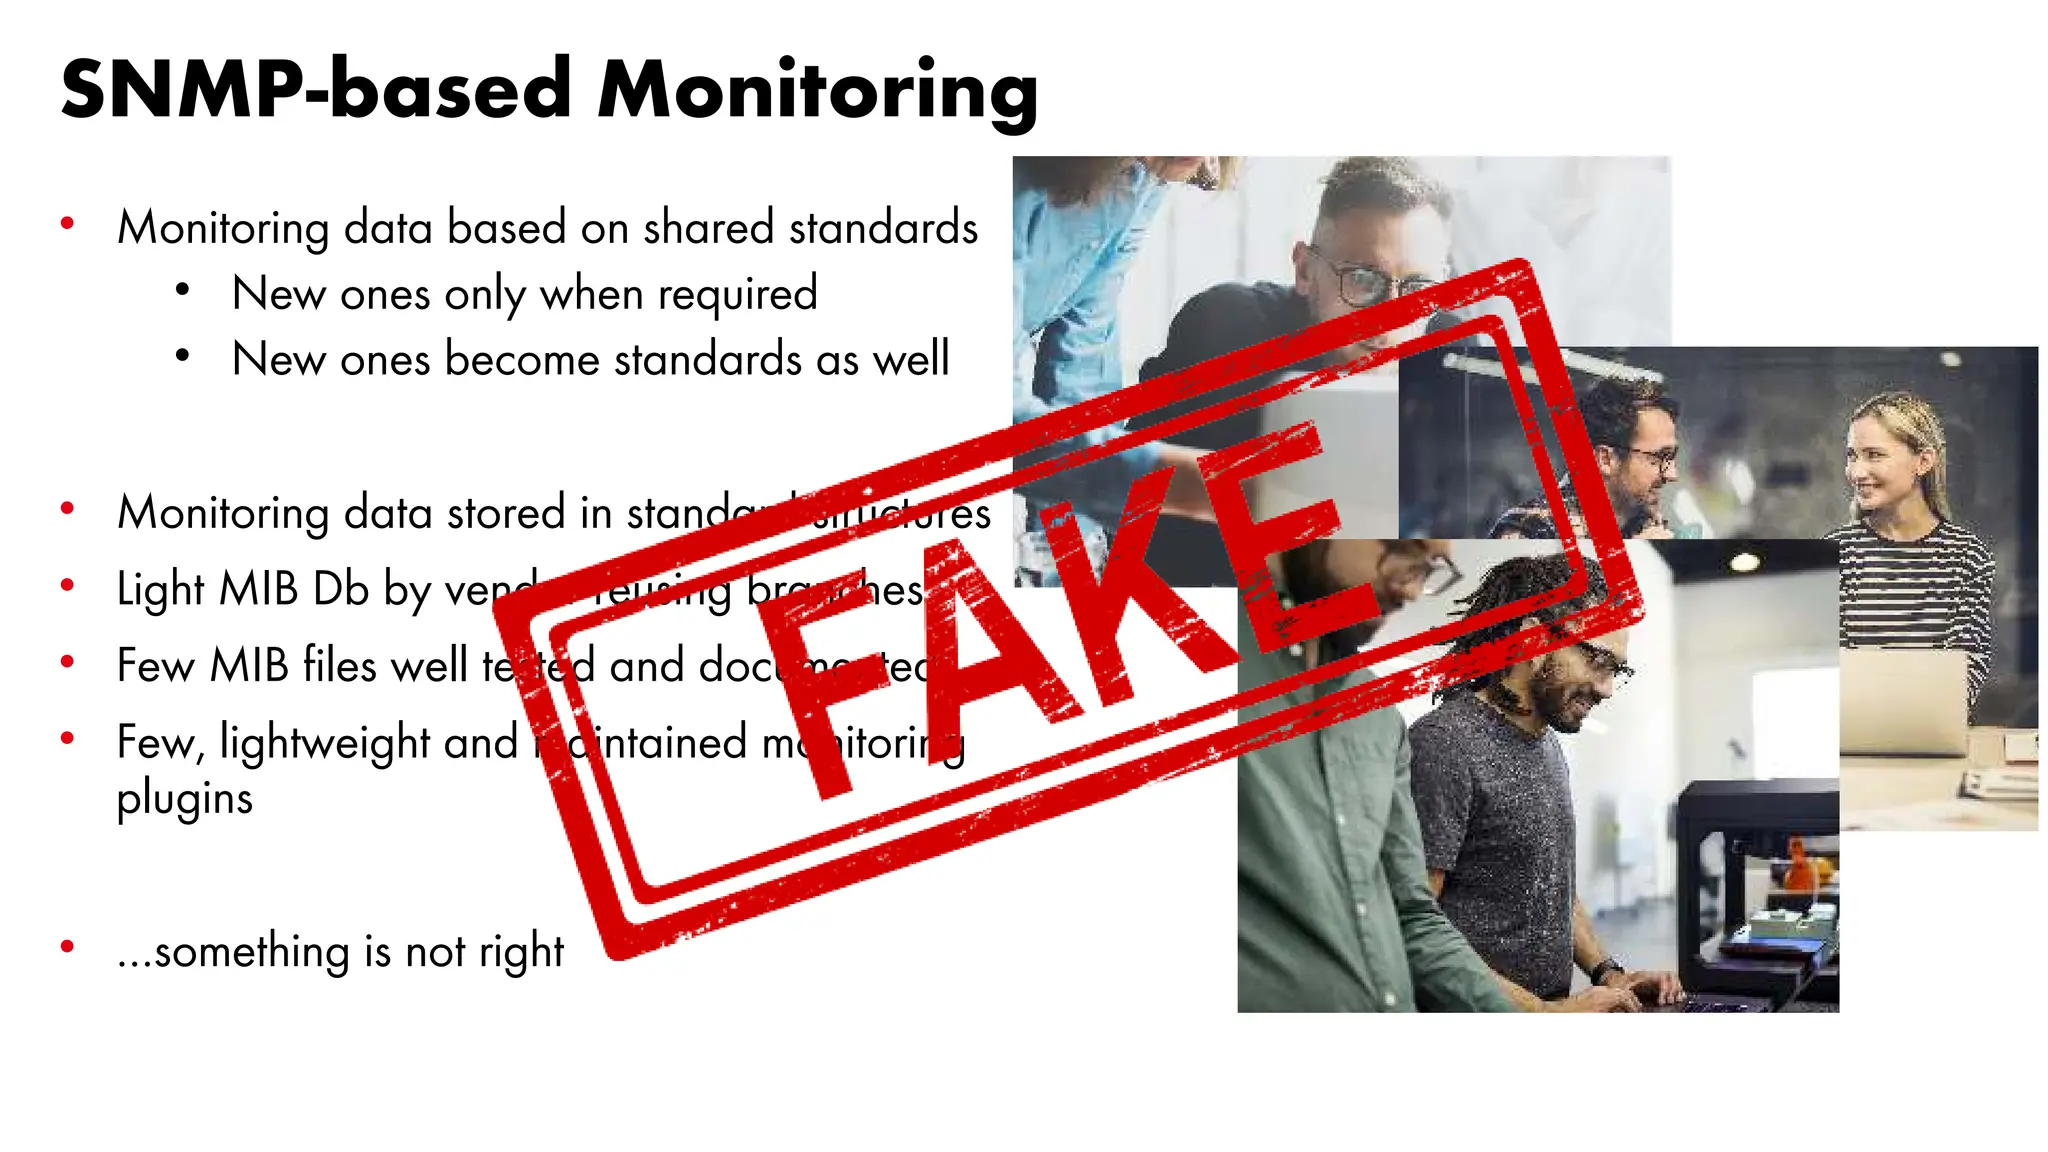
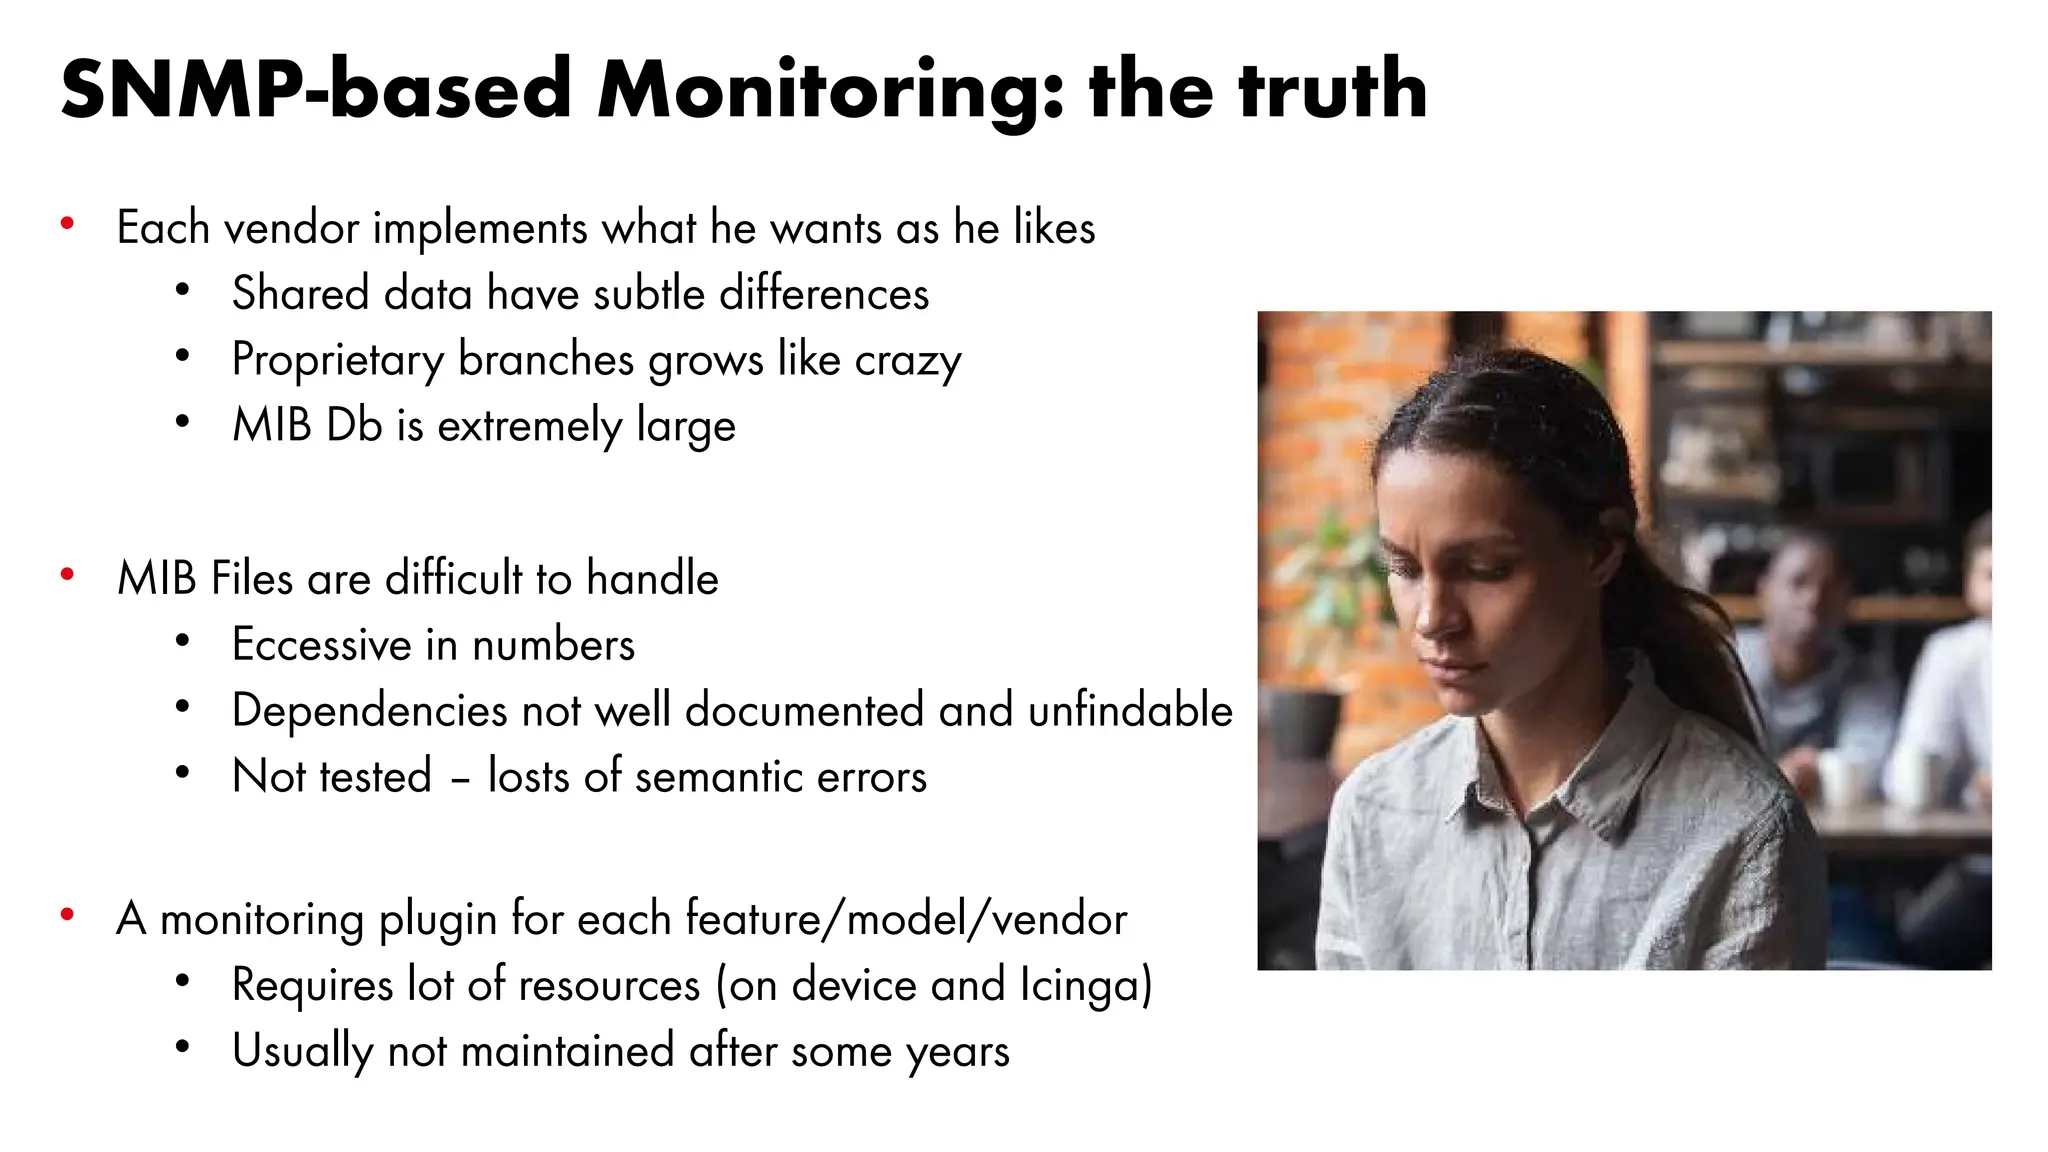
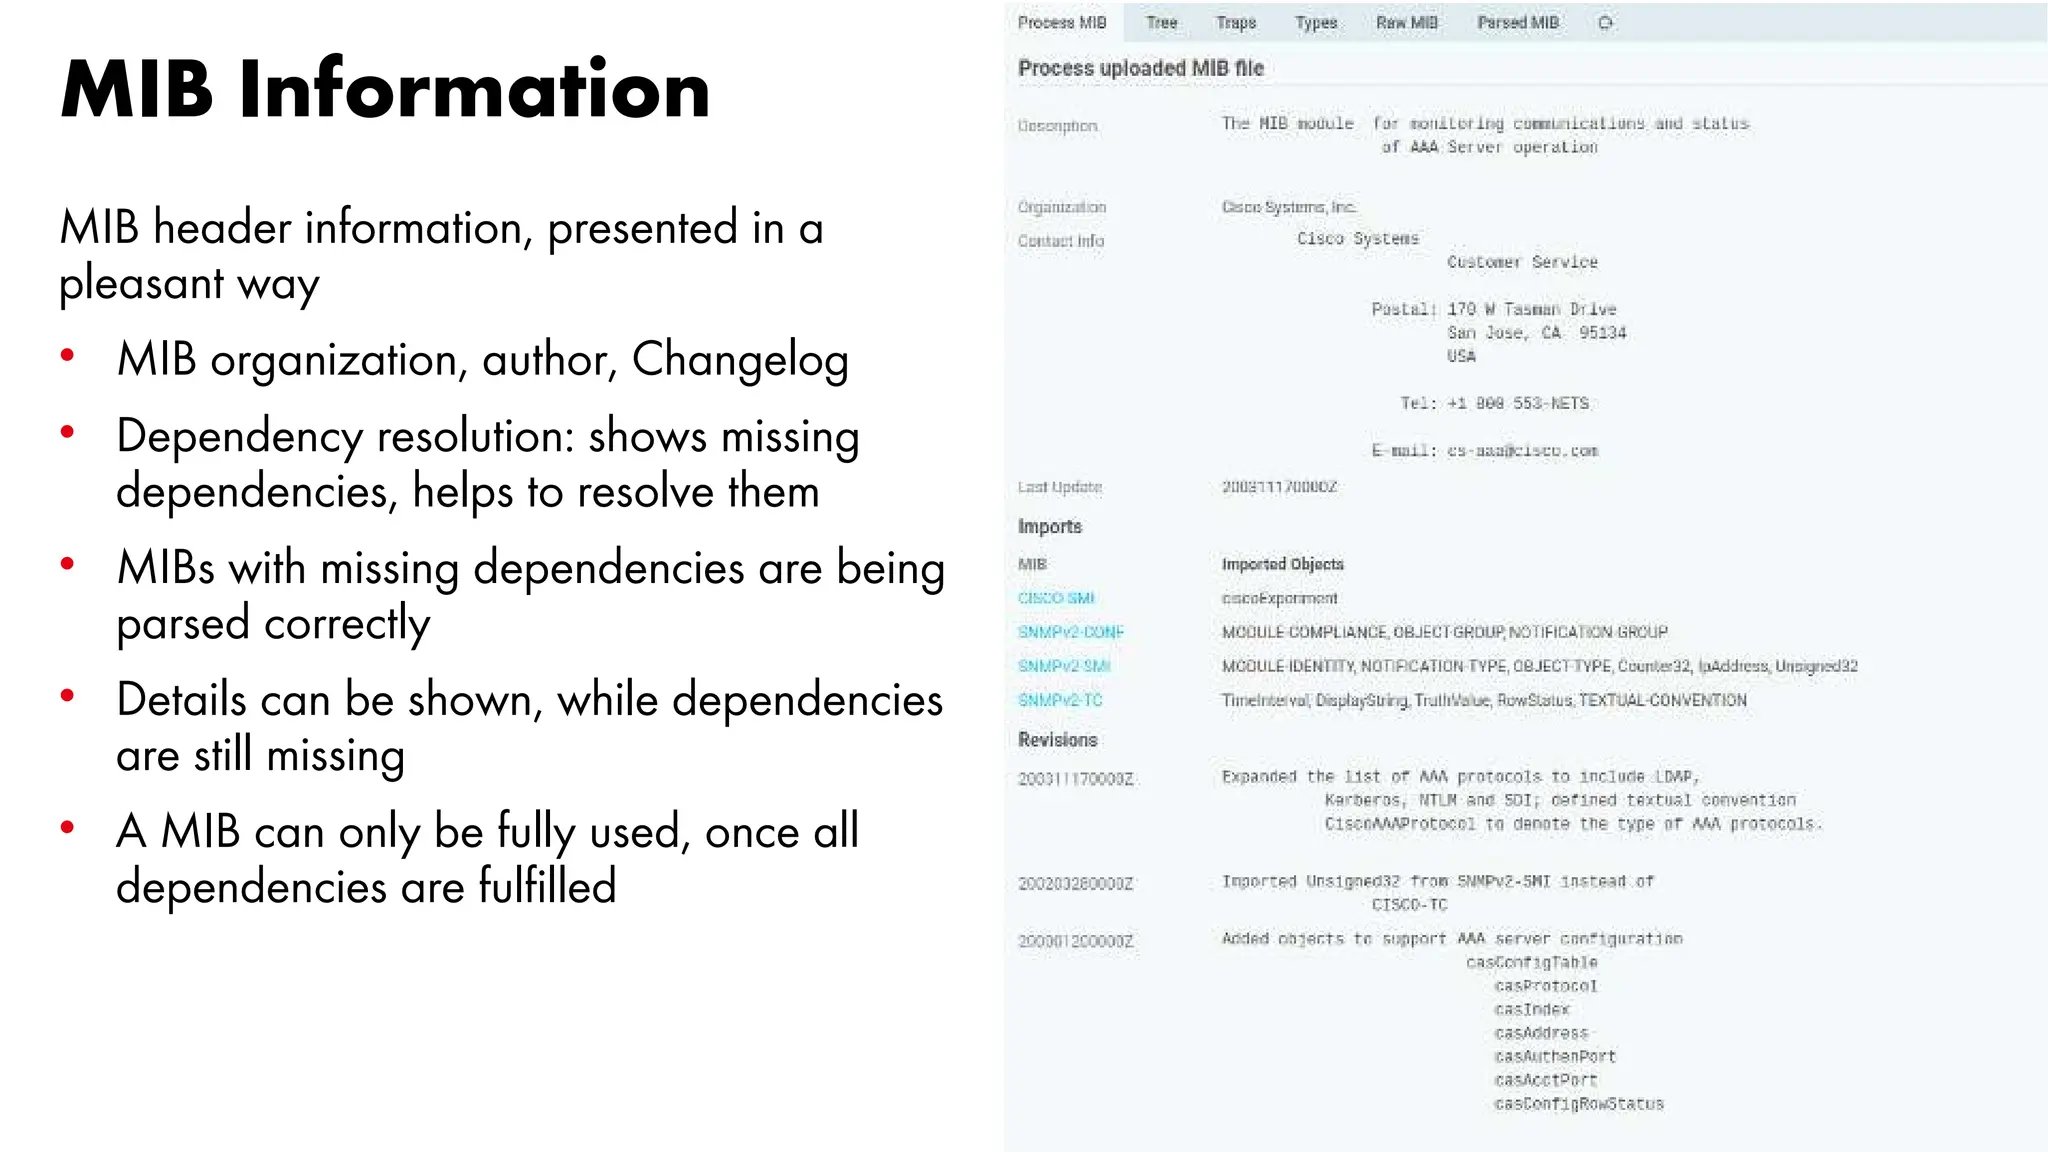
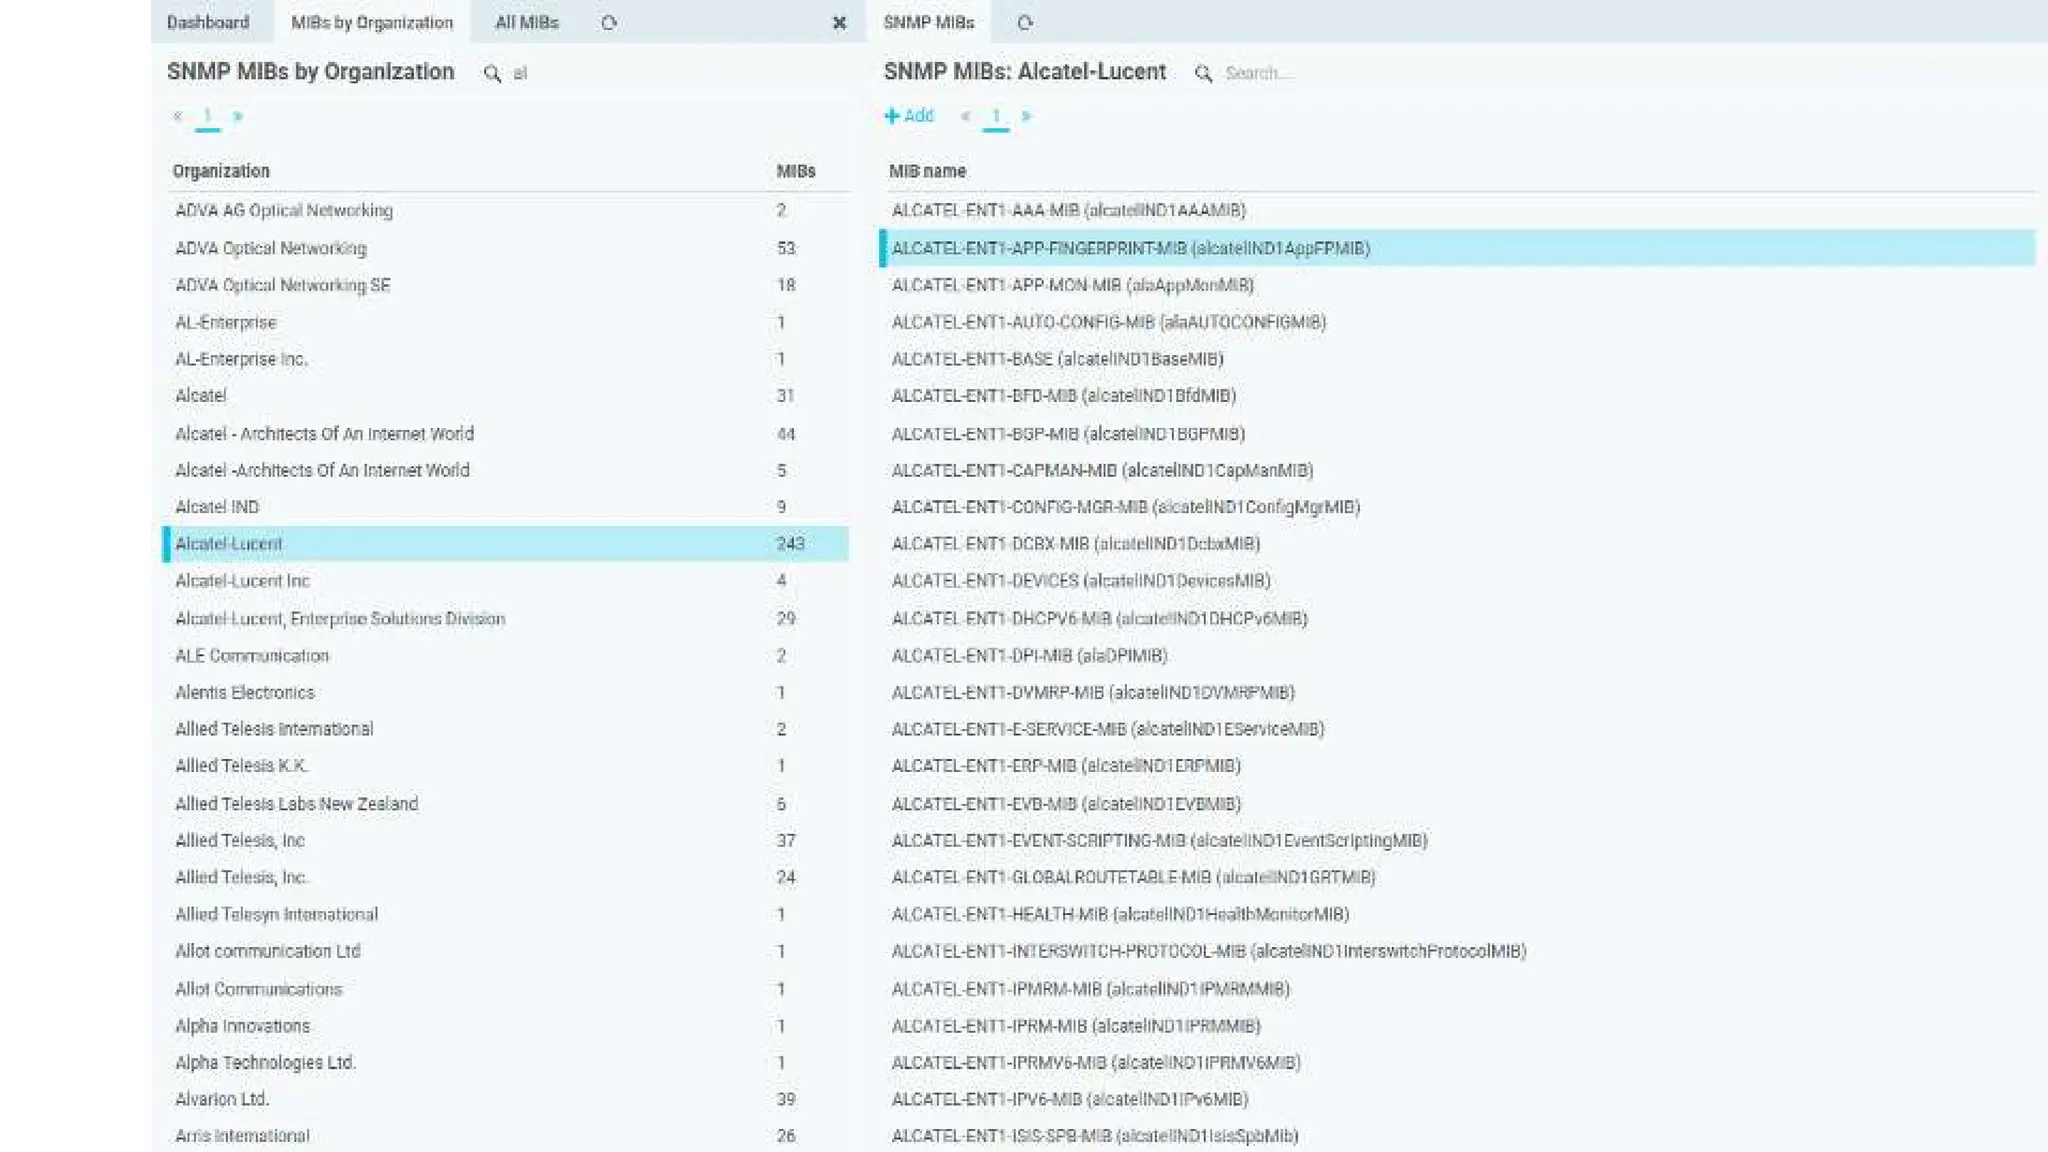
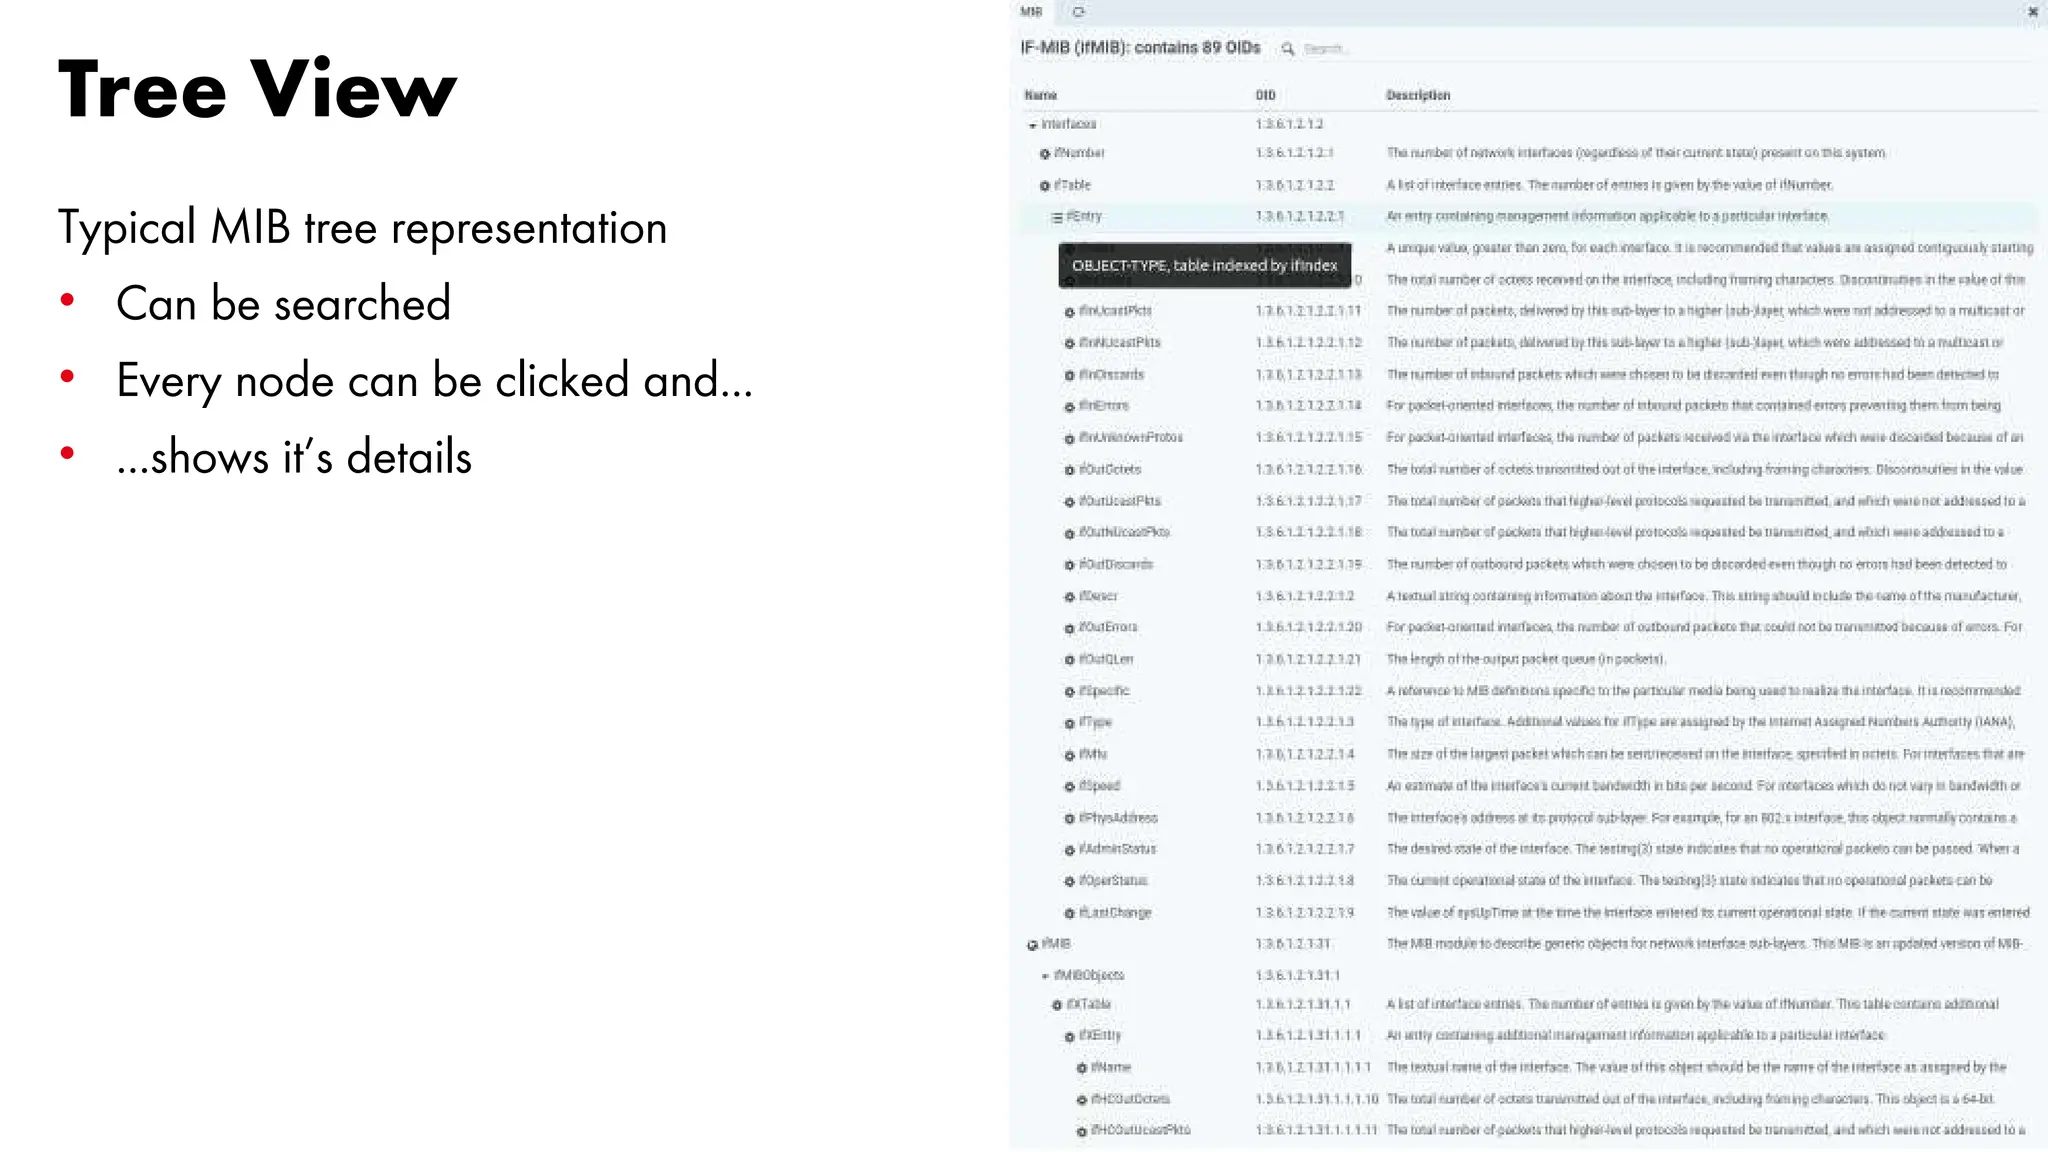
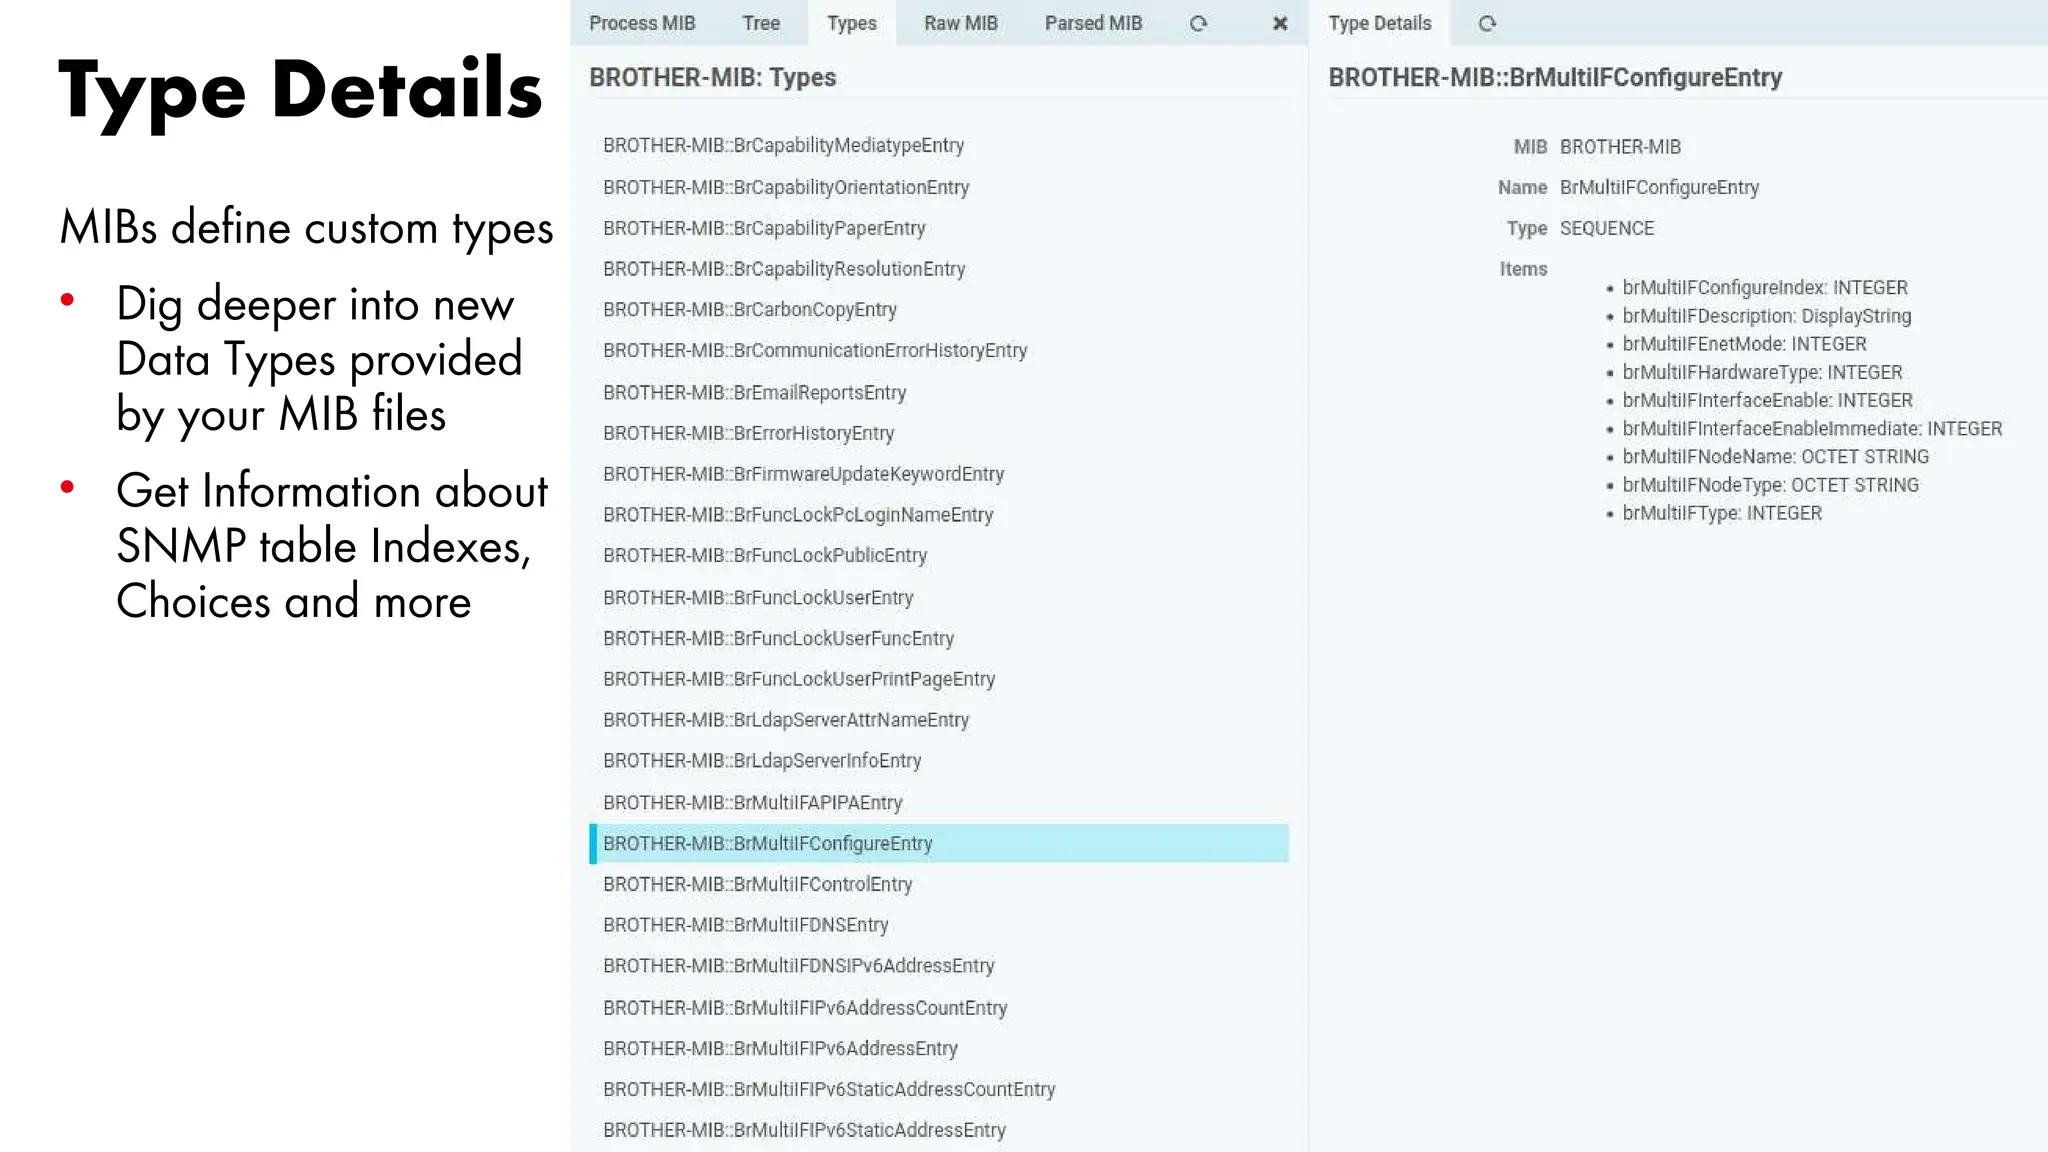
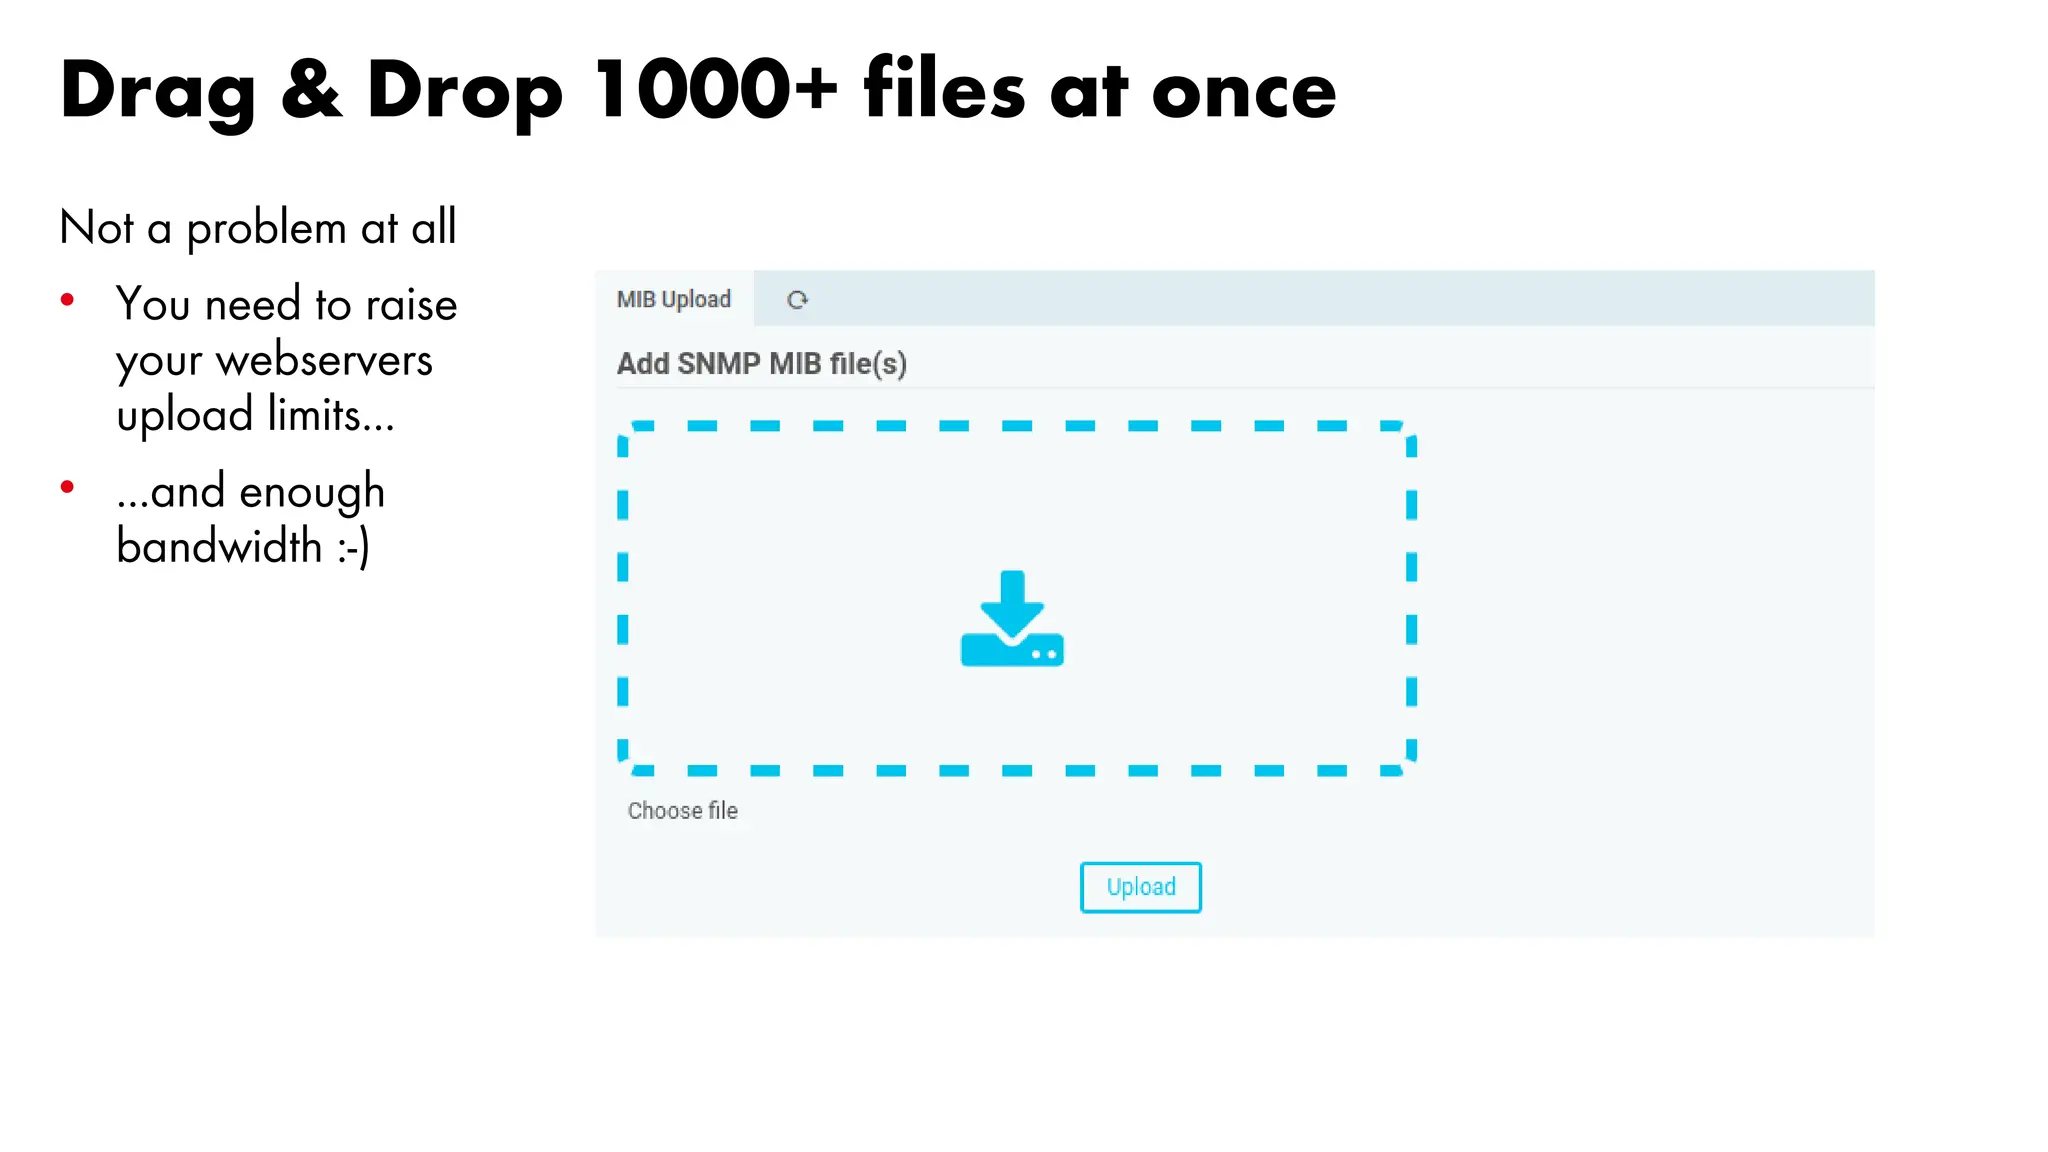
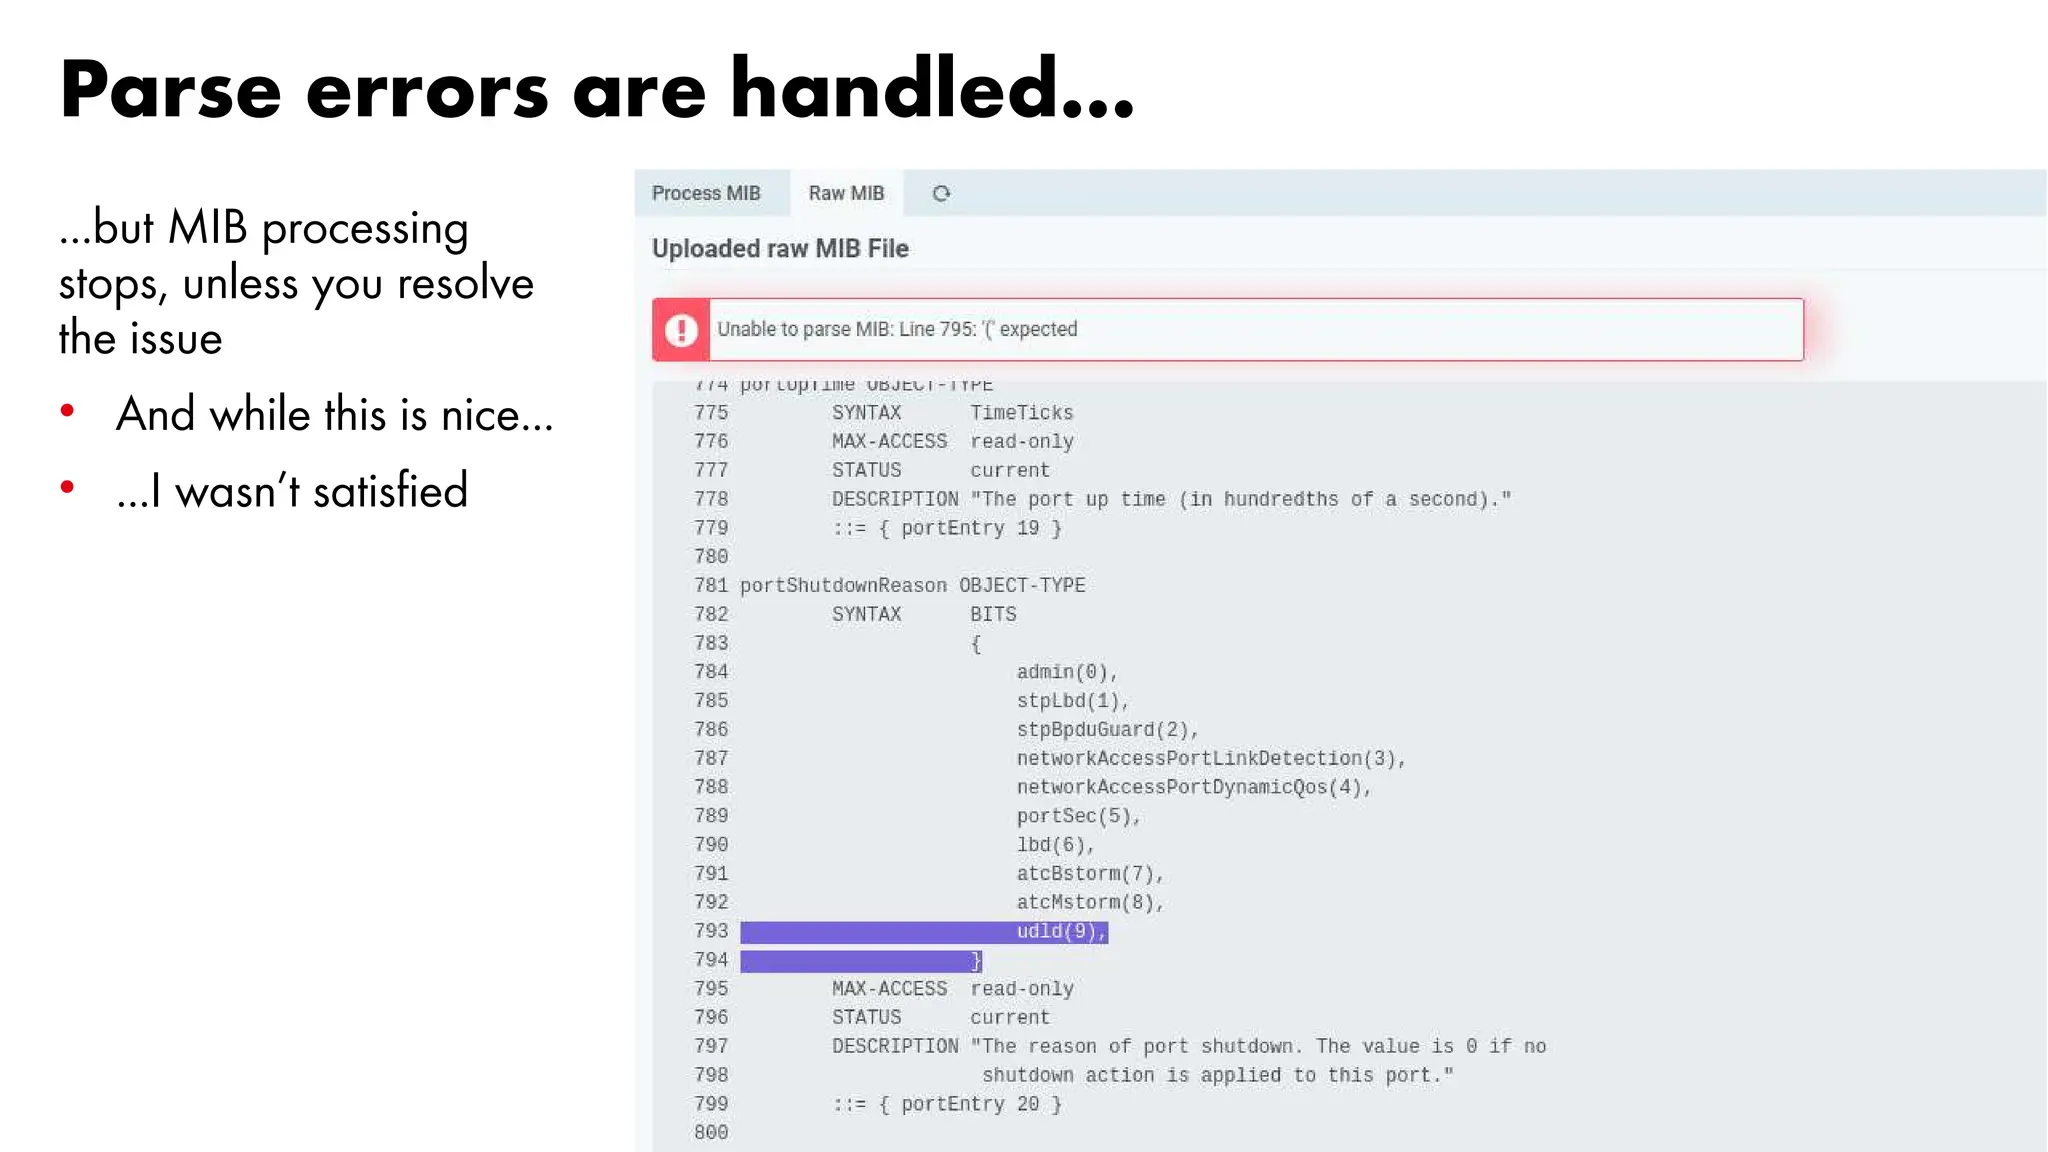
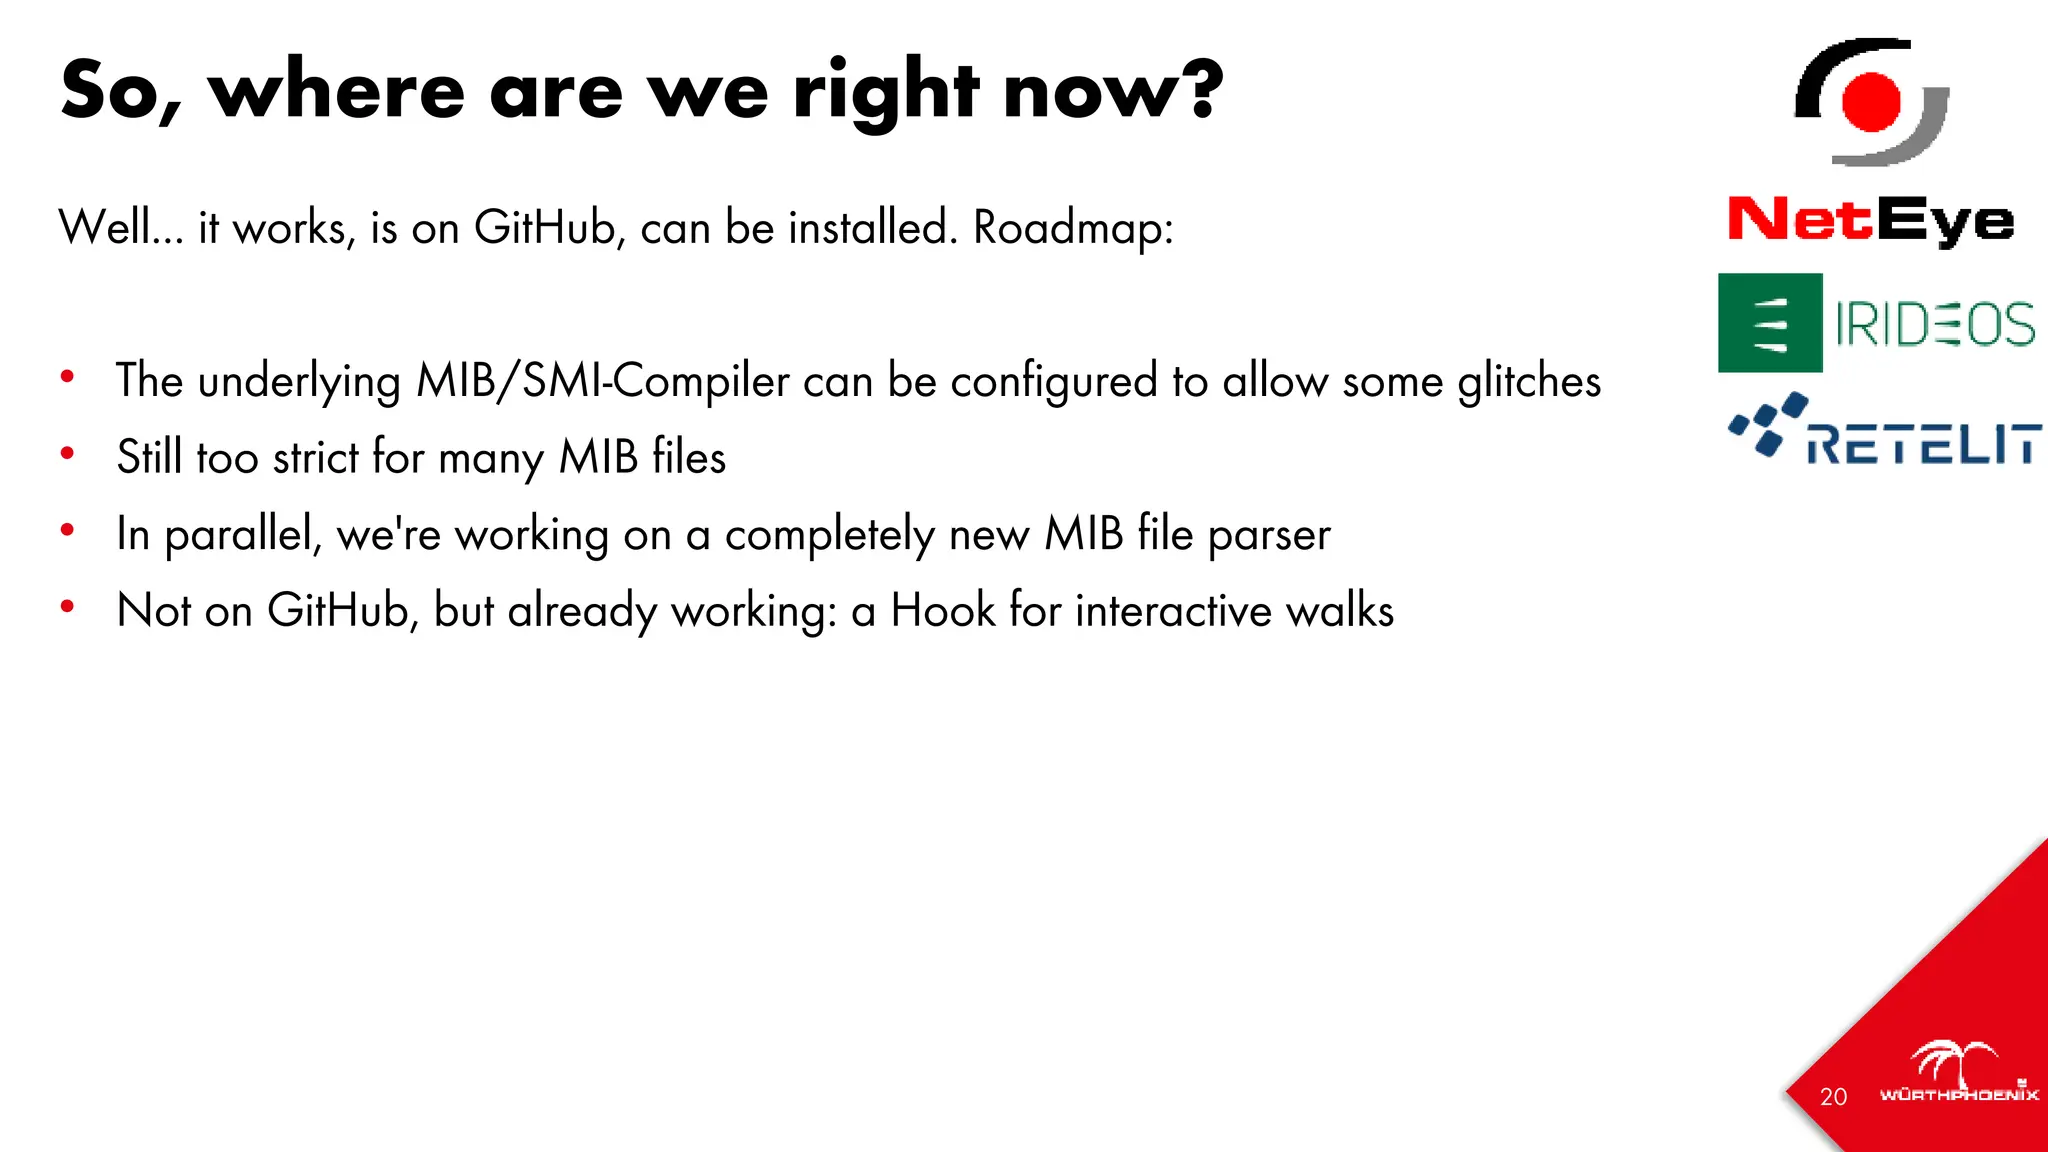
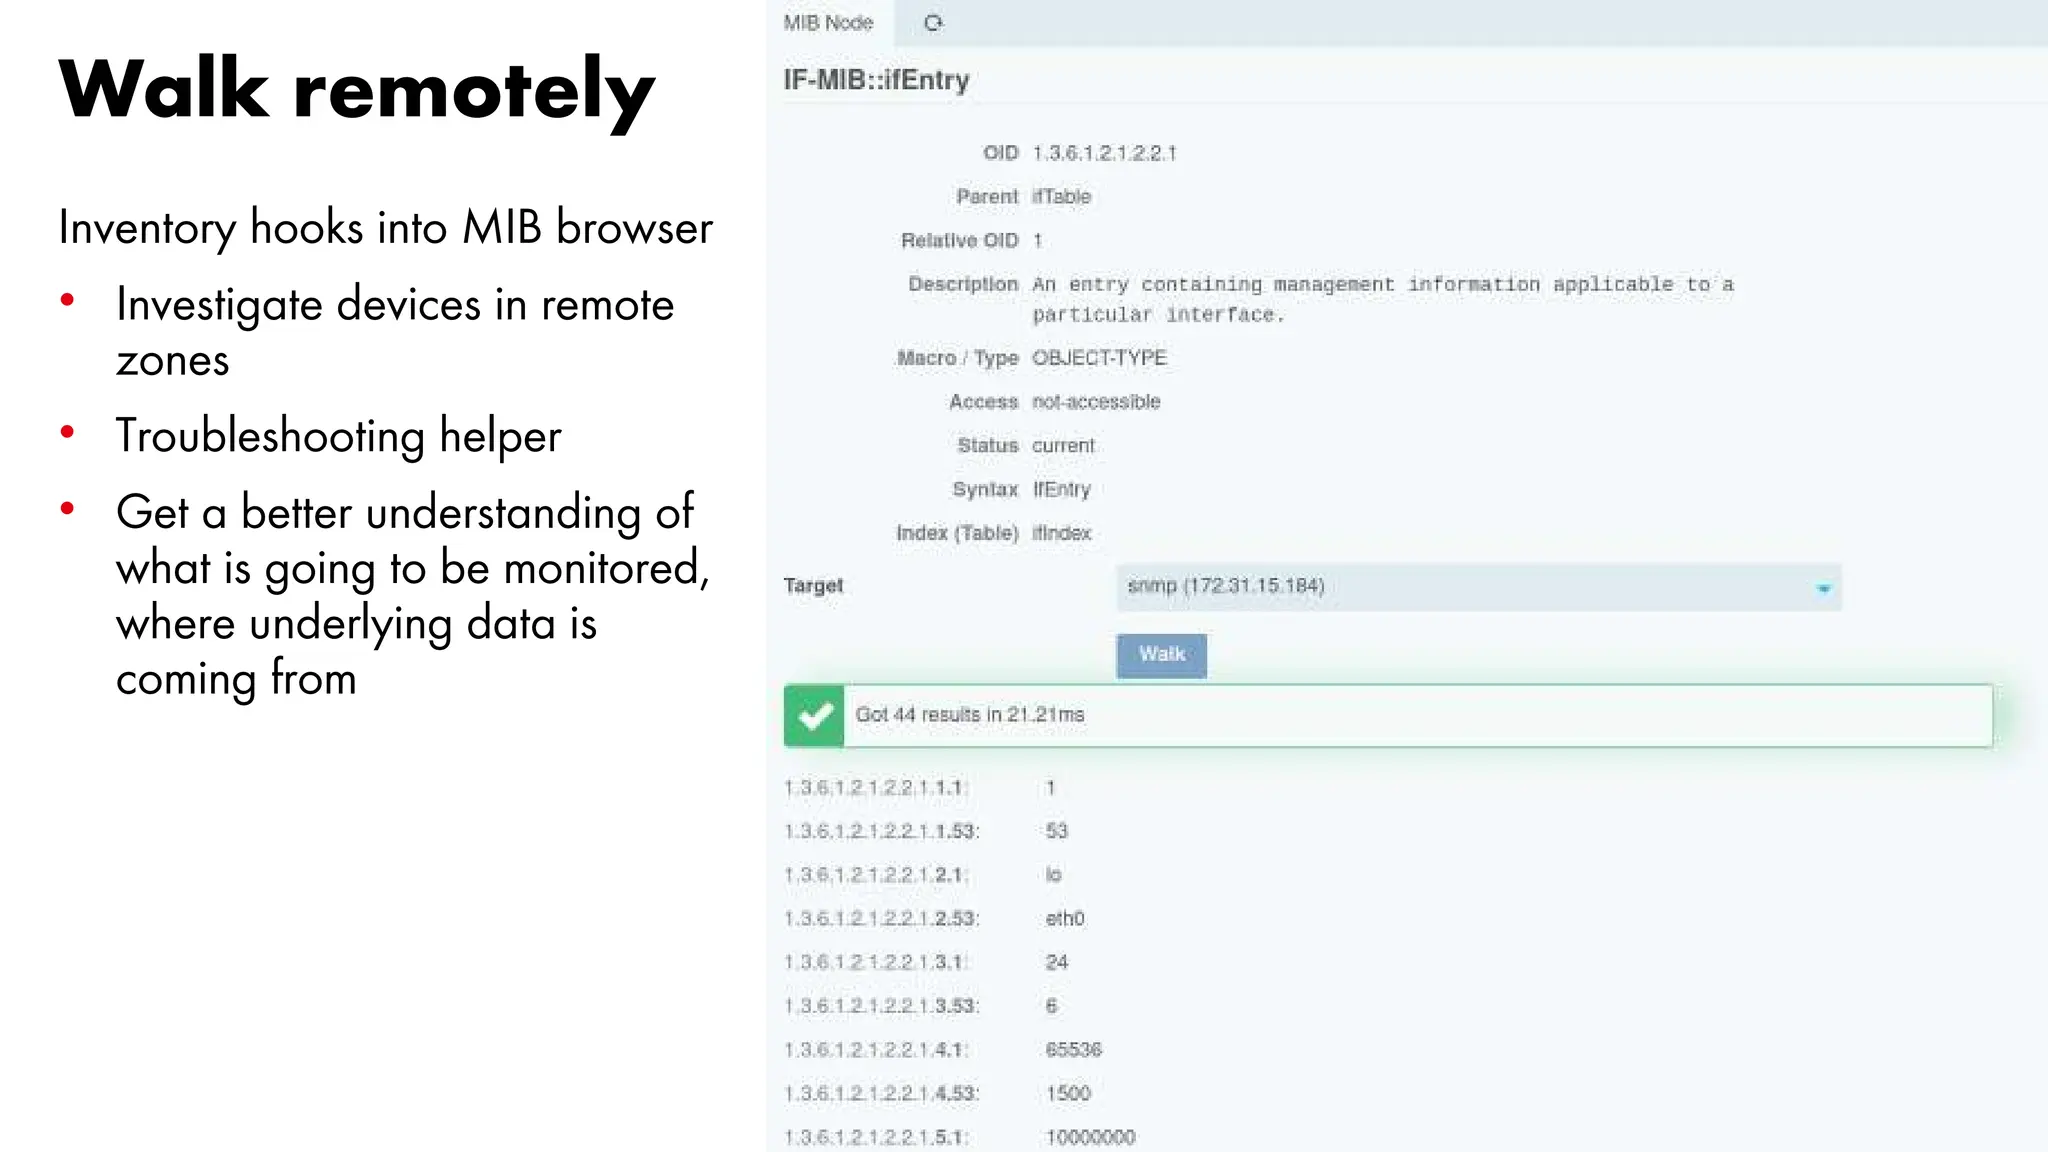
The document outlines the development and capabilities of NetEye, a unified monitoring solution created by Würth Phoenix, emphasizing its SNMP-based monitoring features and architecture. It discusses the challenges of SNMP monitoring, including vendor discrepancies in MIB implementations and plugin efficiency, as well as the project's ability to scale and manage extensive monitoring tasks. The presentation also highlights future goals, including a user-friendly MIB browser and enhanced data management capabilities for better network monitoring.


![[Seminar] Hướng dẫn viết test case](https://cdn.slidesharecdn.com/ss_thumbnails/huongdanviettestcasewanswer-160420012352-thumbnail.jpg?width=640&height=640&fit=bounds)