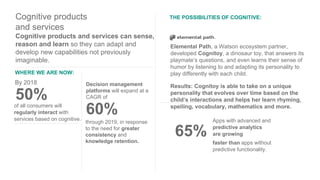
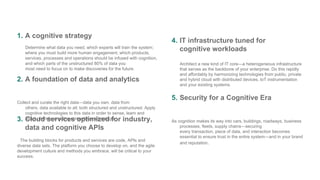
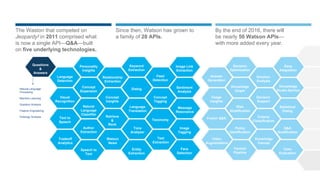
This document discusses cognitive computing and analytics technologies. It provides examples of how cognitive systems can be applied, such as a toy that learns from child interactions. The document outlines a cognitive strategy and foundation that includes collecting and analyzing both structured and unstructured data. It also discusses the importance of cloud services, infrastructure, and security for cognitive systems. Finally, the document describes some of the cognitive computing APIs available from IBM Watson and how the set of APIs has expanded over time.
A presentation given in Denmark, introducing cognitive computing, highlighting potential benefits and early use-cases in insurance with IBM Watson. The presentation included demos.
Link to youtube video of FlexRate Insurers self-service demo: https://www.youtube.com/watch?v=8xRN9RzpVBE&spfreload=10
Link to IBM Watson white paper on Cognitive Computing in Insurance:
Deloitte's report and point of view on IBM's Watson. IBM Watson, AI, Cognitive Computing are rapidly evolving technologies that can support and enhance enterprise solutions. Learn about IBM Watson the Why? and the How?
Customer Experience: A Catalyst for Digital TransformationCloudera, Inc.
Customer experience is a catalyst in many digital transformation projects. It is why many businesses invest in new technologies and processes to more effectively engage customers, constituents, or employees. The goal of putting digital tools to work in a transformative way is to ensure that data and insights connect people with information and processes that ultimately lead to a better experience for customers. Yet, it demands a modern approach that considers all of the platforms, processes, and data across the customer journey. The goal for many organizations is dynamically maintaining a single source of truth about each customer to drive personalized experiences based on individual preferences and behaviors.
However, businesses today have primarily invested in systems of record. While these systems are critical for managing internal operational processes, they are typically not effective for today's pace of business change. Insight-driven experiences require customer intelligence platforms that can finally create a customer 360. The deeper data and improved algorithms now available let users factor in individual affinity, segment, and a myriad of growing data sources. The result is greater relevance and effectiveness to deliver a differentiated experience that in today’s competitive landscape is not a luxury, but a necessity for survival.
In this session we will address:
3 things to learn:
•Leaders and Laggards of digital transformation
•How to create data-driven customer insights
•The importance of machine learning to uncover hidden insights
Demystifying IBM Watson: Uncover the Power of Cognitive SolutionsPerficient, Inc.
Successful organizations recognize that information is a strategic asset, capable of strengthening decision making, improving efficiency, reducing risk, and enhancing customer relationships. With the tremendous surge in the volume and diversity of data, leveraging this information across the entire enterprise is a business imperative that cannot be ignored.
IBM Watson harnesses the power of cognitive exploration, machine learning, and natural language processing to answer your most pressing questions, strengthen decision making, scale expertise, uncover key information in unstructured data, and reveal previously undiscovered data patterns and relationships.
In this SlideShare, we discuss:
Trends in cognitive solutions
Use cases for IBM Watson
Real-world Watson success stories
Getting started on the path to cognitive solutions
Big Data and Analytics: The IBM PerspectiveThe_IPA
Gareth Mitchell-Jones, Associate Partner Big Data & Analytics at IBM, shares his thoughts on the hot topic of Big Data from his unique perspective at an IPA 44 Club event in London. To learn more about The IPA visit www.ipa.co.uk and The 44 Club here http://www.ipa.co.uk/groups/44-club-2
Big Data LDN 2018: THE THIRD REVOLUTION IN ANALYTICSMatt Stubbs
Date: 13th November 2018
Location: Keynote Theatre
Time: 13:50 - 14:20
Speaker: Rob Davis
Organisation: MicroStrategy
About: While great strides have been made in equipping the analyst with ever smarter tools for gleaning insight from data, techniques and platforms for allowing the workforce to benefit from these insights in a timely fashion have been lacking. The third revolution in analytics will enable this wider workforce, consisting of front line workers who are not traditional users of data, to rapidly monetise insights coming from the business analyst even while their day to day actions improve the intelligence of the enterprise.
In this session, you will learn what characteristics an analytics platform must possess in order to enable the third revolution as well as see examples of how to build the organisational and cultural changes that are also necessary. A case study and common pitfalls to be avoided will be presented. Key industry trends such as AI, embedded analytics, and widening data literacy will be discussed as enablers for the third revolution in analytics.
Join Rob Davis, Vice President of Product Management for MicroStrategy, as he presents the importance of bridging this last mile of analytics to the creation of a truly Intelligent Enterprise.
What is IBM Watson, What is Cognitive Computing, What organizations benefit from IBM Watson, and get an exclusive look into IBM Watson in an in-depth demo exploration. For more information about Watson, email Cresco at info@crescointl.com or visit http://www.crescointl.com.
An initiative to healthcare analytics with office 365 and power bi spsparis2017Thuan Ng
Today data is a valuable asset in every organization, especially in healthcare industry. For example, with data about number of patients by location, hospital shall have the ability to offer more services to take care of them rapidly by building more medical stataion. Or with doctor's workload you know how to start hiring more human resources to balance the workload. With Office 365 - a digital workplace platform and PowerBI - a business intelligence and analytics on Microsoft Cloud service, let's have a look at how the digital transformation is initiated for healthcare industry.
Terminology guide for digital health in 2021Velametis
It is no surprise that 2020 contributed to a surge in digital healthcare-related activities, in light of the COVID-19 pandemic.
At Velametis, we anticipate a continued growth in the industry in 2021, so we collated the most important digital healthcare terms and definitions you will come across this year.
Find out more @ https://velametis.com/
Big data is an opportunity for communications service providers (CSPs) to create the intelligence for operating their infrastructures more efficiently, to analyze the success of their services, and to create a better personal experience for their customers.
CSP Top executives, Network and IT managers and Marketing, are eager to exploit the large amount of information to achieve better business decisions. They expect their Chief Technical Officer to provide end-to-end analytic solutions based on the data available in their IT and network infrastructure.
This presentation analyzes the complete value chain that can transform CSPs’ data to knowledge. It covers the sources of information, the data collection tools, the analytic platforms providing quick data access, and finally the business intelligence use cases with the presentation and visualization of the results and predictions.
Robert Lecklin - BigData is making a differenceIBM Sverige
Vad kan Big data göra för ditt företag? Låt dig inspireras av Robert Lecklin som har hjälpt flera kunder att implementera sin Big data strategi. Genom detta har de lyckats omvandlat värdelös data till värdefulla insikter. Han kommer i denna session att dela med sig av erfarenheter av kundcase där en strategi för big data gjort avgörande skillnad...
IBM Watson Ecosystem roadshow - Chicago 4-2-14cheribergeron
IBM Watson is powering a new generation of cognitive applications. Learn how IBM is partnering with visionaries and entrepreneurs to bring innovative cognitive applications to market through the IBM Watson Ecosystem.
Information Driven Enterprise Architecture - Connected Brains 2018LoQutus
In this session we will show you how to deliver business
improvements with enterprise and information architecture. During this session you will get new insights to increase value to the organisation. We also explain our LEAF framework, an integrated EA framework leveraging information to build architectures more quickly.
IBM Solutions Connect 2013 - Getting started with Big DataIBM Software India
You've heard of Big Data for sure. But what are the implications of this for your organisation? Can your organisation leverage Big Data too? If you decide to go ahead with your Big Data implementation where do you start? If these questions sound familiar to you then you've stumbled upon the right presentation. Go through the presentation to:
a. Learn more on Big data
b. How Big data can help you outperform in your marketplace.
c. How to proactively manage security and risk
d. How to create IT agility to underpin the business
Also, learn about IBM's superior Big Data technologies and how they are helping today's organisations take smarter decisions and actions.
Accelerate Self-Service Analytics with Data Virtualization and VisualizationDenodo
Watch full webinar here: https://bit.ly/3fpitC3
Enterprise organizations are shifting to self-service analytics as business users need real-time access to holistic and consistent views of data regardless of its location, source or type for arriving at critical decisions.
Data Virtualization and Data Visualization work together through a universal semantic layer. Learn how they enable self-service data discovery and improve performance of your reports and dashboards.
In this session, you will learn:
- Challenges faced by business users
- How data virtualization enables self-service analytics
- Use case and lessons from customer success
- Overview of the highlight features in Tableau
Top Business Intelligence Trends for 2016 by Panorama SoftwarePanorama Software
10 top BI trends for 2016 – by Panorama
Its all about the insight
Visual perception rules
The learning suggestive system - AI gets real
The data product chain becomes democratized
Cloud (finally)
“Mobile”
Automated data integration
Interned of things data accelerating into reality
Hadoop accelerators are the last chance for Hadoop
Fading of the centralized on–premise DWH
Bridging the Gap: Analyzing Data in and Below the CloudInside Analysis
The Briefing Room with Dean Abbott and Tableau Software
Live Webcast July 23, 2013
http://www.insideanalysis.com
Today’s desire for analytics extends well beyond the traditional domain of Business Intelligence. That’s partly because business users are realizing the value of mixing and matching all kinds of data, from all kinds of sources. One emerging market driver is Cloud-based data, and the desire companies have to analyze this data cohesively with their on-premise data sets.
Register for this episode of The Briefing Room to learn from Analyst Dean Abbott, who will explain how the ability to access data in the cloud can play a critical role for generating business value from analytics. He’ll be briefed by Ellie Fields of Tableau Software who will tout Tableau’s latest release, which includes native connectors to cloud-based applications like Salesforce.com, Amazon Redshift, Google Analytics and BigQuery. She’ll also demonstrate how Tableau can combine cloud data with other data sources, including spreadsheets, databases, cubes and even Big Data.
LoQutus helps organisations to innovate with analytics and to get insights with data visualisation. We also build large scale data layers to enable interaction with core data, and develop data-driven applications to deliver the insights our customers need. During this session we’ll share what we have learned along the way. We’ll show you our framework for self-service analytics & insights, and some successful case studies.
Accelerate Self-Service Analytics with Data Virtualization and VisualizationDenodo
Watch full webinar here: https://bit.ly/39AhUB7
Enterprise organizations are shifting to self-service analytics as business users need real-time access to holistic and consistent views of data regardless of its location, source or type for arriving at critical decisions.
Data Virtualization and Data Visualization work together through a universal semantic layer. Learn how they enable self-service data discovery and improve performance of your reports and dashboards.
In this session, you will learn:
- Challenges faced by business users
- How data virtualization enables self-service analytics
- Use case and lessons from customer success
- Overview of the highlight features in Tableau
A Winning Strategy for the Digital EconomyEric Kavanagh
The speed of innovation today creates tremendous opportunities for some, existential threats for others. Companies that win create their own success by leveraging modern data platforms. While architectures vary, the foundation is often in-memory, and the latency is real-time. Register for this Special Edition of The Briefing Room to hear veteran Analyst Dr. Robin Bloor explain how today's data platforms enable the modern enterprise in groundbreaking ways. He'll be briefed by Chris Hallenbeck of SAP who will demonstrate how forward-looking companies are leveraging real-time data platforms to achieve operational excellence, make decisions faster, and find new ways to innovate.
DataOps - Big Data and AI World London - March 2020 - Harvinder AtwalHarvinder Atwal
Title
DataOps, the secret weapon for delivering AI, data science, and business intelligence value at speed.
Synopsis
● According to recent research, just 7.3% of organisations say the state of their data and analytics is excellent, and only 22% of companies are currently seeing a significant return from data science expenditure.
● Poor returns on data & analytics investment are often the result of applying 20th-century thinking to 21st-century challenges and opportunities.
● Modern data science and analytics require secure, efficient processes to turn raw data from multiple sources and in numerous formats into useful inputs to a data product.
● Developing, orchestrating and iterating modern data pipelines is an extremely complex process requiring multiple technologies and skills.
● Other domains have to successfully overcome the challenge of delivering high-quality products at speed in complex environments. DataOps applies proven agile principles, lean thinking and DevOps practices to the development of data products.
● A DataOps approach aligns data producers, analytical data consumers, processes and technology with the rest of the organisation and its goals.
Advanced Analytics and Machine Learning with Data VirtualizationDenodo
Watch: https://bit.ly/2DYsUhD
Advanced data science techniques, like machine learning, have proven an extremely useful tool to derive valuable insights from existing data. Platforms like Spark, and complex libraries for R, Python and Scala put advanced techniques at the fingertips of the data scientists. However, these data scientists spent most of their time looking for the right data and massaging it into a usable format. Data virtualization offers a new alternative to address these issues in a more efficient and agile way.
Attend this webinar and learn:
- How data virtualization can accelerate data acquisition and massaging, providing the data scientist with a powerful tool to complement their practice
- How popular tools from the data science ecosystem: Spark, Python, Zeppelin, Jupyter, etc. integrate with Denodo
- How you can use the Denodo Platform with large data volumes in an efficient way
- How Prologis accelerated their use of Machine Learning with data virtualization
How IBM is Creating a Foundation for Cloud InnovationCCG
IBM is making waves in the Cloud Innovation. At our Data Analytics Meetup, Tom Ericsson, explores the transformation that IBM has taken with its recent announcement of moving from Bluemix to Cloud.
Watch here: https://bit.ly/2D1fqB6
Today’s evolving data landscape has spawned new business challenges that require innovative solutions. These challenges include:
- Strategic decision-making, which relies on multiple perspectives such as social and economic factors that require combining internal and external data.
- Accounting for the increased volume and structural complexity of today’s data, and increased frequency required in delivering data assets.
- Coping with data silos that house data that must be combined and provisioned to support decision-making.
- Exposing purpose-built analytics, such as supply chain, for consumption in order to expedite decision-making.
Attend this session to learn how Data as a Service, fueled by data virtualization, overcomes these common challenges from the three dimensions of:
- Provisioning information-rich external data assets,
- Connecting data silos, and
- Enabling pre-built and packaged analytics.
Agile Mumbai 2022
Real-Time Insights and AI for better Products, Customer experience and Resilient Platform
Balvinder Kaur
Principal Consultant, Thoughtworks
Sushant Joshi
Product Manager, Thoughtworks
Smarter Analytics: Supporting the Enterprise with AutomationInside Analysis
The Briefing Room with Barry Devlin and WhereScape
Live Webcast on June 10, 2014
Watch the archive:
https://bloorgroup.webex.com/bloorgroup/lsr.php?RCID=5230c31ab287778c73b56002bc2c51a
The data warehouse is intended to support analysis by making the right data available to the right people in a timely fashion. But conditions change all the time, and when data doesn’t keep up with the business, analysts quickly turn to workarounds. This leads to ungoverned and largely un-managed side projects, which trade short-term wins for long-term trouble. One way to keep everyone happy is by creating an integrated environment that pulls data from all sources, and is capable of automating both the model development and delivery of analyst-ready data.
Register for this episode of The Briefing Room to hear data warehousing pioneer and Analyst Barry Devlin as he explains the critical components of a successful data warehouse environment, and how traditional approaches must be augmented to keep up with the times. He’ll be briefed by WhereScape CEO Michael Whitehead, who will showcase his company’s data warehousing automation solutions. He’ll discuss how a fast, well-managed and automated infrastructure is the key to empowering faster, smarter, repeatable decision making.
Visit InsideAnlaysis.com for more information.
Data Vault 2.0 is a unique system of Data Warehousing created from the ground up to deal with real-world data challenges. Data Vault 2.0 delivers improved total cost of ownership, greatly enhanced operational agility and traceable data governance.
While Bitcoin is often considered the first real use case for blockchain, the technology has come a long way since those early days. Blockchain has been rebuilt from the ground up and is a driving force for new business models and regulated industries. Blockchain is a shared, immutable ledger for recording the history of transactions.
We are in a time of dizzying change. It’s estimated that nearly half of all jobs could be at risk over the next two decades because of Artificial Intelligence, automation, cloud and IoT.
Accelerate 2017_Julien Redmond_Designing Systems to Mitigate Predictable Surp...Certus Solutions
Julien Redmond's presentation for Accelerate 2017!
How can we design systems to mitigate predictable surprises and produce the right information when and where it's needed?
Accelerate 2017_What LEGO + The New York Times have been learning about disru...Certus Solutions
We are in a time of dizzying change. It’s estimated that nearly half of all jobs could be at risk over the next two decades because of Artificial Intelligence, automation, Cloud and IoT.
Humankind has entered uncharted territory in terms of the pace of technological change. The Fourth Industrial Revolution will confront us all - so how do we make sense of it and prepare ourselves for a not-so-dystopian future?
Accelerate 2017_Brand experience and context_Craig ParnhamCertus Solutions
Using location services to change brand experiences
How beacons and location services are transforming everyday experiences
More people than ever have location service-enabled devices, thanks to smartphones. Some product brands have had up to a 19-fold increase in interactions with customers who receive a location-based notification, versus those who do not. Learn about some of the countless examples and how you can benefit from them.
Accelerate 2017_Navigating Digital Disruption_James SlezakCertus Solutions
Keynote: How top organisations like The New York Times are navigating digital disruption
When The New York Times digital edition launched in January of 1996, it was a wholly separate operation, staffed out of a building on the other side of town and updated once a day. Like everything then, it was free.
Twenty years later, digital is at the core of the operation. Despite powerful voices of opposition and difficult economic headwinds, the digital operation is a source of rapid growth.
Certus Accelerate - Why You Need to Invest in Your Data by Vincent McBurneyCertus Solutions
Consider this: Data flows from every device, replacing guessing and approximations with precise information. Yet 80% of this data is unstructured; therefore, invisible to computers and of limited use to business.
Certus Accelerate - A Crystal Ball for Asset Intensive Industry by Scott PetersCertus Solutions
Over the past ten years asset intensive industries have had to learn to cope with disruptive influences including industry deregulation, changing customer demographics, rapid demand growth and environmental challenges. Whilst this change has been wide spread, at its core the digital revolution is primarily driven by consumer expectations and emerging technologies. Customers, both internal and external are now demanding better, more cost effective, portable services with the ability to personalise to their own specific needs.
Certus Accelerate - Building the business case for why you need to invest in ...Certus Solutions
Becoming an analytically driven or cognitive business is a journey.
Businesses will be able to rapidly capitalize on new opportunities if they have invested in the foundations of their information management systems.
Certus Accelerate - User Centred Everything by Sam WilliamsCertus Solutions
Designing business success - Sam Williams
External and internal, customers are becoming far more discerning and now expect to have rich information at their fingertips, immersive mobile interactions with your brand and personalised digital experiences that are tuned specifically to their needs. Combining a deep data analytics capability with User Experience Design can deliver a truly immersive and personalised experience that will delight your customers and deliver lasting competitive advantage to your business.
Certus Accelerate - Disruptive Thinking Disrupting Markets by David MastCertus Solutions
With at least 1500 self-declared start-ups currently operating in Australia – and a spate of recent global success stories like Atlassian, Freelancer, and OzForex – larger enterprises are taking notice of their up-and-coming counterparts like never before. Many big businesses are proclaiming their intent to “disrupt like a start-up”; some are taking it further with seed funds, incubators, and employee stints in co-working hubs. But what does disrupting like a start-up really mean? And can traditional organisations really do it?
As a Technologist and IBM’s Bluemix lead for A/NZ, David has witnessed firsthand how organisations can transform with themselves through disruptive technologies and business models. In this session he will share with you the blueprint to becoming a disruptive market force.
Innovation and Transformation in Financial ServicesCertus Solutions
Historically, financial services firms have struggled to target and tailor their product offerings to the customer journey. Often only traditional demographic information – gender, age, occupation – is collected with no real insight as to what life stage a customer is in and how this could influence their financial activity.
To compete in a consumer-empowered economy, it is increasingly clear that financial services firms must leverage their information assets to gain a comprehensive understanding of markets, customers, channels, products, regulations, competitors, suppliers, employees and more.
Connector Corner: Automate dynamic content and events by pushing a buttonDianaGray10
Here is something new! In our next Connector Corner webinar, we will demonstrate how you can use a single workflow to:
Create a campaign using Mailchimp with merge tags/fields
Send an interactive Slack channel message (using buttons)
Have the message received by managers and peers along with a test email for review
But there’s more:
In a second workflow supporting the same use case, you’ll see:
Your campaign sent to target colleagues for approval
If the “Approve” button is clicked, a Jira/Zendesk ticket is created for the marketing design team
But—if the “Reject” button is pushed, colleagues will be alerted via Slack message
Join us to learn more about this new, human-in-the-loop capability, brought to you by Integration Service connectors.
And...
Speakers:
Akshay Agnihotri, Product Manager
Charlie Greenberg, Host
LF Energy Webinar: Electrical Grid Modelling and Simulation Through PowSyBl -...DanBrown980551
Do you want to learn how to model and simulate an electrical network from scratch in under an hour?
Then welcome to this PowSyBl workshop, hosted by Rte, the French Transmission System Operator (TSO)!
During the webinar, you will discover the PowSyBl ecosystem as well as handle and study an electrical network through an interactive Python notebook.
PowSyBl is an open source project hosted by LF Energy, which offers a comprehensive set of features for electrical grid modelling and simulation. Among other advanced features, PowSyBl provides:
- A fully editable and extendable library for grid component modelling;
- Visualization tools to display your network;
- Grid simulation tools, such as power flows, security analyses (with or without remedial actions) and sensitivity analyses;
The framework is mostly written in Java, with a Python binding so that Python developers can access PowSyBl functionalities as well.
What you will learn during the webinar:
- For beginners: discover PowSyBl's functionalities through a quick general presentation and the notebook, without needing any expert coding skills;
- For advanced developers: master the skills to efficiently apply PowSyBl functionalities to your real-world scenarios.
The Art of the Pitch: WordPress Relationships and SalesLaura Byrne
Clients don’t know what they don’t know. What web solutions are right for them? How does WordPress come into the picture? How do you make sure you understand scope and timeline? What do you do if sometime changes?
All these questions and more will be explored as we talk about matching clients’ needs with what your agency offers without pulling teeth or pulling your hair out. Practical tips, and strategies for successful relationship building that leads to closing the deal.
Neuro-symbolic is not enough, we need neuro-*semantic*Frank van Harmelen
Neuro-symbolic (NeSy) AI is on the rise. However, simply machine learning on just any symbolic structure is not sufficient to really harvest the gains of NeSy. These will only be gained when the symbolic structures have an actual semantics. I give an operational definition of semantics as “predictable inference”.
All of this illustrated with link prediction over knowledge graphs, but the argument is general.
GraphRAG is All You need? LLM & Knowledge GraphGuy Korland
Guy Korland, CEO and Co-founder of FalkorDB, will review two articles on the integration of language models with knowledge graphs.
1. Unifying Large Language Models and Knowledge Graphs: A Roadmap.
https://arxiv.org/abs/2306.08302
2. Microsoft Research's GraphRAG paper and a review paper on various uses of knowledge graphs:
https://www.microsoft.com/en-us/research/blog/graphrag-unlocking-llm-discovery-on-narrative-private-data/
Accelerate your Kubernetes clusters with Varnish CachingThijs Feryn
A presentation about the usage and availability of Varnish on Kubernetes. This talk explores the capabilities of Varnish caching and shows how to use the Varnish Helm chart to deploy it to Kubernetes.
This presentation was delivered at K8SUG Singapore. See https://feryn.eu/presentations/accelerate-your-kubernetes-clusters-with-varnish-caching-k8sug-singapore-28-2024 for more details.
Slack (or Teams) Automation for Bonterra Impact Management (fka Social Soluti...Jeffrey Haguewood
Sidekick Solutions uses Bonterra Impact Management (fka Social Solutions Apricot) and automation solutions to integrate data for business workflows.
We believe integration and automation are essential to user experience and the promise of efficient work through technology. Automation is the critical ingredient to realizing that full vision. We develop integration products and services for Bonterra Case Management software to support the deployment of automations for a variety of use cases.
This video focuses on the notifications, alerts, and approval requests using Slack for Bonterra Impact Management. The solutions covered in this webinar can also be deployed for Microsoft Teams.
Interested in deploying notification automations for Bonterra Impact Management? Contact us at sales@sidekicksolutionsllc.com to discuss next steps.
Elevating Tactical DDD Patterns Through Object CalisthenicsDorra BARTAGUIZ
After immersing yourself in the blue book and its red counterpart, attending DDD-focused conferences, and applying tactical patterns, you're left with a crucial question: How do I ensure my design is effective? Tactical patterns within Domain-Driven Design (DDD) serve as guiding principles for creating clear and manageable domain models. However, achieving success with these patterns requires additional guidance. Interestingly, we've observed that a set of constraints initially designed for training purposes remarkably aligns with effective pattern implementation, offering a more ‘mechanical’ approach. Let's explore together how Object Calisthenics can elevate the design of your tactical DDD patterns, offering concrete help for those venturing into DDD for the first time!
Epistemic Interaction - tuning interfaces to provide information for AI supportAlan Dix
Paper presented at SYNERGY workshop at AVI 2024, Genoa, Italy. 3rd June 2024
https://alandix.com/academic/papers/synergy2024-epistemic/
As machine learning integrates deeper into human-computer interactions, the concept of epistemic interaction emerges, aiming to refine these interactions to enhance system adaptability. This approach encourages minor, intentional adjustments in user behaviour to enrich the data available for system learning. This paper introduces epistemic interaction within the context of human-system communication, illustrating how deliberate interaction design can improve system understanding and adaptation. Through concrete examples, we demonstrate the potential of epistemic interaction to significantly advance human-computer interaction by leveraging intuitive human communication strategies to inform system design and functionality, offering a novel pathway for enriching user-system engagements.
25. RIGHT BRAIN
CONCLUSIONS
1. Accelerated learning platform
2. This is the intersection between AI + BI
3. Human + Machine + Expert
4. Creating entirely new possibilities not yet
thought of
5. Enabling entirely different approaches to
building applications, mining data +
achieving business outcomes…. staying
competitive
27. Cognitive products
and services
Cognitive products and services can sense,
reason and learn so they can adapt and
develop new capabilities not previously
imaginable.
THE POSSIBILITIES OF COGNITIVE:
Elemental Path, a Watson ecosystem partner,
developed Cognitoy, a dinosaur toy, that answers its
playmate’s questions, and even learns their sense of
humor by listening to and adapting its personality to
play differently with each child.
Results: Cognitoy is able to take on a unique
personality that evolves over time based on the
child’s interactions and helps her learn rhyming,
spelling, vocabulary, mathematics and more.
WHERE WE ARE NOW:
Decision management
platforms will expand at a
CAGR of
By 2018
Apps with advanced and
predictive analytics
are growing
of all consumers will
regularly interact with
services based on cognitive.
50%
faster than apps without
predictive functionality.
65%
60%
through 2019, in response
to the need for greater
consistency and
knowledge retention.
28. It’s an
“always-on” world
A Do-It-Yourself
mentality now prevails
Expectations from technology have never been higher
Our work and personal
lives have blurred
30. Even a simple analytics project has multiple steps and people
Data Access
Data Preparation
Analysis
Validation
Collaboration
Reporting
Business
Analysts
Business
Users
Data Scientists
and
Statisticians
IT
31. And it’s rarely a straightforward process
Business
Users Data Scientists
and
Statisticians
IT
Data Access
Analysis
Validation
Collaboration
Reporting
Data Preparation
Business
Analysts
32. Think Ahead
Tell a Story
Understand Your
Business
Get Better Data
Mobile Ready Secure
Embedded information services provide
data access and refinement
Automated intelligence accelerates your
ability to answer questions
Predictive analytics reveals insights and
opportunities
Visualizations support your decisions and
communicate results
Put analytics in the hands of a broad range of users
Make data access and refinement easier
Deliver through the cloud for agility and speed
33. Business Analysts Data Scientists IT
Self-service analytics for business users and
experts alike
Business Users
34. Empowering the business for success
Prioritizing
Accounts
Receivable
Employee
Retention
Helpdesk
Case
Analysis
Campaign
Planning and ROI
Warranty
Analysis
Customer
Retention
Finance HRITMarketing OperationsSales
35. “Which accounts are most likely to be paid?
How can collections be more efficient? How
does it affect revenue and profit when we lose
customers? How can the sales pipeline help
me forecast revenue?”
Justin Chen, Finance Manager
36. Justin Chen
Customer attrition
Watson Analytics analyzes
customer data to identify which
customers are likely to leave and
why and predicts the effect on
revenue. Justin can then
determine which customer
investments will lead to more
profitable growth.
39. Single Analytics Experience
Fully Automated Intelligence
Natural Language Dialogue
Guided Analytic Discovery
Visit WatsonAnalytics.com
and get started for free
40. 1. A cognitive strategy
Determine what data you need, which experts will train the system;
where you must build more human engagement; which products,
services, processes and operations should be infused with cognition,
and which parts of the unstructured 80% of data you
most need to focus on to make discoveries for the future.
2. A foundation of data and analytics
Collect and curate the right data—data you own, data from
others, data available to all; both structured and unstructured. Apply
cognitive technologies to this data in order to sense, learn and
adapt, thereby creating competitive advantage.3. Cloud services optimized for industry,
data and cognitive APIs
The building blocks for products and services are code, APIs and
diverse data sets. The platform you choose to develop on, and the agile
development culture and methods you embrace, will be critical to your
success.
4. IT infrastructure tuned for
cognitive workloads
Architect a new kind of IT core—a heterogeneous infrastructure
that serves as the backbone of your enterprise. Do this rapidly
and affordably by harmonizing technologies from public, private
and hybrid cloud with distributed devices, IoT instrumentation
and your existing systems.
5. Security for a Cognitive Era
As cognition makes its way into cars, buildings, roadways, business
processes, fleets, supply chains—securing
every transaction, piece of data, and interaction becomes
essential to ensure trust in the entire system—and in your brand
and reputation.
41. Relationship
Extraction
Questions
&
Answers
Language
Detection
Personality
Insights
Keyword
Extraction
Image Link
Extraction
Feed
Detection
Visual
Recognition
Concept
Expansion
Concept
Insights
Dialog Sentiment
Analysis
Text to
Speech
Tradeoff
Analytics
Natural
Language
Classifier
Author
Extraction
Speech to
Text
Retrieve
&
Rank
Watson
News
Language
Translation
Entity
Extraction
Tone
Analyzer
Concept
Tagging
Taxonomy
Text
Extraction
Message
Resonance
Image
Tagging
Face
Detection
Answer
Generation
Usage
Insights
Fusion Q&A
Video
Augmentation
Decision
Optimization
Knowledge
Graph
Risk
Stratification
Policy
Identification
Emotion
Analysis
Decision
Support
Criteria
Classification
Knowledge
Canvas
Easy
Adaptation
Knowledge
Studio Service
Statistical
Dialog
Q&A
Qualification
Factoid
Pipeline
Case
Evaluation
The Waston that competed on
Jeopardy! in 2011 comprised what
is now a single API—Q&A—built
on five underlying technologies.
Since then, Watson has grown to
a family of 28 APIs.
By the end of 2016, there will
be nearly 50 Watson APIs—
with more added every year.
Natural Language
Processing
Machine Learning
Question Analysis
Feature Engineering
Ontology Analysis
44. Certus are helping customers build an
Information Architecture that stores,
explores and analyses data in new
ways.
45. New Architecture to Leverage All Data and Analytics
Data in
Motion
Data at
Rest
Data in
Many Forms
Information
Ingestion and
Operational
Information
Decision
Management
BI and Predictive
Analytics
Navigation
and Discovery
Intelligence
Analysis
Landing Area,
Analytics Zone
and Archive
Raw Data
Structured Data
Text Analytics
Data Mining
Entity Analytics
Machine Learning
Real-time
Analytics
Video/Audio
Network/Sensor
Entity Analytics
Predictive
Exploration,
Integrated Warehouse,
and Mart Zones
Discovery
Deep Reflection
Operational
Predictive
Stream Processing
Data Integration
Master Data
Streams
Information Governance, Security and Business Continuity
46. BigInsights Hadoop
Data Platform
Sources
Information Server Data Integration
Watson Data Exploration BI / Analytics
Break the “Waterfall Style” Lifecycle
• Empowers LOB to access data sooner
• Eliminates slow modeling prior to staging
Analytics Performance Booster
• Leveraging Teradata for its strength
• Less wasted process, fewer batch windows
Lower Cost Staging, ELT and Deep Data
• Commodity infrastructure for data platform
• Automated data transformation and governance
Fresh Capacity and Cost Avoidance
• Recoup previously displaced disk
• Defer costly upgrades for production uses
Improving Integration for Analytics
47. Certus are using cutting edge
matching to give companies a 360
degree view of customers, students,
products or assets
48. Maximize 1:1 consumer
relationships
Deliver personalized offers
aligned to unique behaviors,
needs and desires
Brand reputation
Right message every time in
market
Marketing productivity
Increased breadth of digital channels,
emphasis on cross-sell / up-sell / right-
sell opportunities, understanding and
embracing ROMI
Deliver value across all
touch points
Build opportunity for revenue
growth throughout marketing
value chain
360 Degree View of the Customer
Understanding, responding and maximizing each
unique customer relationship
Optimize marketing mix
Model and plan balancing needs of
channels, probability of ROI success and
resource constraints
Customer growth and retention
Demanding customers, commoditized
products and crowded competitive
marketplace
Define MDM Value
49. Consuming Applications
Contact Warehouse CRM MarketingPortal
Kate Lamb
32 George Street
Perth, 6000
Kate Jones
Perth, WA 6000
12/06/1970
Catherine Jones
44 Station Street
Perth, WA
Mrs K Lamb
32 St. George
06/12/1970
Dr Katherine Lamb
23 George St
Perth, 6000
06/12/1970
Miss C Jones
Station Street, Perth
Western Australia, 6000
12/06/1970
Person Entity
Dr. Katherine Lamb
Composite View
Dr Katherine Lamb
32 George St, Perth, WA 6000
DOB: 12/06/1970
Probabilistic Matching
50. Household relationships
› Inspect potential household members and
link to confirm relationships.
Employment Relationships
› Inspect relationships between companies
and staff.
Joseph’s
Household
Wife of
Daughter
of
Son
of
Is the Subsidiary of
Supplies
Product to
Is Married to
Is the
Owner
of
Has an
Account
with
Is Employed by
Entity Relationships
51. Big Match › The same MDM Match engine runs on Hadoop to connect
more sources of information about the customer.
52. Increased engagement
Increased revenue
Decreased risk
Less ‘gut feel’
More data (when used effectively)
Increase on Churn retention rate (no
discounting required)
More newsletter article clicks
More articles read per session
Lookalike acquisition model
increasing conversion
Strong Ad revenue growth 20%
10%
Linkage: audience connections
Any hard links across accounts, Consumer & Household, Fuzzy matching, Enrichment (Single Customer View)
MDM Value – News Corp
Presentation to IBM SolutionConnect Event Sydney 2014
53. Certus are helping customers put in
successful data stewardship models to
trust the results they get from reporting
and analytics.
54. Technology Driven
Process Driven
1) Define
Business
Problem
2) Obtain
Executive
Sponsorship
3) Conduct
Maturity
Assessment
4) Build
Roadmap
6) Build
Business
Glossary
7) Understand
Data
8) Create
Metadata
Repository
5) Establish
Organizational
Blueprint
9) Define
Metrics
11) Govern
Master Data
10) Govern
Data Quality
14) Govern
Analytics
13) Govern
Security &
Privacy
12) Govern
Lifecycle of
Information
15) Measure
Results
56. Monitoring Quality and Stewardship Tasks
Data Quality Dashboard
› Data Quality Metrics across lines of
business that makes quality relevant to
everyone.
Stewardship Center
› Manage a team of stewards and allocates
data quality investigation and data
remediation tasks.
57. › Certus has helped
customers manage
data quality via a
policy driven
approach.
Data Quality Scorecards
57
59. Quality and Lineage behind a report
Data lineage
track back,
quality of each
asset in lineage
Data Quality
trends over time
Quality Metrics
60. QSuper Success Story
IBM Insight Conference 2015
Operational Impact
› Productivity improvements
through automation of data
checking reporting.
› Data checking is consistency
applied
› Increased confidence in data
› Workloads can be managed and
anticipated
› KPI’s can be applied
Regulatory Impact
› Risk and Compliance reporting
is measurable and can be
monitored
› Mitigating risk of penalties and
fines through more accurate
reporting
› Industry leader in data quality
activities.
60
Editor's Notes
900 million smart phones will be sold this year
Next year will see one-mobile enabled device for every human on earth. That’s 7 billion.
125,000 sold in 2001
Useful Content
We can understand who this lady is influenced by and as well who she inspires…
Fiction vs Fact.
Dream vs Reality.
Brand can shape reality, in just the same way as fiction can shape fact.
Fiction vs Fact.
Dream vs Reality.
Brand can shape reality, in just the same way as fiction can shape fact.
Fiction vs Fact.
Dream vs Reality.
Brand can shape reality, in just the same way as fiction can shape fact.
Fiction vs Fact.
Dream vs Reality.
Brand can shape reality, in just the same way as fiction can shape fact.
Fiction vs Fact.
Dream vs Reality.
Brand can shape reality, in just the same way as fiction can shape fact.
Fiction vs Fact.
Dream vs Reality.
Brand can shape reality, in just the same way as fiction can shape fact.
Fiction vs Fact.
Dream vs Reality.
Brand can shape reality, in just the same way as fiction can shape fact.
Fiction vs Fact.
Dream vs Reality.
Brand can shape reality, in just the same way as fiction can shape fact.
Fiction vs Fact.
Dream vs Reality.
Brand can shape reality, in just the same way as fiction can shape fact.
The world is changing, what do we as individuals see differently now?
Expectations are increasing: At work and at home, we expect technology to deliver immediate access to the information we seek. As the lines between our personal and work lives blur, we’re expected to know more, understand more and do more. If the technology we use doesn't provide value immediately, we simply drop it and move on to the next thing.
Make better decisions faster: We live and work at a relentless pace, and we’ve never been more connected to the people, brands and information that matter to us most. With the intense speed of business today, time—or more clearly, our “return on time”—has become a primary currency by which many measure value. Making better decisions rapidly is no longer a goal; it’s an imperative. We must shrink the time to informed action, which requires us to deliver more than just faster answers; it demands that we identify the right questions to ask.
Do it yourself thinking: We’ve become a global society that practices independent investigation and pervasive learning. Have a question? Get an answer…quickly, simply, and on your own. The data is there, and so are the technologies that make it easy to identify, explore, verify and share that information. This freedom breeds creativity in how we approach problem-solving, even as it fuels expectations that we can consistently deliver fast, correct action.
Even a simple analytics project has multiple steps and people. Projects require multiple steps in order facilitate and adhere to the policies or practices that are important to the business process. However its rarely straight forward and does not address the needs of rapid and agile data exploration and discovery.
Projects require multiple steps like accessing and obtaining data. Business units and individuals from IT and departmental analysts are needed to manage and govern data sources. Providing this data to Analysts takes time and resources. Validation of this data is critical to avoid errors and poor decision making before the data is reviewed and approved for its original intent. If the data is wrong then the reporting will be wrong and decisions will be inadequate.
We have arrived at a tipping point where the abundance of data, emergence of cloud, advances in analytics, new user experience design and business models mean data-driven decisions can now be an essential, daily and valuable activity for business people. No longer just for data scientists or IT -- marketing, sales, operations, finance and HR professionals can gain answers they need from all types of data. This requires a revolution in analytics technology, helping people acquire, refine data, discover insights, predict outcomes, visualize results, create reports, and collaborate with others in a unified user experience that speaks the language of business.
Introducing IBM Watson Analytics.
Watson Analytics offers automated data preparation and intelligence, engaging storytelling and guided predictions so you can find answers and action in your data on your own. No matter what part of the organization you’re in.
Watson Analytics is such a revolution - a revolution in the techniques themselves and a further revolution in the convergence of all these technologies together. The result will be widespread adoption of advanced analytics in the business world.
IBM Watson Analytics delivers a unified analytics experience on the cloud and helps you focus on the drivers that matter most in your business. By automating the steps of data access and refinement, predictive analysis, and visual storytelling, Watson Analytics immediately identifies and explains hidden patterns and relationships to accelerate your understanding of why things happened and what's likely to happen. Because Watson Analytics features natural language dialogue, you can ask the right questions and get results in the familiar terms of your business. Just as the first spreadsheet made financial calculations easier for anyone with a PC, Watson Analytics opens up the world of advanced analytics to all business users on the cloud.
Think ahead
Watson Analytics helps you go where your ideas take you with guided and predictive analytics and recommendations. Pursuing ideas, answering questions, making predictions, and deciding what to do next should be as easy as using an app on your smartphone. And you shouldn’t need help from IT or expertise from data scientists. With Watson Analytics, making decisions, anticipating outcomes and taking action can now be a smooth and interesting process. And, if you aren’t sure what you need to do, Watson Analytics automatically starts you off with ideas and guides you through analysis so you can find meaning in your information and make better decisions. It even introduces additional capabilities you might find useful as you become bolder and want to dig deeper.Make more informed decisions to move your business forward.
Tell a story
Visualization is the illustration of trends and patterns in your data so they can be understood. It is a critical capability of analytics. Having the right visualization can make the difference between seizing the right opportunity and making a sketchy decision. However, choosing just the right one can be tricky. Watson Analytics recommends the visualizations that illustrate what’s important the most effectively and brilliantly. You can use these visualizations to create infographics that advance understanding and communication and spur the right action.Ask questions and receive answers in the language you use in your business.
Understand your business
Watson Analytics jumpstarts your analysis. It automates intelligence to accelerate your ability to get to the answers you’re seeking. It immediately starts you off with a visual story that illustrates what you need to know. Instead of fumbling over data or searching for answers, you can focus on understanding your business and effectively communicating results to others. Simply type in what you would like to see and Watson Analytics produces comprehensive results that explain why things happened and what's likely to happen, all in familiar terms. And as you interact with the results, you can continuously fine-tune your questions to get to the heart of the matter.Tell a clear, insightful story through rich data visualization.
Get better data
Built into Watson Analytics are information management services for data access, refinement and management. Cloud-based data management services automatically find, acquire and improve data sets with the touch of a button. And, the latest in columnar and in-memory technology handles large volumes of data with ease. Watson Analytics can also score the readiness of your data for analysis, highlighting potential data issues that could compromise results. What does this mean for you? Basically, you don’t have to worry about the state of your data. Watson Analytics is designed to make sure the right data is ready when you are. With automation and embedded data refinery services, you get better data and better understanding. Whether you are in marketing, sales, IT, operations, HR or finance, you have the trusted data and intelligence you need to complete your projects.
Take advantage of automation — from data preparation to analysis.
Who is Watson Analytics for?
Watson Analytics offers self-service capabilities to the full range of business users and experts alike:
-Individual Business Users, like sales operations, marketing programs managers, financial analysts, or operations managers, who are looking to better understand the data relevant to their job roles;
-Business Analysts, whose jobs are centered around processing information for the organization, and who want to go beyond measuring and start understanding, but don’t have ready access to advanced analysts such as data scientists, statisticians, data miners, or BI architects; and
-Data Scientists themselves who can spend 40-80% of their time on data access and refinement. Watson Analytics can be an accelerator for them.
-IT, who can deliver improvements in productivity to business users without having to support multiple solutions, ungoverned data sources, or rogue data analysis projects.
What issue or opportunities does Watson Analytics address?
The world and the way people work are changing:
Departmental experts and analysts are expected to drive better data-driven decisions, but lack the breadth of advanced skills needed for data management, building predictive models, and effectively communicating the correct conclusions.
Making quality decisions rapidly is no longer a goal; it’s an imperative. Reducing the time to informed action requires a streamlined ability to draw compelling conclusions without reliance on too many people and the need to leverage multiple disparate tools.
Self-service is increasingly becoming more important as business users are pressured and motivated to quickly find answers on their own.
Self-service needs are increasing, but IT is concerned about maintaining corporate data governance standards.
The expectation of today’s workforce is that they can access and analyze their data anytime, anywhere. And then getting insights to all stakeholders quickly is critical to delivering fast, correct action.
Watson Analytics can be used for a wide variety of business use cases. Here are just a few examples such as:
Marketing
Lead Prioritization: Increase the quality of leads in your sales pipeline by discovering the driving factors of leads that resulted in successful sales. Target leads and prospects that will have a higher likelihood of becoming a sale to boost revenue and reduce costs by not spending time and resources on leads with little chance of becoming a sale.
Customer Value Analysis: Customer growth improves overall profitability of the business and drives increased customer value and loyalty, delivering value-added products and services to an organization’s existing customer base. This is accomplished by first discovering the attributes that drive profitability, identifying what customers meet the identified profitable profiles, and then proactively providing those customers with highly targeted recommendations across all customer interaction channels to drive an increase in conversions and customer profitability
Campaign Prediction and Planning: Improve effectiveness and efficiency in marketing departments by predicting which customers will respond to various campaigns. Predictive analytics provides value by increasing the quality of leads and the likelihood of response while reducing costs by efficiently targeting the customer through the right channel with the right offer at the right time.
Sales
Win/Loss Prediction: Analyze your sales pipeline and predict with confidence which deals have the highest chance of closing and those you’re at risk of losing to allocate resources effectively. Anticipate performance gaps in your sales pipeline, analyze current conditions and alternatives, and then optimize outcomes for predictable sales performance.
Customer Retention: Predict which customers will leave and present customers' level of risk. Watson Analytics provides value by increasing customer retention and increasing the effectiveness of customer retention programs by targeting those customers most at risk of leaving.
Finance
Account Receivable Prioritization: Leverage Watson Analytics for collections. Organization can optimally determine their customers least likely to pay to most likely and prioritize their outreach and communication to align with their collections goals and objectives. By identifying the right customers to contact (and through which channel) organizations can improve operational efficiency and recover more money: a bottom line affect on income.
IT
Help Desk Activity Analysis: Analyze the IT help desk tickets in your organization. See how long tickets have been open, what the average response time is, and understand what the key drivers are of high priority tickets to help determine how to allocate resources to resolve tickets faster.
Operations
Warranty Claims Analysis: Analyze returns and predict upcoming warranty costs and issues, as well as determine potential fraudulent warranty claims. Increase the effectiveness of claims and warranty departments by improving the bottom line, decreasing costs, and enhancing supplier relationships.
HR
Employee Retention: Provide insight into workforce and human resource issues. Human Resource analysts can uncover predictive factors driving employee attrition allowing you to intervene and take appropriate action.
What are the features of Watson Analytics
Self-service for Business Users
Watson Analytics removes the reliance on DBAs, Statisticians, Report Authors or other specialists to do analysis. Its intuitive interface and unique automation of data access and refinement, advanced analytics and visual storytelling empowers business users to do more by themselves, like having a Data Scientist in a Box. Start anywhere, and let your curiosity take you wherever you want to go. Watson Analytics suggests where you might want to go next, progressively exposing you to additional capabilities you might want to leverage to gain a deeper understanding of your business.
Differentiator
Business users want a consumer-like experience to use analytics and data to pursue ideas, get answers to all types of questions, make predictions, and communicate compelling recommendations without needing help from anyone. However, they are hampered by the usability of analytics tools, access to data and dependency on others – both IT to provide the infrastructure and data scientists to provide the analytical expertise. With Watson Analytics, data-driven decisions can now be an essential, daily and interesting activity for business people.
Data Discovery
Watson Analytics lets you visually explore and interact with your data to find the obvious patterns and derive useful insights.
Guided Analytic Discovery
Watson Analytics features the use of predictive analytics to surface the most relevant facts and uncover unforeseen patterns and relationships. This sparks the right questions to ask and directs your attention to the parts of their business that matter most.
Differentiator
Most discovery solutions expect you to decide what’s important in your data for further analysis. Watson Analytics lets you explore as well, but often business users aren’t sure what type of analysis would be the most meaningful. Watson Analytics automatically surfaces what matters most in your business. You can then use that insight to guide your analysis.
Cloud-based Agility
Watson Analytics is available anytime, anywhere on the cloud.
Mobile-ready
Watson Analytics is optimized for tablet devices for analysis on-the-go.
Natural Language Dialogue
Watson Analytics speaks the language of your business. Simply type in what you would like to see and Watson Analytics produces comprehensive results that explain why things happened and what's likely to happen, all in the familiar terms of your business. And as you interact with the results, you can continuously fine-tune your questions to get to the heart of the matter.
Differentiator
Other offerings expect you to adapt to the software – speaking in some form of programming language. Watson Analytics lets you carry on a natural, iterative dialog using the terms that are meaningful to your business.
What are the features of Watson Analytics
Single analytics experience
Watson Analytics brings together a complete set of self-service analytics capabilities on the cloud. You bring your problem, and Watson Analytics helps you acquire the data, cleanse it, discover insights, predict outcomes, visualize results, create reports or dashboards, and collaborate with others.
Differentiator
Unlike other offerings that make you decide what type of analytics you want to do, and then select separate tools to accomplish it, Watson Analytics is a seamless, unified experience that lets you go where your ideas take you. For example, you can move seamlessly from discovery to predictive analysis – without changing user interfaces or losing work.
Fully automated intelligence
Just bring your data, and Watson Analytics will do the rest. By automating all the steps of data preparation, predictive analytics, and visual storytelling, Watson Analytics jumpstarts your analysis and accelerates your time to value. It immediately starts you off with a visual story that illustrates what you need to know. Instead of fumbling over data or searching for answers, you can focus on understanding your business and effectively communicating results to stakeholders.
Differentiator
Most analytic offerings assume you have data ready for analysis, a clear idea of the type of analysis you want to do, and the skills and time to build a model for analysis. However, most business users have none of these things. Data prep and loading can represent 60% or more of the time in an analysis project. Business users can spend a lot of time figuring out what analysis would be relevant and how to tell the story in a report or diagram. Watson Analytics automates these steps to accelerate your ability to get to the answers you’re seeking.
Data Access & Refinement
Watson Analytics automatically shapes and joins data and then uniquely scores the readiness of your data for analysis, highlighting potential data issues that could compromise results....(access to data, data shaping, data quality/cleansing, data masking)
Integrated Social Business
Watson Analytics help you to quickly and securely build consensus around your data-driven analytical findings. Overcome analysis paralysis by collaborating with all stakeholders to share, discuss, combine and build the evidence necessary to move forward on decisions.
Reporting & Dashboarding
Watson Analytics takes the guesswork out of how to best show what's important in your data and automatically recommends the most effective visualization to convey the results you are looking for. With a few clicks, users can further alter chart types and data to fully customize the interactive reports and dashboards to meet the needs of the business.
Visual Storytelling
Watson Analytics helps users to quickly consolidate and annotate key visualizations into powerful infographics to elegantly and effectively convey results to stakeholders.
Learn more about IBM Watson Analytics at WatsonAnalytics.com. Visit the site to get started with Watson Analytics for free. Register to access Watson Analytics on the cloud. Watch demos and how to videos, read content and talk to our experts through our community forum.
Four key takeaway points:
Watson Analytics brings together a complete set of self-service analytics capabilities on the cloud. You bring your problem, and Watson Analytics helps you acquire the data, cleanse it, discover insights, predict outcomes, visualize results, create reports or dashboards, and collaborate with others.
Just bring your data, and Watson Analytics will do the rest. By automating all the steps of data access and refinement, predictive analytics, and visual storytelling, Watson Analytics jumpstarts your analysis and accelerates your time to value. It immediately starts you off with a visual story that illustrates what you need to know. Instead of fumbling over data or searching for answers, you can focus on understanding your business and effectively communicating results to stakeholders.
Watson Analytics speaks the language of your business. Simply type in what you would like to see and Watson Analytics produces comprehensive results that explain why things happened and what's likely to happen, all in the familiar terms of your business. And as you interact with the results, you can continuously fine-tune your questions to get to the heart of the matter.
Watson Analytics features the use of predictive analytics to surface the most relevant facts and uncover unforeseen patterns and relationships. This sparks the right questions to ask and directs your attention to the parts of their business that matter most.
Continue to flash forward, and we start to see a picture that depicts how Big Data technologies fit into an overall information architecture. Over 2013 and 2014 there were various flavors of this diagram which became known as the “Zones” diagram.
I’m sure you’ve all see this before and likely have presented it to customer and partners. Of course, there were the inevitable questions about what products fit into which boxes, so there were versions of these zone diagrams that overlayed products onto the zones.
Hadoop would be used for the Landing and Archive Zone, PureData, DB2, etc would be in the Warehouse and Mart Zones, Streams in real-time analytics. Etc.
The thing to note is that these zones diagrams evolved from how the new technologies were actually being implemented in organizations around the world.
If current data cleansing activities are highly manual, the ability to conduct repeatable and consistent cleansing is significantly reduced.
By introducing our Data Quality Framework which runs frequent automated routine of exactly the same data quality checks, exception management workload can be spread over the full year rather than be reactive.
There are business process impacts as in automating the running of reports every week, the stewards are now performing less data checks but more often. By having the DQF generating tasks through a task management system, its also possible to track and measure how long it takes to correct the data and provide the actual cost of data cleansing activities.
The biggest advantage of this is felt across both our internal and external impacts where Users running reports can be more confident in their accuracy as the timeliness of corrections is quicker. This means the provision of information is faster and lest costly for us to produce.