Download to read offline
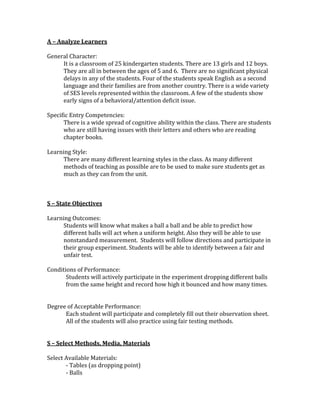
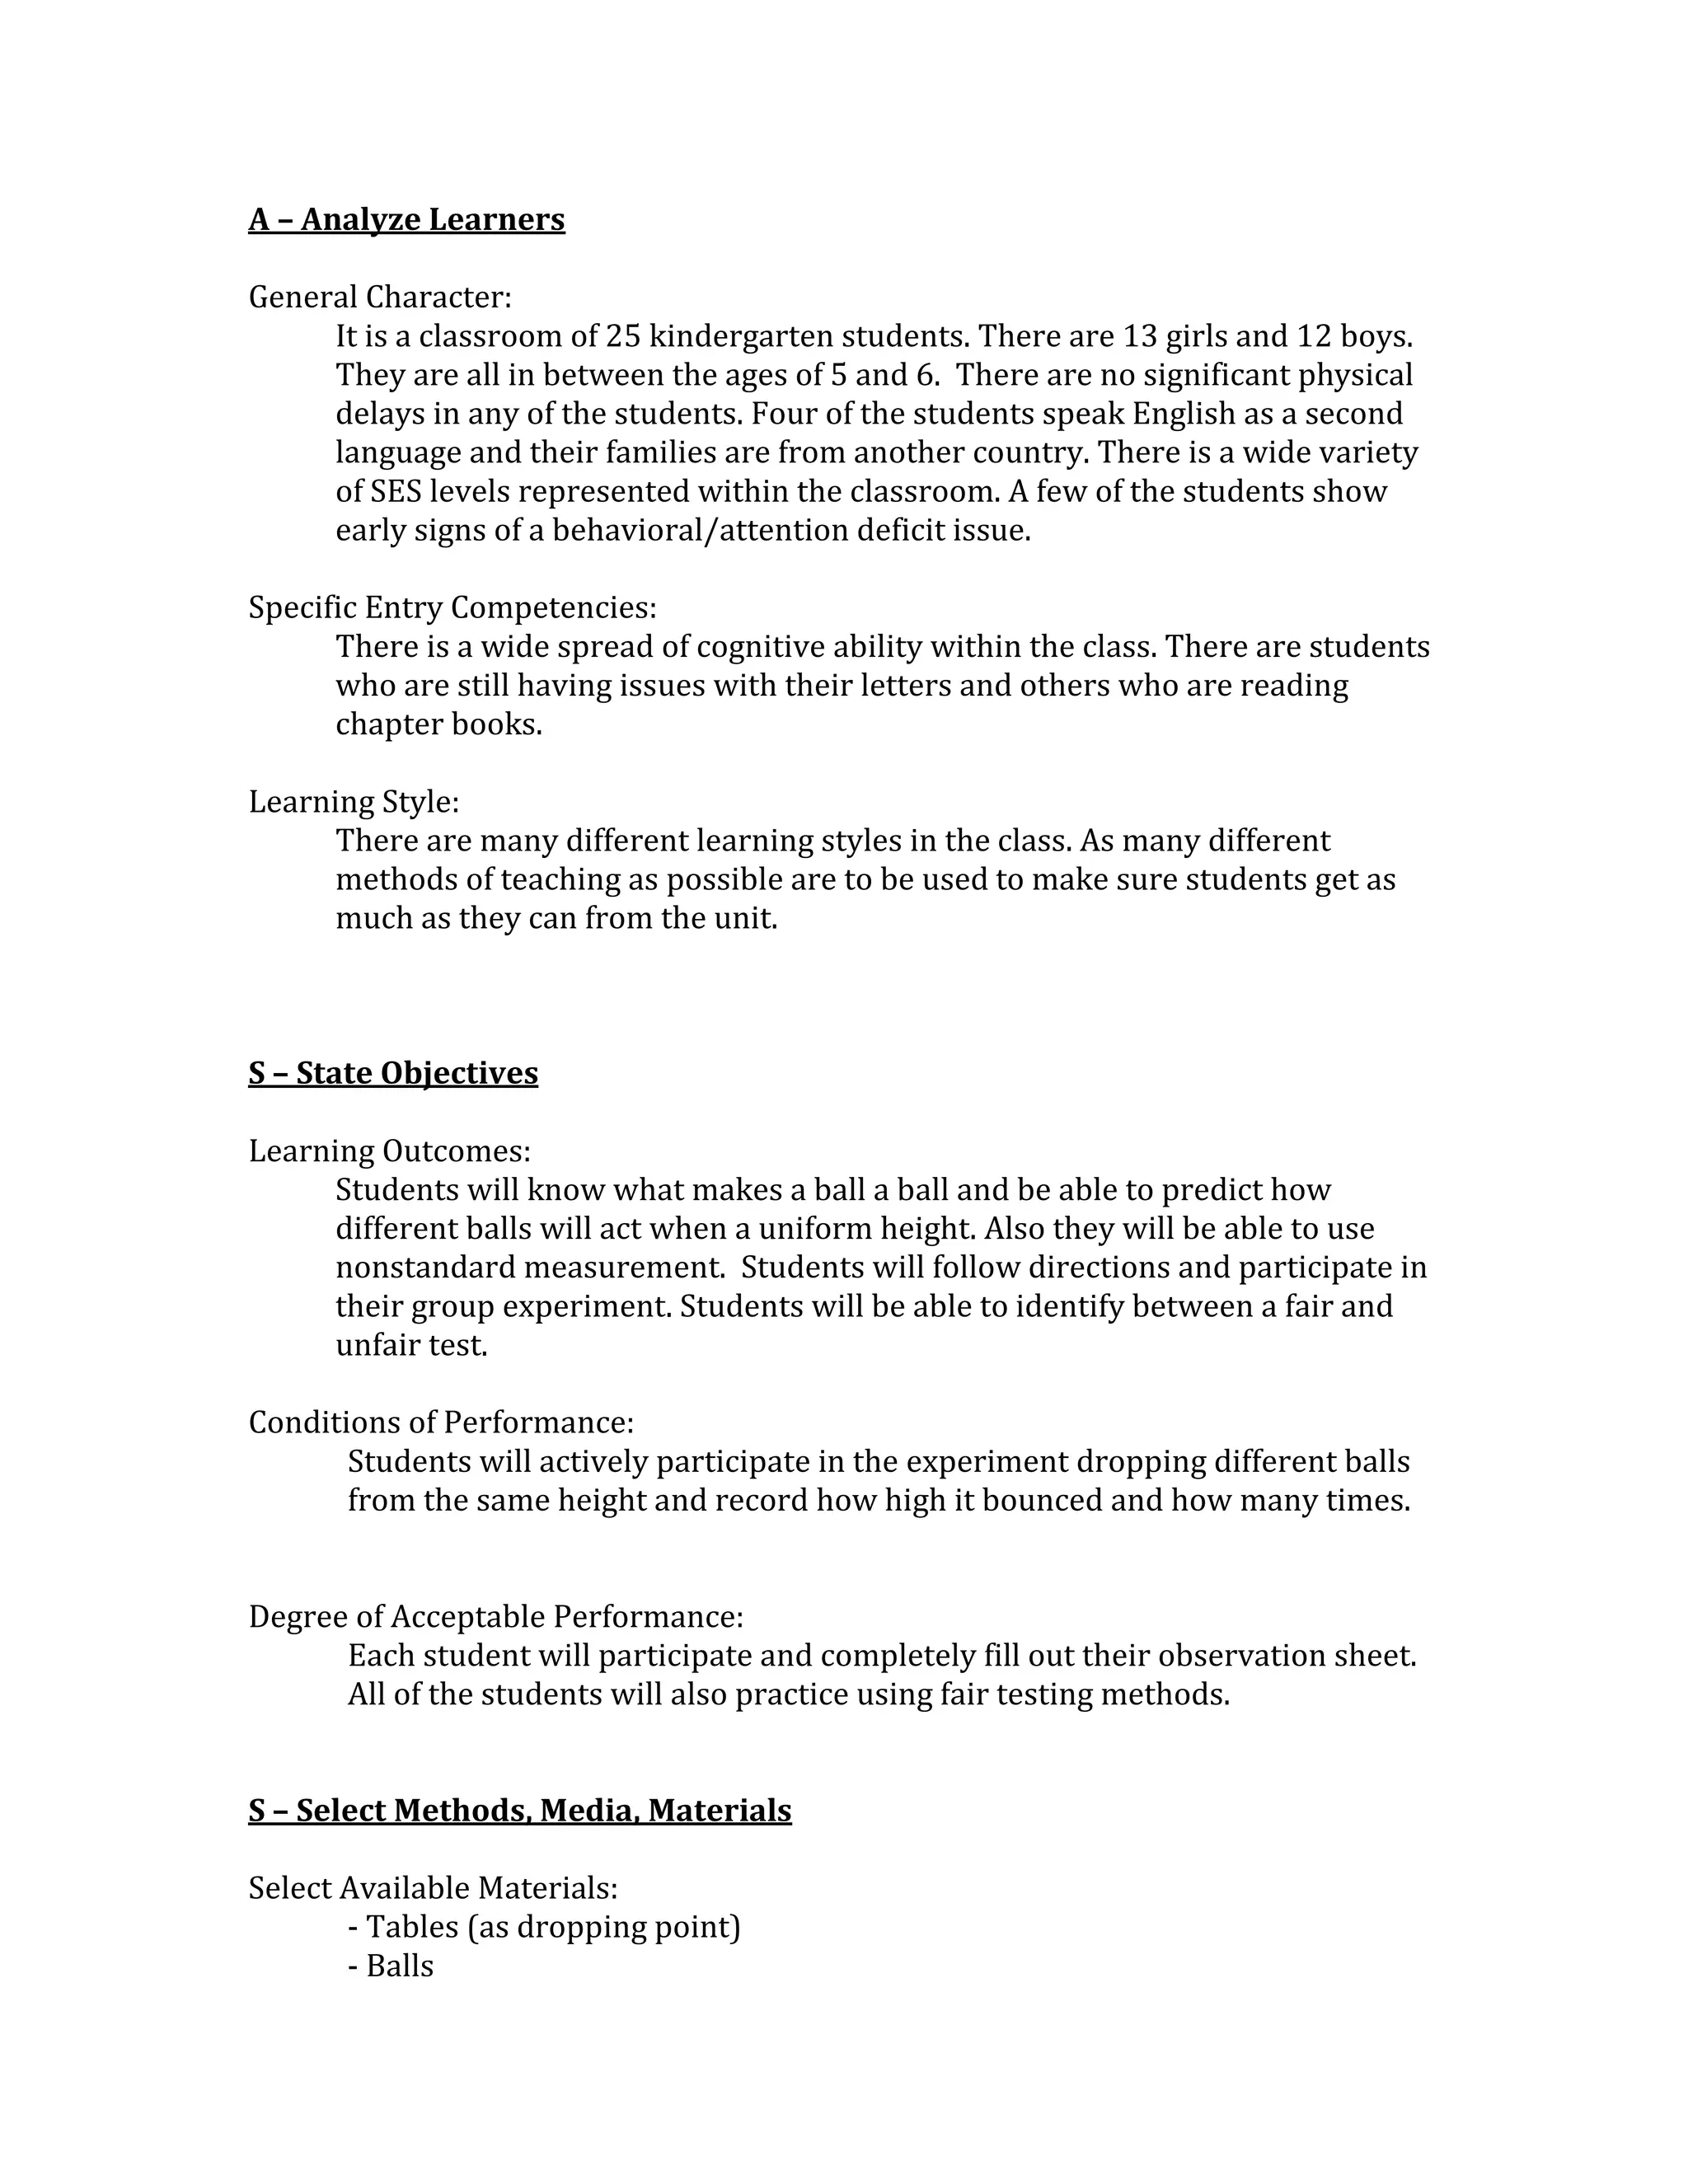
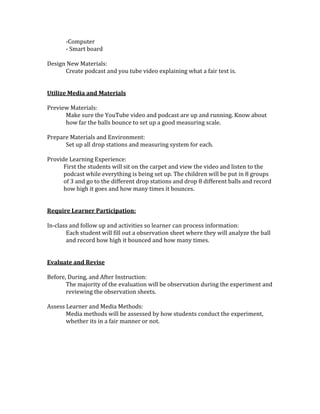

This document analyzes a classroom of 25 kindergarten students for a science lesson on balls. It notes there is diversity in gender, age, language, ability levels and learning styles among the students. The learning objective is for students to understand what makes a ball and how different balls bounce when dropped from the same height. Materials selected include balls, tables as drop points, a computer and smart board. A video and podcast will be used to explain fair testing methods. Students will be put into groups, watch the video, then conduct an experiment dropping different balls and recording bounce height and times on observation sheets. Their participation and sheets will be evaluated to assess learning and test fairness.