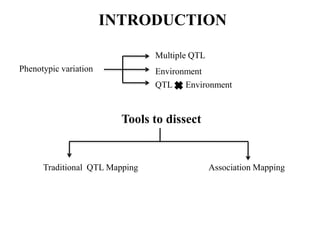
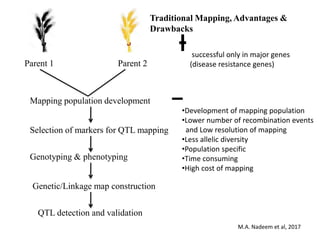
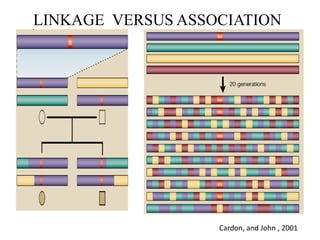
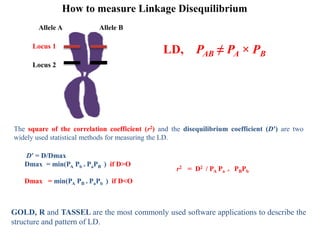
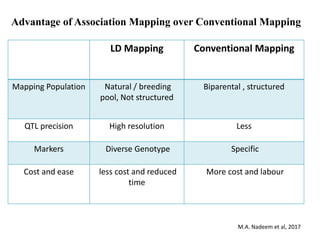
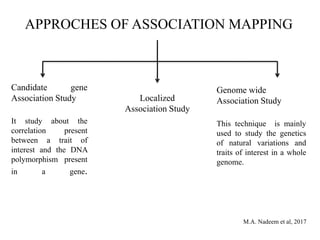
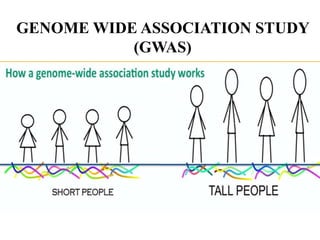
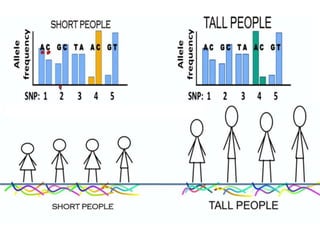
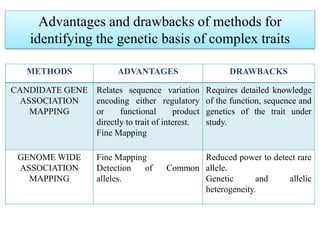
ASSOCIATION
MAPPING
Presented by – Hina Chaudhary
INTRODUCTION
Phenotypic variation
Multiple QTL
Environment
QTL Environment
Tools to dissect
Traditional QTL Mapping Association Mapping
Parent 1 Parent 2
Genetic/Linkage map construction
Mapping population development
Selection of markers for QTL mapping
Genotyping & phenotyping
QTL detection and validation
Traditional Mapping, Advantages &
Drawbacks
successful only in major genes
(disease resistance genes)
•Development of mapping population
•Lower number of recombination events
and Low resolution of mapping
•Less allelic diversity
•Population specific
•Time consuming
•High cost of mapping
M.A. Nadeem et al, 2017
LINKAGE VERSUS ASSOCIATION
Cardon, and John , 2001
ASSOCIATION MAPPING
Association mapping (AM) is significant association of molecular
markers with a phenotypic trait.
Statistically, it is an covariance between the polymorphism
present in the marker and the trait of interest
+ It is more time saving and provide greater mapping
resolution with a higher number of recombination events
M.A. Nadeem et al, 2017
LINKAGE DISEQUILIBRIUM based AM
Jennings, described the LD concept in 1917 and Lewtonin developed
quantification of LD in 1964.
Non random associations of allele at different loci is known as
Linkage Disequilibrium.
LD can be described as PAB ≠ PA × PB
LD, describes the non equal frequency of haplotypes in a population.
M.A. Nadeem et al, 2017
How to measure Linkage Disequilibrium
Allele A Allele B
Locus 1
Locus 2
LD, PAB ≠ PA × PB
The square of the correlation coefficient (r2) and the disequilibrium coefficient (D′) are two
widely used statistical methods for measuring the LD.
D′ = D/Dmax
Dmax = min(PA Pb * PaPB ) if D>O
Dmax = min(PA PB * PaPb ) if D<O
r2 = D2 / PA Pa * PBPb
GOLD, R and TASSEL are the most commonly used software applications to describe the
structure and pattern of LD.
Factors affecting Linkage Disequilibrium
New mutations, autogamy, epistasis, genetic isolation, population
size, selection, kinship and genomic rearrangements are responsible
for the increase in LD.
LD decreases with the higher rates of mutation, recombination,
gene conversion and recurrent mutations.
Advantage of Association Mapping over Conventional Mapping
LD Mapping Conventional Mapping
Mapping Population Natural / breeding
pool, Not structured
Biparental , structured
QTL precision High resolution Less
Markers Diverse Genotype Specific
Cost and ease less cost and reduced
time
More cost and labour
M.A. Nadeem et al, 2017
APPROCHES OF ASSOCIATION MAPPING
Candidate gene
Association Study
It study about the
correlation present
between a trait of
interest and the DNA
polymorphism present
in a gene.
Genome wide
Association Study
This technique is mainly
used to study the genetics
of natural variations and
traits of interest in a whole
genome.
M.A. Nadeem et al, 2017
Localized
Association Study
GENOME WIDE ASSOCIATION STUDY
(GWAS)
Manhattan Plot of GWAS results
Ikram,M.K et al , 2010
Zoom in on GWAS results
Ikram,M.K et al , 2010
Advantages and drawbacks of methods for
identifying the genetic basis of complex traits
METHODS ADVANTAGES DRAWBACKS
CANDIDATE GENE
ASSOCIATION
MAPPING
Relates sequence variation
encoding either regulatory
or functional product
directly to trait of interest.
Fine Mapping
Requires detailed knowledge
of the function, sequence and
genetics of the trait under
study.
GENOME WIDE
ASSOCIATION
MAPPING
Fine Mapping
Detection of Common
alleles.
Reduced power to detect rare
allele.
Genetic and allelic
heterogeneity.
Ikram, M. Kamran, et al. "Four novel Loci (19q13, 6q24, 12q24, and 5q14)
influence the microcirculation in vivo." PLoS genetics 6.10 (2010): e1001184.
Cardon, Lon R., and John I. Bell. "Association study designs for complex
diseases." Nature Reviews Genetics 2.2 (2001): 91.
Nadeem, Muhammad Azhar, et al. "DNA molecular markers in plant breeding:
current status and recent advancements in genomic selection and genome
editing." Biotechnology & Biotechnological Equipment 32.2 (2018): 261-285.
REFERENCES
Thank you

Association mapping

  • 1.
  • 2.
    INTRODUCTION Phenotypic variation Multiple QTL Environment QTLEnvironment Tools to dissect Traditional QTL Mapping Association Mapping
  • 3.
    Parent 1 Parent2 Genetic/Linkage map construction Mapping population development Selection of markers for QTL mapping Genotyping & phenotyping QTL detection and validation Traditional Mapping, Advantages & Drawbacks successful only in major genes (disease resistance genes) •Development of mapping population •Lower number of recombination events and Low resolution of mapping •Less allelic diversity •Population specific •Time consuming •High cost of mapping M.A. Nadeem et al, 2017
  • 4.
  • 5.
    ASSOCIATION MAPPING Association mapping(AM) is significant association of molecular markers with a phenotypic trait. Statistically, it is an covariance between the polymorphism present in the marker and the trait of interest + It is more time saving and provide greater mapping resolution with a higher number of recombination events M.A. Nadeem et al, 2017
  • 6.
    LINKAGE DISEQUILIBRIUM basedAM Jennings, described the LD concept in 1917 and Lewtonin developed quantification of LD in 1964. Non random associations of allele at different loci is known as Linkage Disequilibrium. LD can be described as PAB ≠ PA × PB LD, describes the non equal frequency of haplotypes in a population. M.A. Nadeem et al, 2017
  • 7.
    How to measureLinkage Disequilibrium Allele A Allele B Locus 1 Locus 2 LD, PAB ≠ PA × PB The square of the correlation coefficient (r2) and the disequilibrium coefficient (D′) are two widely used statistical methods for measuring the LD. D′ = D/Dmax Dmax = min(PA Pb * PaPB ) if D>O Dmax = min(PA PB * PaPb ) if D<O r2 = D2 / PA Pa * PBPb GOLD, R and TASSEL are the most commonly used software applications to describe the structure and pattern of LD.
  • 8.
    Factors affecting LinkageDisequilibrium New mutations, autogamy, epistasis, genetic isolation, population size, selection, kinship and genomic rearrangements are responsible for the increase in LD. LD decreases with the higher rates of mutation, recombination, gene conversion and recurrent mutations.
  • 9.
    Advantage of AssociationMapping over Conventional Mapping LD Mapping Conventional Mapping Mapping Population Natural / breeding pool, Not structured Biparental , structured QTL precision High resolution Less Markers Diverse Genotype Specific Cost and ease less cost and reduced time More cost and labour M.A. Nadeem et al, 2017
  • 10.
    APPROCHES OF ASSOCIATIONMAPPING Candidate gene Association Study It study about the correlation present between a trait of interest and the DNA polymorphism present in a gene. Genome wide Association Study This technique is mainly used to study the genetics of natural variations and traits of interest in a whole genome. M.A. Nadeem et al, 2017 Localized Association Study
  • 11.
  • 14.
    Manhattan Plot ofGWAS results Ikram,M.K et al , 2010
  • 15.
    Zoom in onGWAS results Ikram,M.K et al , 2010
  • 16.
    Advantages and drawbacksof methods for identifying the genetic basis of complex traits METHODS ADVANTAGES DRAWBACKS CANDIDATE GENE ASSOCIATION MAPPING Relates sequence variation encoding either regulatory or functional product directly to trait of interest. Fine Mapping Requires detailed knowledge of the function, sequence and genetics of the trait under study. GENOME WIDE ASSOCIATION MAPPING Fine Mapping Detection of Common alleles. Reduced power to detect rare allele. Genetic and allelic heterogeneity.
  • 17.
    Ikram, M. Kamran,et al. "Four novel Loci (19q13, 6q24, 12q24, and 5q14) influence the microcirculation in vivo." PLoS genetics 6.10 (2010): e1001184. Cardon, Lon R., and John I. Bell. "Association study designs for complex diseases." Nature Reviews Genetics 2.2 (2001): 91. Nadeem, Muhammad Azhar, et al. "DNA molecular markers in plant breeding: current status and recent advancements in genomic selection and genome editing." Biotechnology & Biotechnological Equipment 32.2 (2018): 261-285. REFERENCES
  • 18.