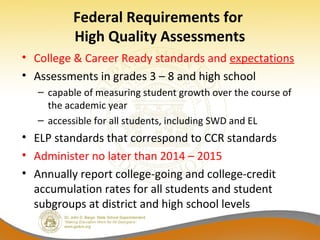
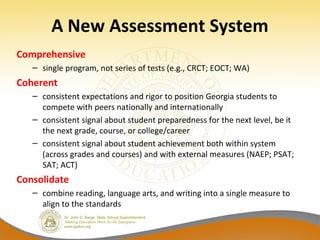
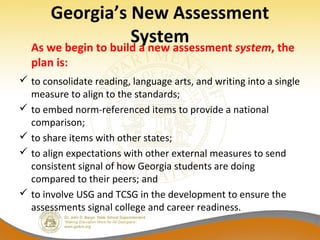
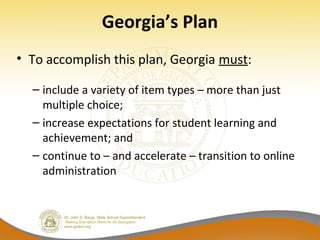
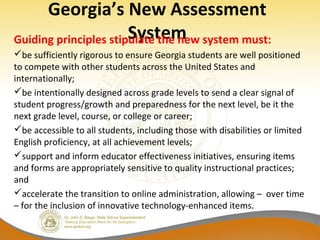
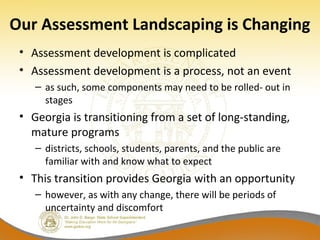
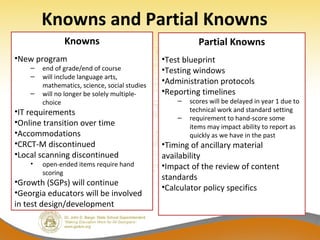
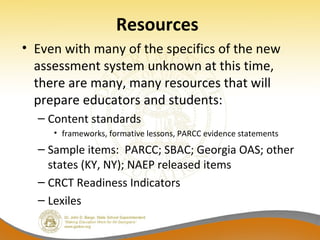
Assessment Update:
Georgia’s Changing Assessment Landscape
February 2014
Assessment Update
• This update pertains to anticipated changes to
Georgia’s Student Assessment Program for
the future.
– As more information and details become
available, we will follow-up to keep everyone
informed.
• Please Note: This update does not pertain to
assessments administered this school year.
Federal Requirements for
High Quality Assessments
• College & Career Ready standards and expectations
• Assessments in grades 3 – 8 and high school
– capable of measuring student growth over the course of
the academic year
– accessible for all students, including SWD and EL
• ELP standards that correspond to CCR standards
• Administer no later than 2014 – 2015
• Annually report college-going and college-credit
accumulation rates for all students and student
subgroups at district and high school levels
A New Assessment System
Comprehensive
– single program, not series of tests (e.g., CRCT; EOCT; WA)
Coherent
– consistent expectations and rigor to position Georgia students to
compete with peers nationally and internationally
– consistent signal about student preparedness for the next level, be it
the next grade, course, or college/career
– consistent signal about student achievement both within system
(across grades and courses) and with external measures (NAEP; PSAT;
SAT; ACT)
Consolidate
– combine reading, language arts, and writing into a single measure to
align to the standards
Coherency – Consistency
Achievement of Georgia Students in Mathematics
2013
•NAEP – Grade 8: 29% at/above proficient
•CRCT – Grade 8: 83% met/exceeded
•Coordinate Algebra EOCT: 37% met/exceeded
•SAT – Class of 2013: 42% college ready benchmark*
•ACT – Class of 2013: 38% college ready benchmark**
2012
•PSAT – sophomores: 37% on track to be CCR
*SAT data represent 71% of Class of 2013
**ACT data represent 51% of Class of 2013
Coherency – Consistency
Achievement of Georgia Students in Reading
2013
•NAEP – Grade 8: 32% at/above proficient
•CRCT – Grade 8: 97% met/exceeded
•9th
Grade Literature EOCT: 86% met/exceeded
•American Literature EOCT: 91% met/exceeded
•SAT – Class of 2013: 43% college ready benchmark*
•ACT – Class of 2013: 43% college ready benchmark**
2012
•PSAT – sophomores: 40% on track to be CCR
*SAT data represent 71% of Class of 2013
**ACT data represent 51% of Class of 2013
Georgia’s New Assessment
SystemAs we begin to build a new assessment system, the
plan is:
 to consolidate reading, language arts, and writing into a single
measure to align to the standards;
 to embed norm-referenced items to provide a national
comparison;
 to share items with other states;
 to align expectations with other external measures to send
consistent signal of how Georgia students are doing
compared to their peers; and
 to involve USG and TCSG in the development to ensure the
assessments signal college and career readiness.
Georgia’s Plan
• To accomplish this plan, Georgia must:
– include a variety of item types – more than just
multiple choice;
– increase expectations for student learning and
achievement; and
– continue to – and accelerate – transition to online
administration
Georgia’s New Assessment
SystemGuiding principles stipulate the new system must:
be sufficiently rigorous to ensure Georgia students are well positioned
to compete with other students across the United States and
internationally;
be intentionally designed across grade levels to send a clear signal of
student progress/growth and preparedness for the next level, be it the
next grade level, course, or college or career;
be accessible to all students, including those with disabilities or limited
English proficiency, at all achievement levels;
support and inform educator effectiveness initiatives, ensuring items
and forms are appropriately sensitive to quality instructional practices;
and
accelerate the transition to online administration, allowing – over time
– for the inclusion of innovative technology-enhanced items.
Our Assessment Landscaping is Changing
• Assessment development is complicated
• Assessment development is a process, not an event
– as such, some components may need to be rolled- out in
stages
• Georgia is transitioning from a set of long-standing,
mature programs
– districts, schools, students, parents, and the public are
familiar with and know what to expect
• This transition provides Georgia with an opportunity
– however, as with any change, there will be periods of
uncertainty and discomfort
Knowns and Partial Knowns
Knowns
•New program
‒ end of grade/end of course
‒ will include language arts,
mathematics, science, social studies
‒ will no longer be solely multiple-
choice
•IT requirements
•Online transition over time
•Accommodations
•CRCT-M discontinued
•Local scanning discontinued
• open-ended items require hand
scoring
•Growth (SGPs) will continue
•Georgia educators will be involved
in test design/development
Partial Knowns
•Test blueprint
•Testing windows
•Administration protocols
•Reporting timelines
‒ scores will be delayed in year 1 due to
technical work and standard setting
‒ requirement to hand-score some
items may impact ability to report as
quickly as we have in the past
•Timing of ancillary material
availability
•Impact of the review of content
standards
•Calculator policy specifics
Resources to Move Us Forward
Resources
• Even with many of the specifics of the new
assessment system unknown at this time,
there are many, many resources that will
prepare educators and students:
– Content standards
• frameworks, formative lessons, PARCC evidence statements
– Sample items: PARCC; SBAC; Georgia OAS; other
states (KY, NY); NAEP released items
– CRCT Readiness Indicators
– Lexiles
CRCT Readiness Indicators:
Reading, ELA, Mathematics
Indicators were designed to send a signal to
stakeholders about where students are relative to
where they need to be headed
Indicators provide feedback about our preparedness
for the increase in rigor and expectation for student
achievement that is on the horizon
Feedback consists of the percent of students who
achieved each readiness level – state , district, and
school levels – for instructional planning purposes
While we cannot guarantee that students who
achieve the On-Track level will be proficient on the
new assessment, we do know they will be better
prepared and positioned to be successful.
CRCT Readiness Indicators:
Reading, ELA, Mathematics
For instructional planning and decision making:
• Needs Additional Support: The student has
demonstrated that his or her command of the
knowledge and skills described in the CCGPS warrants
additional instructional supports.
• On Track: The student has demonstrated that his or
her command of the knowledge and skills described in
the CCGPS is sufficient; the student is on track for
success at the next level.
• Commendable: The student has demonstrated that his
or her command of the knowledge and skills described
in the CCGPS is exemplary.
CRCT Readiness Indicators:
Reading, ELA, Mathematics
• For accountability purposes - at the student (promotion/retention),
school, district, and state levels (CCRPI) - we will continue to use 800
and 850 for the 2013-2014 school year.
• It is strongly advised, however, that schools use the scale scores
associated with the Readiness Indicators as targets - we need to be
working actively to get students to these levels because we believe the
new tests will be more in line with those expectations than the 800 /
850.
• The readiness indicators will be provided during the interim as
additional feedback to districts and schools so they have "better"
information about where students are in relation to where they need to
be in 2014-2015 (with the increased rigor).
√ Bottom line: shooting for 800 isn't going to be sufficient in future years.
16
Lexiles
Lexiles
Lexiles
Lexiles with
CRCT Readiness Indicators
Lexiles
Grade
3
Grade
4
Grade
5
Grade
6
Grade
7
Grade
8
Common Core Stretch Text –
Lower Limit
520 740 830 925 970 1010
Common Core Stretch Text –
Upper Limit
820 940 1010 1070 1120 1185
On Track 625 775 845 930 970 1070
Commendable 890 990 1085 1155 1210 1265
Reader – Lower Limit 330 445 565 665 735 805
Reader – Upper Limit 700 810 910 1000 1065 1100
2013 Median 790 860 940 1070 1095 1210
Formative Assessment Initiatives
Bringing a Balanced Assessment Focus to the Classroom
1600 new
items loaded
Statewide launch
in summer 2013
Phase I available
February 2014; Phase
II pilot in winter 2014
Key Findings from Pilots of Formative
Open-Ended Items
• Overall performance shortfalls
– Students are not familiar with these types of items
• Many respond “dnk” – as in ‘do not know’
• Don’t know how to approach the items or how to organize
(show) their responses/answers
– Don’t seem to understand the need to “show” their work,
detail their thoughts, rationales, cite evidence to support
their answer or claim
• Tendency is to cite answer only – as if they were multiple-choice
items
– Don’t read careful and answer all parts
– Didn’t answer all parts of questions or label appropriately
Overall ELA Phase I Pilot Summary Data
Grade
Number and Percent of Students Achieving Each Score Point
Total student
N/ %
0 1 2 3 4
3 475 1613 713 202 45 3048
15.60% 52.90% 23.40% 6.60% 1.50% 100%
4 323 1518 814 199 83 2937
11.00% 51.70% 27.70% 6.80% 2.80% 100%
5 367 1100 901 518 125 3011
12.20% 36.50% 29.90% 17.20% 4.20% 100%
6 155 960 811 418 111 2455
6.30% 39.10% 33.00% 17.00% 4.50% 100%
7 218 1387 1275 617 146 3643
6.00% 38.10% 35.00% 16.90% 4.00% 100%
8 264 1140 1029 338 89 2860
9.20% 39.90% 36.00% 11.80% 3.10% 100%
9 - 10 175 1016 783 361 81 2416
7.20% 42.10% 32.40% 14.90% 3.40% 100%
11 - 12 376 1018 763 196 46 2399
15.70% 42.40% 31.80% 8.20% 1.90% 100%
Overall ELA Phase II Pilot Summary Data
Grade
Number and Percent of Students Achieving
Each Score Point
Total Student N/
%0 1 2 3 4
3 812 1107 762 174 26 2881
28.18% 38.42% 26.45% 6.04% 0.90% 100%
4 906 1145 765 168 63 3047
29.73% 37.58% 25.11% 5.51% 2.07% 100%
5 839 948 1294 537 183 3801
22.07% 24.94% 34.04% 14.13% 4.81% 100%
6 626 1467 1028 408 86 3615
17.32% 40.58% 28.44% 11.29% 2.38% 100%
7 695 1002 1035 515 140 3387
20.52% 29.58% 30.56% 15.21% 4.13% 100%
8 1116 1534 827 391 80 3948
28.27% 38.86% 20.95% 9.90% 2.03% 100%
9 - 10 1262 1816 559 106 9 3752
33.64% 48.40% 14.90% 2.83% 0.24% 100%
11 - 12 739 1389 1175 388 131 3822
19.34% 36.34% 30.74% 10.15% 3.43% 100%
Overall Mathematics Phase I Pilot
Summary Data
Grade
Number and Percent of Students Achieving Each Score Point Total student
N/ %
  0 1 2 3 4  
3 771 667 373 81 36 1928
40.00% 34.60% 19.30% 4.20% 1.90% 100%
4 795 800 360 87 58 2100
37.90% 38.10% 17.10% 4.10% 2.80% 100%
5 548 513 252 124 44 1481
37.00% 34.60% 17.00% 8.40% 3.00% 100%
6 927 768 269 65 14 2043
45.40% 37.60% 13.20% 3.20% 0.70% 100%
7 896 632 243 62 11 1844
48.60% 34.30% 13.20% 3.40% 0.60% 100%
8 984 791 314 100 51 2240
43.90% 35.30% 14.00% 4.50% 2.30% 100%
9-10 798 697 186 45 27 1753
45.50% 39.80% 10.60% 2.60% 1.50% 100%
11-12 690 602 178 63 9 1542
  44.70% 39.00% 11.50% 4.10% 0.60% 100%
Overall Mathematics Phase II Pilot
Summary Data
Grade
Number and Percent of Students Achieving
Each Score Point
Total Student
N / %0 1 2 3 4
3 1378 1152 539 121 47 3237
42.57% 35.59% 16.65% 3.74% 1.45% 100%
4 1323 1264 325 83 25 3020
43.81% 41.85% 10.76% 2.75% 0.83% 100%
5 1351 1049 391 64 15 2870
47.07% 36.55% 13.62% 2.23% 0.52% 100%
6 1579 1171 370 135 53 3308
47.73% 35.40% 11.19% 4.08% 1.60% 100%
7 1602 856 219 72 36 2785
57.52% 30.74% 7.86% 2.59% 1.29% 100%
8 1529 1049 619 217 88 3502
43.66% 29.95% 17.68% 6.20% 2.51% 100%
9 - 12 2570 1435 299 59 23 4386
58.60% 32.72% 6.82% 1.35% 0.52% 100%
• ELA 
– Grades 1, 2, 3, 6, 7, 8, 
and 10
• Mathematics 
– Grades 1, 2, 3, and 
Coordinate Algebra
• U.S. History
• ELA 
– Grades 4, 5, 9, and 11
• Mathematics 
– Grades 4, 5, 6, 7, 8, 
Analytic Geometry, and 
Advanced Algebra
• Biology
Benchmark Assessment
Implementation Schedule
Phase I
Fall 2013 pilot
Available Winter 2014
Phase II
Winter 2014 pilot
Available Fall 2014
FIP Learning Modules
1. Introduction to Formative Instructional Practices
2. Clear Learning Targets
3. Collecting and Documenting Evidence of Student Learning
4. Analyzing Evidence and Providing Effective Feedback
5. Student Ownership of Learning: Peer Feedback,
Self-Assessment, and More
6. Leading Formative Instructional Practices (for district
and/or school leaders)
7. Coaching Formative Instructional Practices (for instructional
coaches and/or teacher leaders)
NAEP Item Tool
29
 
Workshops Available:
Bobbie Bable, NAEP State Coordinator
(404.657.6168; bbable@doe.k12.ga.us)
Assessment Update
• In closing – as a reminder:
– This update pertains to anticipated changes to 
Georgia’s Student Assessment Program for the 
future.
• As more information and details become available, we 
will follow-up to keep everyone informed.
– Please Note:  This update does not pertain to 
assessments administered this school year.

Assessment update february 2014

  • 1.
    Assessment Update: Georgia’s ChangingAssessment Landscape February 2014
  • 2.
    Assessment Update • Thisupdate pertains to anticipated changes to Georgia’s Student Assessment Program for the future. – As more information and details become available, we will follow-up to keep everyone informed. • Please Note: This update does not pertain to assessments administered this school year.
  • 3.
    Federal Requirements for HighQuality Assessments • College & Career Ready standards and expectations • Assessments in grades 3 – 8 and high school – capable of measuring student growth over the course of the academic year – accessible for all students, including SWD and EL • ELP standards that correspond to CCR standards • Administer no later than 2014 – 2015 • Annually report college-going and college-credit accumulation rates for all students and student subgroups at district and high school levels
  • 4.
    A New AssessmentSystem Comprehensive – single program, not series of tests (e.g., CRCT; EOCT; WA) Coherent – consistent expectations and rigor to position Georgia students to compete with peers nationally and internationally – consistent signal about student preparedness for the next level, be it the next grade, course, or college/career – consistent signal about student achievement both within system (across grades and courses) and with external measures (NAEP; PSAT; SAT; ACT) Consolidate – combine reading, language arts, and writing into a single measure to align to the standards
  • 5.
    Coherency – Consistency Achievementof Georgia Students in Mathematics 2013 •NAEP – Grade 8: 29% at/above proficient •CRCT – Grade 8: 83% met/exceeded •Coordinate Algebra EOCT: 37% met/exceeded •SAT – Class of 2013: 42% college ready benchmark* •ACT – Class of 2013: 38% college ready benchmark** 2012 •PSAT – sophomores: 37% on track to be CCR *SAT data represent 71% of Class of 2013 **ACT data represent 51% of Class of 2013
  • 6.
    Coherency – Consistency Achievementof Georgia Students in Reading 2013 •NAEP – Grade 8: 32% at/above proficient •CRCT – Grade 8: 97% met/exceeded •9th Grade Literature EOCT: 86% met/exceeded •American Literature EOCT: 91% met/exceeded •SAT – Class of 2013: 43% college ready benchmark* •ACT – Class of 2013: 43% college ready benchmark** 2012 •PSAT – sophomores: 40% on track to be CCR *SAT data represent 71% of Class of 2013 **ACT data represent 51% of Class of 2013
  • 7.
    Georgia’s New Assessment SystemAswe begin to build a new assessment system, the plan is:  to consolidate reading, language arts, and writing into a single measure to align to the standards;  to embed norm-referenced items to provide a national comparison;  to share items with other states;  to align expectations with other external measures to send consistent signal of how Georgia students are doing compared to their peers; and  to involve USG and TCSG in the development to ensure the assessments signal college and career readiness.
  • 8.
    Georgia’s Plan • Toaccomplish this plan, Georgia must: – include a variety of item types – more than just multiple choice; – increase expectations for student learning and achievement; and – continue to – and accelerate – transition to online administration
  • 9.
    Georgia’s New Assessment SystemGuidingprinciples stipulate the new system must: be sufficiently rigorous to ensure Georgia students are well positioned to compete with other students across the United States and internationally; be intentionally designed across grade levels to send a clear signal of student progress/growth and preparedness for the next level, be it the next grade level, course, or college or career; be accessible to all students, including those with disabilities or limited English proficiency, at all achievement levels; support and inform educator effectiveness initiatives, ensuring items and forms are appropriately sensitive to quality instructional practices; and accelerate the transition to online administration, allowing – over time – for the inclusion of innovative technology-enhanced items.
  • 10.
    Our Assessment Landscapingis Changing • Assessment development is complicated • Assessment development is a process, not an event – as such, some components may need to be rolled- out in stages • Georgia is transitioning from a set of long-standing, mature programs – districts, schools, students, parents, and the public are familiar with and know what to expect • This transition provides Georgia with an opportunity – however, as with any change, there will be periods of uncertainty and discomfort
  • 11.
    Knowns and PartialKnowns Knowns •New program ‒ end of grade/end of course ‒ will include language arts, mathematics, science, social studies ‒ will no longer be solely multiple- choice •IT requirements •Online transition over time •Accommodations •CRCT-M discontinued •Local scanning discontinued • open-ended items require hand scoring •Growth (SGPs) will continue •Georgia educators will be involved in test design/development Partial Knowns •Test blueprint •Testing windows •Administration protocols •Reporting timelines ‒ scores will be delayed in year 1 due to technical work and standard setting ‒ requirement to hand-score some items may impact ability to report as quickly as we have in the past •Timing of ancillary material availability •Impact of the review of content standards •Calculator policy specifics
  • 12.
  • 13.
    Resources • Even withmany of the specifics of the new assessment system unknown at this time, there are many, many resources that will prepare educators and students: – Content standards • frameworks, formative lessons, PARCC evidence statements – Sample items: PARCC; SBAC; Georgia OAS; other states (KY, NY); NAEP released items – CRCT Readiness Indicators – Lexiles
  • 14.
    CRCT Readiness Indicators: Reading,ELA, Mathematics Indicators were designed to send a signal to stakeholders about where students are relative to where they need to be headed Indicators provide feedback about our preparedness for the increase in rigor and expectation for student achievement that is on the horizon Feedback consists of the percent of students who achieved each readiness level – state , district, and school levels – for instructional planning purposes While we cannot guarantee that students who achieve the On-Track level will be proficient on the new assessment, we do know they will be better prepared and positioned to be successful.
  • 15.
    CRCT Readiness Indicators: Reading,ELA, Mathematics For instructional planning and decision making: • Needs Additional Support: The student has demonstrated that his or her command of the knowledge and skills described in the CCGPS warrants additional instructional supports. • On Track: The student has demonstrated that his or her command of the knowledge and skills described in the CCGPS is sufficient; the student is on track for success at the next level. • Commendable: The student has demonstrated that his or her command of the knowledge and skills described in the CCGPS is exemplary.
  • 16.
    CRCT Readiness Indicators: Reading,ELA, Mathematics • For accountability purposes - at the student (promotion/retention), school, district, and state levels (CCRPI) - we will continue to use 800 and 850 for the 2013-2014 school year. • It is strongly advised, however, that schools use the scale scores associated with the Readiness Indicators as targets - we need to be working actively to get students to these levels because we believe the new tests will be more in line with those expectations than the 800 / 850. • The readiness indicators will be provided during the interim as additional feedback to districts and schools so they have "better" information about where students are in relation to where they need to be in 2014-2015 (with the increased rigor). √ Bottom line: shooting for 800 isn't going to be sufficient in future years. 16
  • 17.
  • 18.
  • 19.
  • 20.
    Lexiles with CRCT ReadinessIndicators Lexiles Grade 3 Grade 4 Grade 5 Grade 6 Grade 7 Grade 8 Common Core Stretch Text – Lower Limit 520 740 830 925 970 1010 Common Core Stretch Text – Upper Limit 820 940 1010 1070 1120 1185 On Track 625 775 845 930 970 1070 Commendable 890 990 1085 1155 1210 1265 Reader – Lower Limit 330 445 565 665 735 805 Reader – Upper Limit 700 810 910 1000 1065 1100 2013 Median 790 860 940 1070 1095 1210
  • 21.
    Formative Assessment Initiatives Bringinga Balanced Assessment Focus to the Classroom 1600 new items loaded Statewide launch in summer 2013 Phase I available February 2014; Phase II pilot in winter 2014
  • 22.
    Key Findings fromPilots of Formative Open-Ended Items • Overall performance shortfalls – Students are not familiar with these types of items • Many respond “dnk” – as in ‘do not know’ • Don’t know how to approach the items or how to organize (show) their responses/answers – Don’t seem to understand the need to “show” their work, detail their thoughts, rationales, cite evidence to support their answer or claim • Tendency is to cite answer only – as if they were multiple-choice items – Don’t read careful and answer all parts – Didn’t answer all parts of questions or label appropriately
  • 23.
    Overall ELA PhaseI Pilot Summary Data Grade Number and Percent of Students Achieving Each Score Point Total student N/ % 0 1 2 3 4 3 475 1613 713 202 45 3048 15.60% 52.90% 23.40% 6.60% 1.50% 100% 4 323 1518 814 199 83 2937 11.00% 51.70% 27.70% 6.80% 2.80% 100% 5 367 1100 901 518 125 3011 12.20% 36.50% 29.90% 17.20% 4.20% 100% 6 155 960 811 418 111 2455 6.30% 39.10% 33.00% 17.00% 4.50% 100% 7 218 1387 1275 617 146 3643 6.00% 38.10% 35.00% 16.90% 4.00% 100% 8 264 1140 1029 338 89 2860 9.20% 39.90% 36.00% 11.80% 3.10% 100% 9 - 10 175 1016 783 361 81 2416 7.20% 42.10% 32.40% 14.90% 3.40% 100% 11 - 12 376 1018 763 196 46 2399 15.70% 42.40% 31.80% 8.20% 1.90% 100%
  • 24.
    Overall ELA PhaseII Pilot Summary Data Grade Number and Percent of Students Achieving Each Score Point Total Student N/ %0 1 2 3 4 3 812 1107 762 174 26 2881 28.18% 38.42% 26.45% 6.04% 0.90% 100% 4 906 1145 765 168 63 3047 29.73% 37.58% 25.11% 5.51% 2.07% 100% 5 839 948 1294 537 183 3801 22.07% 24.94% 34.04% 14.13% 4.81% 100% 6 626 1467 1028 408 86 3615 17.32% 40.58% 28.44% 11.29% 2.38% 100% 7 695 1002 1035 515 140 3387 20.52% 29.58% 30.56% 15.21% 4.13% 100% 8 1116 1534 827 391 80 3948 28.27% 38.86% 20.95% 9.90% 2.03% 100% 9 - 10 1262 1816 559 106 9 3752 33.64% 48.40% 14.90% 2.83% 0.24% 100% 11 - 12 739 1389 1175 388 131 3822 19.34% 36.34% 30.74% 10.15% 3.43% 100%
  • 25.
    Overall Mathematics PhaseI Pilot Summary Data Grade Number and Percent of Students Achieving Each Score Point Total student N/ %   0 1 2 3 4   3 771 667 373 81 36 1928 40.00% 34.60% 19.30% 4.20% 1.90% 100% 4 795 800 360 87 58 2100 37.90% 38.10% 17.10% 4.10% 2.80% 100% 5 548 513 252 124 44 1481 37.00% 34.60% 17.00% 8.40% 3.00% 100% 6 927 768 269 65 14 2043 45.40% 37.60% 13.20% 3.20% 0.70% 100% 7 896 632 243 62 11 1844 48.60% 34.30% 13.20% 3.40% 0.60% 100% 8 984 791 314 100 51 2240 43.90% 35.30% 14.00% 4.50% 2.30% 100% 9-10 798 697 186 45 27 1753 45.50% 39.80% 10.60% 2.60% 1.50% 100% 11-12 690 602 178 63 9 1542   44.70% 39.00% 11.50% 4.10% 0.60% 100%
  • 26.
    Overall Mathematics PhaseII Pilot Summary Data Grade Number and Percent of Students Achieving Each Score Point Total Student N / %0 1 2 3 4 3 1378 1152 539 121 47 3237 42.57% 35.59% 16.65% 3.74% 1.45% 100% 4 1323 1264 325 83 25 3020 43.81% 41.85% 10.76% 2.75% 0.83% 100% 5 1351 1049 391 64 15 2870 47.07% 36.55% 13.62% 2.23% 0.52% 100% 6 1579 1171 370 135 53 3308 47.73% 35.40% 11.19% 4.08% 1.60% 100% 7 1602 856 219 72 36 2785 57.52% 30.74% 7.86% 2.59% 1.29% 100% 8 1529 1049 619 217 88 3502 43.66% 29.95% 17.68% 6.20% 2.51% 100% 9 - 12 2570 1435 299 59 23 4386 58.60% 32.72% 6.82% 1.35% 0.52% 100%
  • 27.
    • ELA  – Grades 1, 2, 3, 6, 7, 8,  and 10 •Mathematics  – Grades 1, 2, 3, and  Coordinate Algebra • U.S. History • ELA  – Grades 4, 5, 9, and 11 • Mathematics  – Grades 4, 5, 6, 7, 8,  Analytic Geometry, and  Advanced Algebra • Biology Benchmark Assessment Implementation Schedule Phase I Fall 2013 pilot Available Winter 2014 Phase II Winter 2014 pilot Available Fall 2014
  • 28.
    FIP Learning Modules 1.Introduction to Formative Instructional Practices 2. Clear Learning Targets 3. Collecting and Documenting Evidence of Student Learning 4. Analyzing Evidence and Providing Effective Feedback 5. Student Ownership of Learning: Peer Feedback, Self-Assessment, and More 6. Leading Formative Instructional Practices (for district and/or school leaders) 7. Coaching Formative Instructional Practices (for instructional coaches and/or teacher leaders)
  • 29.
    NAEP Item Tool 29   WorkshopsAvailable: Bobbie Bable, NAEP State Coordinator (404.657.6168; bbable@doe.k12.ga.us)
  • 30.
    Assessment Update • In closing – as a reminder: –This update pertains to anticipated changes to  Georgia’s Student Assessment Program for the  future. • As more information and details become available, we  will follow-up to keep everyone informed. – Please Note:  This update does not pertain to  assessments administered this school year.