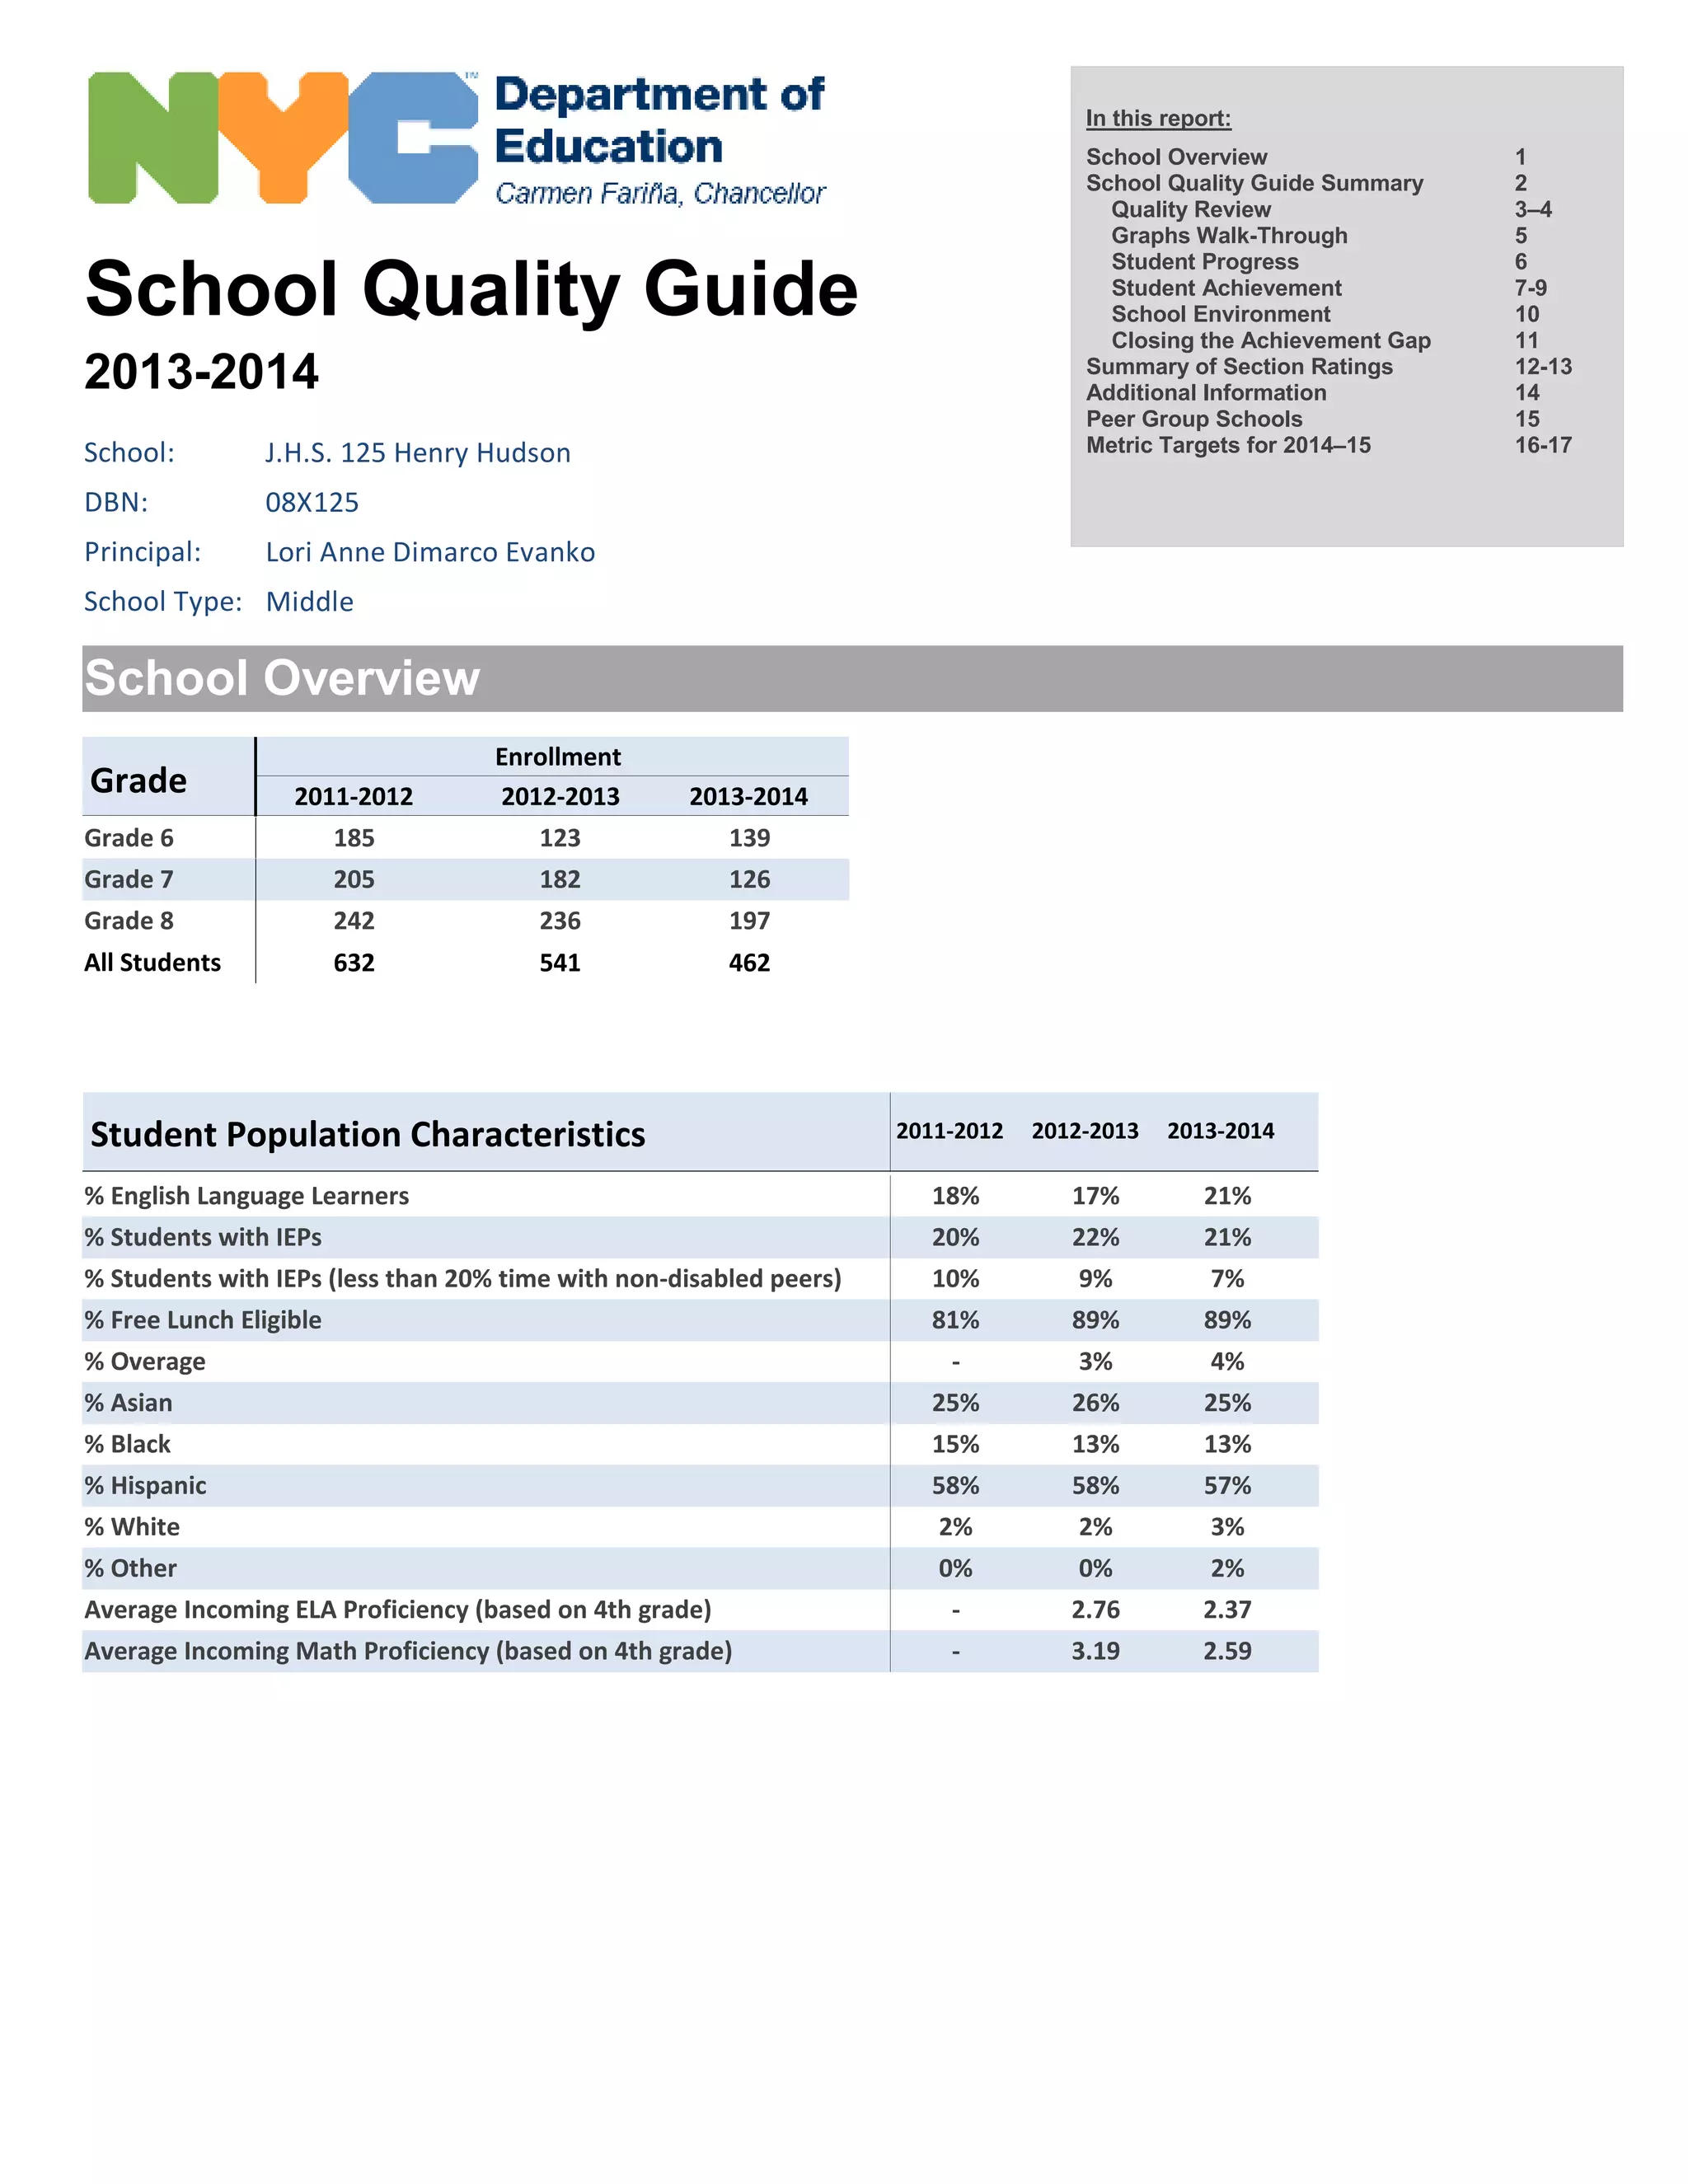
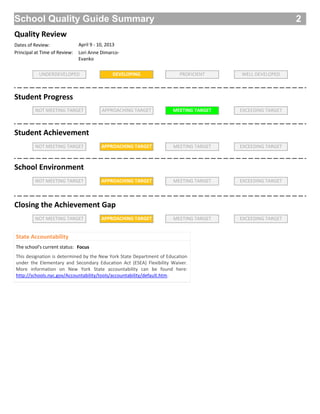
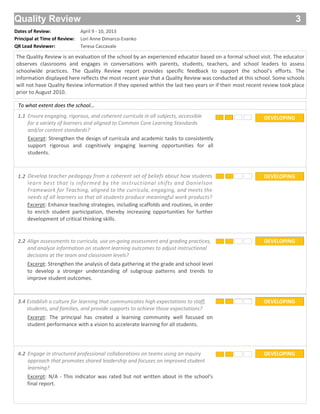
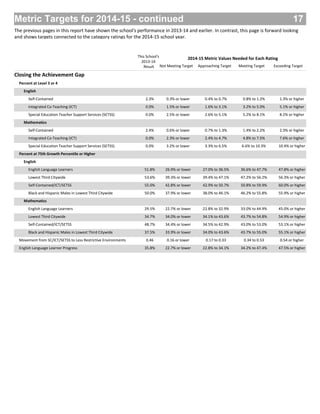
School Quality Guide
2013-2014
School Overview
School: J.H.S. 125 Henry Hudson
DBN: 08X125
Principal: Lori Anne Dimarco Evanko
School Type: Middle
Grade
Enrollment
2011-2012 2012-2013 2013-2014
Student Population Characteristics 2011-2012 2012-2013 2013-2014
In this report:
School Overview 1
School Quality Guide Summary 2
Quality Review 3–4
Graphs Walk-Through 5
Student Progress 6
Student Achievement 7-9
School Environment 10
Closing the Achievement Gap 11
Summary of Section Ratings 12-13
Additional Information 14
Peer Group Schools 15
Metric Targets for 2014–15 16-17
Grade 6 185 123 139
Grade 7 205 182 126
Grade 8 242 236 197
632 541 462All Students
% English Language Learners 18% 17% 21%
% Students with IEPs 20% 22% 21%
% Students with IEPs (less than 20% time with non-disabled peers) 10% 9% 7%
% Free Lunch Eligible 81% 89% 89%
% Overage - 3% 4%
% Asian 25% 26% 25%
% Black 15% 13% 13%
% Hispanic 58% 58% 57%
% White 2% 2% 3%
% Other 0% 0% 2%
Average Incoming ELA Proficiency (based on 4th grade) - 2.76 2.37
Average Incoming Math Proficiency (based on 4th grade) - 3.19 2.59
School Quality Guide Summary
Quality Review
Student Progress
Student Achievement
School Environment
Closing the Achievement Gap
Dates of Review: April 9 - 10, 2013
Principal at Time of Review: Lori Anne Dimarco-
Evanko
UNDERDEVELOPED DEVELOPING PROFICIENT WELL DEVELOPED
NOT MEETING TARGET APPROACHING TARGET MEETING TARGET EXCEEDING TARGET
State Accountability
The school's current status: Focus
This designation is determined by the New York State Department of Education
under the Elementary and Secondary Education Act (ESEA) Flexibility Waiver.
More information on New York State accountability can be found here:
http://schools.nyc.gov/Accountability/tools/accountability/default.htm.
2
Quality Review 3
QR Lead Reviewer: Teresa Caccavale
Dates of Review: April 9 - 10, 2013
Principal at Time of Review: Lori Anne Dimarco-Evanko
To what extent does the school...
Ensure engaging, rigorous, and coherent curricula in all subjects, accessible
for a variety of learners and aligned to Common Core Learning Standards
and/or content standards?
Develop teacher pedagogy from a coherent set of beliefs about how students
learn best that is informed by the instructional shifts and Danielson
Framework for Teaching, aligned to the curricula, engaging, and meets the
needs of all learners so that all students produce meaningful work products?
1.1
1.2
2.2
Excerpt: Strengthen the design of curricula and academic tasks to consistently
support rigorous and cognitively engaging learning opportunities for all
students.
Excerpt: Enhance teaching strategies, including scaffolds and routines, in order
to enrich student participation, thereby increasing opportunities for further
development of critical thinking skills.
Excerpt: Strengthen the analysis of data gathering at the grade and school level
to develop a stronger understanding of subgroup patterns and trends to
improve student outcomes.
DEVELOPING
DEVELOPING
DEVELOPING
The Quality Review is an evaluation of the school by an experienced educator based on a formal school visit. The educator
observes classrooms and engages in conversations with parents, students, teachers, and school leaders to assess
schoolwide practices. The Quality Review report provides specific feedback to support the school’s efforts. The
information displayed here reflects the most recent year that a Quality Review was conducted at this school. Some schools
will not have Quality Review information if they opened within the last two years or if their most recent review took place
prior to August 2010.
3.4
Excerpt: The principal has created a learning community well focused on
student performance with a vision to accelerate learning for all students.
DEVELOPING
Engage in structured professional collaborations on teams using an inquiry
approach that promotes shared leadership and focuses on improved student
learning?
4.2
Excerpt: N/A - This indicator was rated but not written about in the school's
final report.
DEVELOPING
Align assessments to curricula, use on-going assessment and grading practices,
and analyze information on student learning outcomes to adjust instructional
decisions at the team and classroom levels?
Establish a culture for learning that communicates high expectations to staff,
students, and families, and provide supports to achieve those expectations?
Quality Review - continued 4
QR Lead Reviewer: Teresa Caccavale
Dates of Review: April 9 - 10, 2013
Principal at Time of Review: Lori Anne Dimarco-Evanko
Areas of Celebration Areas of Focus
Structures for positive learning environment,
inclusive culture, and student success
A culture of learning that communicates high
expectations with supports
Support and evaluation of teachers through
feedback using the Danielson framework and
analysis of learning outcomes
Curricula-aligned assessment practices that
inform instruction
Research-based, effective instruction that yields
high quality student work
Rigorous, engaging and coherent curricula
aligned to the Common Core Learning Standards
•
•
•
•
•
•
Graphs Walk-Through
How to Interpret the Graphs Used in the Remainder of the Report
Most of the metrics in the report are presented through two standard graphs, which are intended to help place the school’s performance in context.
Graph Showing Metric Values
This graph shows the school’s performance on each metric over the past three years, as well as the range of historical performance by peer schools and
citywide schools used in the School Quality Guide (or Progress Report) for those three years. Peer schools for an elementary or K-8 school are similar
along the following student population characteristics: Economic Need Index, percent of students with disabilities, percent of black or Hispanic students,
and percent of English language learners. Peer schools for middle schools are similar along the following student population characteristics: students’
average proficiency on 4th grade ELA and math tests, percent of students with disabilities, and percent of students two or more years overage upon entry
into 6th grade. Peer schools for high schools are similar along the following student population characteristics: average 8th grade ELA proficiency, average
8th grade math proficiency, percent students with disabilities, percent students with self-contained placements, and percent over-age students.
 The vertical bars show the school’s values on the metric for the last three years, with the school’s numerical values (e.g., 30, 19, and 19 in the
example below) displayed at the bottom of the bars. These bars can show trends over time in the school’s own performance.
 Each year, the School Quality Guide compares the school’s performance against multiple years of historical performance by peer and city
schools. The middle horizontal line, in black, shows the average from this pool of historical performance by peer schools or the city, depending
on which comparison group is being used. Comparing the top of the vertical bar with this black line shows whether the school is above or
below the average of the pool of historical results achieved by the comparison group.
 The top and bottom horizontal lines, in gray, show the top and bottom of the “range” of historical values for the comparison group. The range
spans two standard deviations above and below the average; in general, this range contains approximately 96% of the values attained by
schools in the comparison group. The lower gray line shows the value at the bottom of the range for the comparison group and the higher gray
line shows the value at the top of the range for the comparison group. The position of the vertical bar between the two gray lines shows
visually where the school falls within the distribution of results achieved by the comparison group.
Graph Showing Percent of Range
This graph displays the “percent of range” of the school’s values for the last three years. The percent of range reflects where the school’s value falls
between the bottom and top of the range. In mathematical terms, percent of range = (school’s value – bottom of range) / (top of range – bottom of range).
The colors to the right of the chart display the ranges for the various ratings. The range for Exceeding Target is shown in dark green, Meeting Target is
shown in light green, Approaching Target is shown in orange, and Not Meeting Target is shown in red.
100%of range
Average value among similar schools or city
This school’s result
0%of range
Exceeding Target
Meeting Target
Approaching Target
Not Meeting Target
5
Student Progress
Student Progress includes growth metrics based on how students improved on the state tests between 2013 and 2014.
MEETING TARGET 6
English Median Adjusted Growth Percentile (n=371) Math Median Adjusted Growth Percentile (n=391)
English Median Adjusted Growth Percentile - School's
Lowest Third (n=118)
Math Median Adjusted Growth Percentile - School's
Lowest Third (n=130)
This metric calculates the median adjusted growth percentile of a school’s eligible
students. A student’s growth percentile compares his or her growth to the growth
of all students in the City who started at the same level of proficiency the year
before.
This metric calculates the median adjusted growth percentile of a school’s eligible
students. A student’s growth percentile compares his or her growth to the growth
of all students in the City who started at the same level of proficiency the year
before.
This metric calculates the median adjusted growth percentile of a school’s lowest
third of students in prior year English scores. A student’s growth percentile
compares his or her growth to the growth of all students in the City who started at
the same level of proficiency the year before.
This metric calculates the median adjusted growth percentile of a school’s lowest
third of students in prior year Math scores. A student’s growth percentile
compares his or her growth to the growth of all students in the City who started at
the same level of proficiency the year before.
Peer
Percent of Peer RangeSchool and Peer Values
51.0 70.0 67.0
0
20
40
60
80
100
2012 2013 2014
Peer
24%
51%
13%
0%
20%
40%
60%
80%
100%
2012 2013 2014
Percent of Peer RangeSchool and Peer Values
48.061.042.0
0
20
40
60
80
100
2012 2013 2014
Peer
72%
80%
23%
0%
20%
40%
60%
80%
100%
2012 2013 2014
Percent of Peer RangeSchool and Peer Values
82.587.062.0
0
20
40
60
80
100
2012 2013 2014
Peer
30%
52%
24%
0%
20%
40%
60%
80%
100%
2012 2013 2014
Percent of Peer RangeSchool and Peer Values
66.075.556.0
0
20
40
60
80
100
2012 2013 2014
City
63%
68%
14%
0%
20%
40%
60%
80%
100%
2012 2013 2014
Percent of City RangeSchool and City Values
67.070.051.0
0
20
40
60
80
100
2012 2013 2014
City
71%
78%
13%
0%
20%
40%
60%
80%
100%
2012 2013 2014
Percent of City RangeSchool and City Values
82.587.062.0
0
20
40
60
80
100
2012 2013 2014
City
16%
48%
14%
0%
20%
40%
60%
80%
100%
2012 2013 2014
Percent of City RangeSchool and City Values
48.061.042.0
0
20
40
60
80
100
2012 2013 2014
City
28%
53%
25%
0%
20%
40%
60%
80%
100%
2012 2013 2014
Percent of City RangeSchool and City Values
66.075.556.0
0
20
40
60
80
100
2012 2013 2014
71%71%
17%
0%
20%
40%
60%
80%
100%
2012 2013 2014
Student Achievement 7
Student Achievement is based on results on the 2014 state tests in English and Math, core course pass rates, and measures of next-level
readiness.
English - Percentage of Students at Level 3 or 4
(n=419)
Math - Percentage of Students at Level 3 or 4 (n=445)
English - Average Student Proficiency (n=419) Math - Average Student Proficiency (n=445)
This metric shows the percentage of students who are performing at or above
proficiency as defined by New York State on Common Core ELA exams in the
current year. This is the percentage of students at either Level 3 (proficient) or
Level 4 (advanced).
This metric shows the percentage of students who are performing at or above
proficiency as defined by New York State on Common Core math exams in the
current year. This is the percentage of students at either Level 3 (proficient) or
Level 4 (advanced).
This metric represents the average (mean) Proficiency Rating in ELA for all students
attributed to the school. The Average Proficiency Rating is measured on a scale of
1.00 to 4.50, and is based on students’ scale scores on the State exams in ELA.
This metric represents the average (mean) Proficiency Rating in Math for all
students attributed to the school. The Average Proficiency Rating is measured on a
scale of 1.00 to 4.50, and is based on students’ scale scores on the State exams in
Math.
Peer
Percent of Peer RangeSchool and Peer Values
24 11 10
0
20
40
60
80
100
2012 2013 2014
Peer
28%
31%
12%
0%
20%
40%
60%
80%
100%
2012 2013 2014
Percent of Peer RangeSchool and Peer Values
8930
0
20
40
60
80
100
2012 2013 2014
Peer
39%
26%
16%
0%
20%
40%
60%
80%
100%
2012 2013 2014
Percent of Peer RangeSchool and Peer Values
2.55 2.23 2.24
0
0.5
1
1.5
2
2.5
3
3.5
4
4.5
2012 2013 2014
Peer
29%
24%
9%
0%
20%
40%
60%
80%
100%
2012 2013 2014
Percent of Peer RangeSchool and Peer Values
2.122.122.66
0
0.5
1
1.5
2
2.5
3
3.5
4
4.5
2012 2013 2014
City
25%26%
35%
0%
20%
40%
60%
80%
100%
2012 2013 2014
Percent of City RangeSchool and City Values
101124
0
20
40
60
80
100
2012 2013 2014
City
38%37%38%
0%
20%
40%
60%
80%
100%
2012 2013 2014
Percent of City RangeSchool and City Values
2.242.232.55
0
0.5
1
1.5
2
2.5
3
3.5
4
4.5
2012 2013 2014
City
18%21%
28%
0%
20%
40%
60%
80%
100%
2012 2013 2014
Percent of City RangeSchool and City Values
8930
0
20
40
60
80
100
2012 2013 2014
City
31%31%28%
0%
20%
40%
60%
80%
100%
2012 2013 2014
Percent of City RangeSchool and City Values
2.122.122.66
0
0.5
1
1.5
2
2.5
3
3.5
4
4.5
2012 2013 2014
38%
30%
22%
0%
20%
40%
60%
80%
100%
2012 2013 2014
APPROACHING TARGET
Student Achievement - continued 8
Student Achievement is based on results on the 2014 state tests in English and Math, core course pass rates, and measures of next-level
readiness.
APPROACHING TARGET
Percent of Students Passing an English Course (n=437)
Percent of Students Passing a Science Course (n=437) Percent of Students Passing a Social Studies Course
(n=437)
This metric indicates the percentage of students in 6th through 8th grade who
received a passing grade in a full year course in English.
This metric indicates the percentage of students in 6th through 8th grade who
received a passing grade in a full year course in Science.
This metric indicates the percentage of students in 6th through 8th grade who
received a passing grade in a full year course in Social Studies.
Peer
Percent of Peer RangeSchool and Peer Values
85 89 94
0
20
40
60
80
100
2012 2013 2014
Peer
45%
0%
37%
0%
20%
40%
60%
80%
100%
2012 2013 2014
Percent of Peer RangeSchool and Peer Values
82 73 82
0
20
40
60
80
100
2012 2013 2014
Peer
78%
39%
16%
0%
20%
40%
60%
80%
100%
2012 2013 2014
Percent of Peer RangeSchool and Peer Values
948774
0
20
40
60
80
100
2012 2013 2014
Peer
81%
19%
5%
0%
20%
40%
60%
80%
100%
2012 2013 2014
Percent of Peer RangeSchool and Peer Values
948071
0
20
40
60
80
100
2012 2013 2014
City
83%
64%
52%
0%
20%
40%
60%
80%
100%
2012 2013 2014
Percent of City RangeSchool and City Values
948985
0
20
40
60
80
100
2012 2013 2014
City
80%
55%
20%
0%
20%
40%
60%
80%
100%
2012 2013 2014
Percent of City RangeSchool and City Values
948774
0
20
40
60
80
100
2012 2013 2014
City
49%
14%
47%
0%
20%
40%
60%
80%
100%
2012 2013 2014
Percent of City RangeSchool and City Values
827382
0
20
40
60
80
100
2012 2013 2014
City
84%
37%
9%
0%
20%
40%
60%
80%
100%
2012 2013 2014
Percent of City RangeSchool and City Values
948071
0
20
40
60
80
100
2012 2013 2014
80%
55%
39%
0%
20%
40%
60%
80%
100%
2012 2013 2014
Percent of Students Passing a Math Course (n=437)
This metric indicates the percentage of students in 6th through 8th grade who
received a passing grade in a full year course in Math.
Student Achievement - continued 9
Student Achievement is based on results on the 2014 state tests in English and Math, core course pass rates, and measures of next-level
readiness.
APPROACHING TARGET
Percent of 8th Graders Earning High School Credit
(n=187)
9th Grade Adjusted Credit Accumulation of Former
8th Graders (n=181)
This metric indicates the percentage of students in 6th through 8th grade who
received a passing grade in a full year course in English.
This metric indicates the percentage of students in 6th through 8th grade who
received a passing grade in a full year course in Math.
Peer
Percent of Peer RangeSchool and Peer Values
0 21 17
0
20
40
60
80
100
2012 2013 2014
Peer
77%
57%57%
0%
20%
40%
60%
80%
100%
2012 2013 2014
Percent of Peer RangeSchool and Peer Values
908581
0
20
40
60
80
100
2012 2013 2014
City
33%
39%
1%
0%
20%
40%
60%
80%
100%
2012 2013 2014
Percent of City RangeSchool and City Values
17210
0
20
40
60
80
100
2012 2013 2014
City
74%
57%57%
0%
20%
40%
60%
80%
100%
2012 2013 2014
Percent of City RangeSchool and City Values
908581
0
20
40
60
80
100
2012 2013 2014
42%42%
1%
0%
20%
40%
60%
80%
100%
2012 2013 2014
School Environment
The NYC School Survey is administered annually to all parents, all teachers, and students in grades 6–12. Through the survey, these
members of school communities respond to questions that gauge their satisfaction with elements of the school’s learning environment.
In 2013–14 accountability reports, these responses were reorganized to broadly align to guiding concepts in the Quality Review rubric:
the instructional core, school culture, and systems for improvement. Please note that this organization is designed to help school
communities better interpret survey responses, but survey responses do not contribute to Quality Review ratings in these categories.
APPROACHING TARGET 10
Survey Satisfaction - Instructional Core Survey Satisfaction - School Culture
Survey Satisfaction - Systems for Improvement Attendance
This metric shows the average percent of positive responses to the NYC School Survey
questions related to the school's instructional core.
This metric shows the average percent of positive responses to the NYC School
Survey questions related to the school's culture.
This metric shows the average percent of positive responses to the NYC School Survey
questions related to the school's systems for improvement.
The attendance rate includes the attendance for all K-8 students on a school's
register at any point during the school year (September through June).
Peer
City
Peer
Peer Peer
City
City City
31%
0%
23%
0%
20%
40%
60%
80%
100%
2012 2013 2014
31%
16%
38%
0%
20%
40%
60%
80%
100%
2012 2013 2014
Percent of Peer Range
Percent of City Range
School and Peer Values
School and City Values
91 89 90
60
70
80
90
100
2012 2013 2014
91 89 90
60
70
80
90
100
2012 2013 2014
29%
0%
20%
40%
60%
80%
100%
2012 2013 2014
29%
0%
20%
40%
60%
80%
100%
2012 2013 2014
Percent of Peer Range
Percent of City Range
School and Peer Values
School and City Values
84
0
20
40
60
80
100
2012 2013 2014
84
0
20
40
60
80
100
2012 2013 2014
36%
0%
20%
40%
60%
80%
100%
2012 2013 2014
33%
0%
20%
40%
60%
80%
100%
2012 2013 2014
Percent of Peer Range
Percent of City Range
School and Peer Values
School and City Values
82
0
20
40
60
80
100
2012 2013 2014
82
0
20
40
60
80
100
2012 2013 2014
31%
0%
20%
40%
60%
80%
100%
2012 2013 2014
30%
0%
20%
40%
60%
80%
100%
2012 2013 2014
Percent of Peer Range
Percent of City Range
School and Peer Values
School and City Values
81
0
20
40
60
80
100
2012 2013 2014
81
0
20
40
60
80
100
2012 2013 2014
Closing the Achievement Gap
Closing the Achivement Gap measures the extent to which the school serves and succeeds with students in special populations.
APPROACHING TARGET 11
SCHOOL'S
RESULTS
POPULATION
PERCENTAGE
SCHOOL'S
RESULTS
POPULATION
PERCENTAGE
SCHOOL'S
RESULTS
POPULATION
PERCENTAGE
2011-12 2012-13 2013-14
Percent at Level 3 or 4
English
Self-Contained (n = 44) 3.0% 11.4% 1.8% 11.0% 2.3% 10.5%
Integrated Co-Teaching (ICT) (n = 28) 0.0% 3.7% 0.0% 6.8% 0.0% 6.7%
Special Education Teacher Support Services (SETSS) (n = 15) 0.0% 4.1% 0.0% 3.8% 0.0% 3.6%
Mathematics
Self-Contained (n = 42) 0.0% 11.3% 0.0% 10.6% 2.4% 9.4%
Integrated Co-Teaching (ICT) (n = 28) 4.5% 3.6% 2.9% 6.6% 0.0% 6.3%
Special Education Teacher Support Services (SETSS) (n = 15) 4.0% 4.1% 0.0% 3.7% 0.0% 3.4%
Percent at 75th Growth Percentile or Higher
English
English Language Learners (n = 85) 29.4% 19.6% 42.2% 22.8% 51.8% 22.9%
Lowest Third Citywide (n = 179) 33.9% 43.6% 61.1% 49.3% 53.6% 48.2%
Self-Contained/ICT/SETSS (n = 80) 50.0% 19.2% 74.0% 22.3% 55.0% 21.6%
Black and Hispanic Males in Lowest Third Citywide (n = 84) 36.1% 18.6% 67.3% 23.9% 50.0% 22.6%
Mathematics
English Language Learners (n = 105) 23.3% 21.6% 37.2% 25.7% 29.5% 26.9%
Lowest Third Citywide (n = 193) 22.5% 50.5% 49.6% 51.5% 34.7% 49.4%
Self-Contained/ICT/SETSS (n = 78) 21.8% 18.8% 56.9% 21.7% 48.7% 19.9%
Black and Hispanic Males in Lowest Third Citywide (n = 72) 24.5% 20.5% 51.9% 23.0% 37.5% 18.4%
Movement from SC/ICT/SETSS to Less Restrictive Environments (n = 70) 0.47 17.4% 0.28 18.3% 0.46 15.2%
English Language Learner Progress (n = 95) 54.3% 16.6% 35.4% 14.6% 35.8% 20.7%
Summary of Section Ratings
This
School's
Results
Percent of
Peer Range
Peer Comparison (weighted 75%)
Points
Possible
Points
Earned
Peer Range
0% 100%
Percent of
City Range
City Comparison (weighted 25%)
City Range
0% 100%
Student Progress
Student Achievement
School Environment
Average Average
This section shows how the ratings are calculated for the Student Progress, Student Achievement, School Environment, and Closing the
Achievement Gap sections.
12
English Median Adjusted Growth Percentile (n = 371) 67.0 45.1 76.1 70.6% 49.4 77.4 62.9% 25.0 17.260.6 63.4
Math Median Adjusted Growth Percentile (n = 391) 48.0 37.0 82.4 24.2% 41.7 80.9 16.1% 25.0 5.559.7 61.3
English Median Adjusted Growth Percentile - School's Lowest
Third (n = 118)
82.5 59.6 91.4 72.0% 62.7 90.7 70.7% 25.0 17.975.5 76.7
Math Median Adjusted Growth Percentile - School's Lowest
Third (n = 130)
66.0 56.3 89.1 29.6% 56.8 89.4 28.2% 25.0 7.372.7 73.1
Student Progress Section Rating
47.9
Not Meeting Target
19.4 or Lower
Approaching Target
19.5 to 47.7
Meeting Target
47.8 to 66.5
Exceeding Target
66.6 or Higher
English - Percentage of Students at Level 3 or 4 (n = 419) 10.3% 2.9% 22.3% 38.1% 0.0% 40.6% 25.4% 19.0 6.612.6% 20.3%
Math - Percentage of Students at Level 3 or 4 (n = 445) 8.3% 0.0% 29.4% 28.2% 0.0% 45.0% 18.4% 19.0 4.914.7% 22.5%
English - Average Student Proficiency (n = 419) 2.24 2.06 2.52 39.1% 1.68 3.16 37.8% 19.0 7.42.29 2.42
Math - Average Student Proficiency (n = 445) 2.12 1.86 2.76 28.9% 1.57 3.33 31.3% 19.0 5.62.31 2.45
Percent of Students Passing an English Course (n = 437) 94.1% 70.5% 100.0% 80.0% 65.4% 100.0% 82.9% 4.0 3.287.5% 88.8%
Percent of Students Passing a Math Course (n = 437) 82.4% 68.2% 100.0% 44.7% 65.6% 100.0% 48.8% 4.0 1.885.5% 87.7%
Percent of Students Passing a Science Course (n = 437) 93.6% 71.6% 100.0% 77.5% 67.4% 100.0% 80.4% 4.0 3.187.8% 89.1%
Percent of Students Passing a Social Studies Course (n = 437) 94.1% 68.5% 100.0% 81.3% 63.1% 100.0% 84.0% 4.0 3.387.1% 88.3%
Percent of 8th Graders Earning High School Credit (n = 187) 17.1% 0.0% 41.2% 41.5% 0.0% 51.2% 33.4% 4.0 1.620.6% 25.6%
9th Grade Adjusted Credit Accumulation of Former 8th
Graders (n = 181)
90.0% 56.0% 100.0% 77.3% 61.0% 100.0% 74.4% 4.0 3.181.0% 84.0%
Student Achievement Section Rating
40.6
Not Meeting Target
28.3 or Lower
Approaching Target
28.4 to 49.4
Meeting Target
49.5 to 73.0
Exceeding Target
73.1 or Higher
School Survey - Instructional Core 84.1% 78.0% 99.0% 29.0% 77.7% 99.5% 29.4% 22.2 6.588.6%88.5%
School Survey - School Culture 81.7% 72.8% 97.8% 35.6% 73.8% 98.0% 32.6% 22.2 7.785.9%85.3%
School Survey - Structures for Improvement 81.4% 73.6% 98.6% 31.2% 73.7% 99.1% 30.3% 22.2 6.986.4%86.1%
Attendance Rate 90.3% 87.9% 95.7% 30.8% 86.6% 98.4% 31.4% 33.3 10.392.5%91.8%
School Environment Section Rating
31.4
Not Meeting Target
22.0 or Lower
Approaching Target
22.1 to 46.4
Meeting Target
46.5 to 66.7
Exceeding Target
66.8 or Higher
Summary of Section Ratings - continued
This School's
Population
Percentage
This School's
Population Percentage
(Percent of City Range)
This School's
Results (Percent
of City Range)
This
School's
Results
Closing the Achievement Gap
37.6
Not Meeting Target
19.1 or Lower
Approaching Target
19.2 to 38.0
Meeting Target
38.1 to 60.2
Exceeding Target
60.3 or Higher
This section shows how the ratings are calculated for the Student Progress, Student Achievement, School Environment, and Closing the
Achievement Gap sections.
Average of Results (Percent of City Range)
This Closing the Achievement Gap section reflects the degree to which the school is helping high-need students succeed. In some
cases, schools will not receive a rating in this section because those students make up a very small proportion of the school’s
student population.
The metric values, listed as “This School’s Results,” show the school’s results with its students in the relevant group. The metric
scores, listed as “This School’s Results (Percent of City Range),” show how the school’s results compared to the rest of the city. A
metric will not be scored, however, if those students are a very small proportion of the school—specifically, if “This School’s
Population Percentage (Percent of City Range)” is less than 25.0% (meaning that the school’s population percentage is more than
one standard deviation below the citywide average). For these unscored metrics, “This School’s Results (Percent of City Range)” will
be left blank.
The section score is the average of the school’s metric scores, and the section rating is determined by the range that the score falls
within, which will be shaded in the ratings table above. A school will not receive a rating, however, if it has fewer than five scored
metrics in this section.
13
Percent at Level 3 or 4
English
Self-Contained (n = 44) 10.5% 2.3%50.2% 100.0%
Integrated Co-Teaching (ICT) (n = 28) 6.7% 0.0%36.2% 0.0%
Special Education Teacher Support Services (SETSS) (n = 15) 3.6% 0.0%35.3% 0.0%
Mathematics
Self-Contained (n = 42) 9.4% 2.4%45.2% 63.2%
Integrated Co-Teaching (ICT) (n = 28) 6.3% 0.0%34.2% 0.0%
Special Education Teacher Support Services (SETSS) (n = 15) 3.4% 0.0%33.7% 0.0%
Percent at 75th Growth Percentile or Higher
English
English Language Learners (n = 85) 22.9% 51.8%48.9% 68.1%
Lowest Third Citywide (n = 179) 48.2% 53.6%58.9% 53.6%
Self-Contained/ICT/SETSS (n = 80) 21.6% 55.0%50.3% 48.3%
Black and Hispanic Males in Lowest Third Citywide (n = 84) 22.6% 50.0%46.2% 46.8%
Mathematics
English Language Learners (n = 105) 26.9% 29.5%53.0% 31.7%
Lowest Third Citywide (n = 193) 49.4% 34.7%58.9% 20.4%
Self-Contained/ICT/SETSS (n = 78) 19.9% 48.7%46.7% 50.7%
Black and Hispanic Males in Lowest Third Citywide (n = 72) 18.4% 37.5%37.6% 26.1%
Movement from SC/ICT/SETSS to Less Restrictive Environments (n = 70) 15.2% 0.4643.7% 51.1%
English Language Learner Progress (n = 95) 20.7% 35.8%56.7% 40.8%
This page provides more granular data on student outcomes. While the numbers here do not individually count for points, the detailed
deconstruction should provide deeper insight into 2013–14 student outcomes.
6th Grade (n = 132) 2.08 6.1% 39.0
7th Grade (n = 120) 2.15 6.7% 65.5
8th Grade (n = 193) 2.13 10.9% 53.0
6th Grade (n = 130) 2.21 6.9% 60.0
7th Grade (n = 116) 2.23 14.7% 75.0
8th Grade (n = 173) 2.26 9.8% 64.5
State Exam Scores by Grade
ALL SUBJECTS: 17.6%
MATHEMATICS: 17.6%
97.0%
SCIENCE: 16.0%
87.9%
LANGUAGE OTHER THAN
ENGLISH:
0.0%
100.0%
.
AVERAGE STUDENT
PROFICIENCY
PERCENTAGE OF STUDENTS
AT LEVEL 3 OR LEVEL 4
MEDIAN ADJUSTED
GROWTH PERCENTILE
Mathematics
English
Science
17.1%
15.5%
16.0%
0.0%
% of 8th Graders Earning High School Credit
FORMULA: ( % taking accelerated courses ) X ( % taking accelerated courses who passed ) = % EARNING HIGH SCHOOL CREDIT
) =
) =
) =
) =
) X (
) X (
) X (
) X (
(
(
(
(
THIS SCHOOL'S
RESULTS PEER AVERAGE CITY AVERAGE
8th Grade (n = 187) 2.53 28.9% .
Chronic Absenteeism
35.7%Students With Less Than 90% Attendance (n = 502) 23.4%
PERCENTAGE OF
STUDENTS SCHOOLWIDE
AVERAGE OF SCHOOLS
CITYWIDE
English (n = 150 ) 50.0 56.5 61.1
Mathematics (n = 159 ) 40.0 55.6 58.9
Long-Term Growth Percentile
High School Readiness Indicators
Additional Information 14
Peer Group Schools
Each school's performance is compared to the performance of schools in its peer group. Peer schools are those New York
City public schools with a student population most like this school's population, according to the peering characteristics.
Each school has up to 40 peer schools (except for K-8 schools, which have up to 30 peer schools).
Peer groupings are created using a matching methodology that examines the mathematical difference between a school and
all potential peers on the peering characteristics. Schools with the smallest difference across all the characteristics are
peered together.
15
DBN SCHOOL
AVERAGE ENGLISH
PROFICIENCY
AVERAGE MATH
PROFICIENCY
% STUDENTS WITH
DISABILITIES
% OVERAGE
08X125 J.H.S. 125 Henry Hudson 2.37 2.59 21.4% 3.9%
03M421 West Prep Academy 2.29 2.41 22.0% 3.7%
04M825 Isaac Newton Middle School for Math & Science 2.40 2.66 24.7% 4.3%
08X131 J.H.S. 131 Albert Einstein 2.31 2.54 24.1% 5.4%
08X269 Bronx Studio School for Writers and Artists 2.30 2.52 23.6% 3.8%
08X562 Blueprint Middle School 2.31 2.58 24.4% 4.5%
09X231 Eagle Academy for Young Men 2.35 2.57 26.0% 3.5%
09X241 Urban Assembly School for Applied Math and Science, The 2.32 2.47 19.4% 2.3%
09X327 Comprehensive Model School Project M.S. 327 2.41 2.63 20.8% 3.1%
09X454 Science and Technology Academy: A Mott Hall School 2.44 2.58 20.9% 4.8%
10X368 In-Tech Academy (M.S. / High School 368) 2.39 2.61 20.2% 4.6%
11X326 Bronx Green Middle School 2.28 2.54 23.0% 3.2%
11X556 Bronx Park Middle School 2.32 2.52 18.5% 3.5%
12X242 Mott Hall V 2.35 2.64 21.8% 3.3%
12X286 Fannie Lou Hamer Middle School 2.27 2.43 23.5% 4.0%
12X316 Kappa III 2.46 2.62 20.1% 3.0%
13K103 Satellite Three 2.37 2.58 19.0% 3.4%
13K113 M.S. 113 Ronald Edmonds Learning Center 2.46 2.61 20.6% 3.8%
13K596 MS 596 Peace Academy 2.23 2.40 22.7% 4.5%
13K691 Fort Greene Preparatory Academy 2.40 2.58 21.8% 1.9%
16K393 Frederick Douglass Academy IV Secondary School 2.41 2.64 24.1% 3.4%
16K681 Madiba Prep Middle School 2.47 2.54 25.5% 4.2%
18K211 I.S. 211 John Wilson 2.45 2.55 21.5% 3.3%
21K096 I.S. 096 Seth Low 2.45 2.74 21.4% 3.0%
22K078 J.H.S. 078 Roy H. Mann 2.40 2.57 21.9% 2.7%
23K518 Kappa V 2.40 2.51 18.0% 3.0%
24Q077 I.S. 077 2.39 2.56 23.5% 2.5%
27Q226 J.H.S. 226 Virgil I. Grissom 2.43 2.64 19.9% 5.3%
27Q309 Academy of Medical Technology: A College Board School 2.40 2.58 21.5% 5.0%
28Q072 Catherine & Count Basie Middle School 72 2.39 2.53 20.6% 5.2%
29Q289 Queens United Middle School 2.43 2.41 20.0% 3.8%
29Q327 Eagle Academy for Young Men III 2.41 2.53 22.6% 1.9%
30Q126 Albert Shanker School for Visual and Performing Arts 2.34 2.55 20.7% 2.1%
30Q204 I.S. 204 Oliver W. Holmes 2.41 2.69 20.0% 4.3%
32K347 I.S. 347 School of Humanities 2.29 2.46 20.8% 3.8%
84K730 Summit Academy Charter School 2.35 2.53 21.7% 1.8%
84K757 Unity Prep Charter School 2.45 2.53 21.6% 3.6%
84M065 Democracy Prep Endurance Charter School 2.33 2.53 23.9% 5.0%
84M350 Democracy Prep Charter School 2.41 2.54 21.6% 4.0%
84X177 Mott Hall Charter School 2.39 2.54 24.3% 2.7%
84X488 The Equality Charter School 2.29 2.47 22.3% 2.1%
2.37 2.55 21.9% 3.6%PEER GROUP AVERAGES
Metric Targets for 2014-15
The previous pages in this report have shown the school's performance in 2013-14 and earlier. In contrast, this page is forward looking
and shows targets connected to the category ratings for the 2014-15 school year.
Not Meeting Target Approaching Target Meeting Target Exceeding Target
2014-15 Metric Values Needed for Each RatingThis School's
2013-14
Result
Student Progress
Student Achievement
School Environment
16
English Median Adjusted Growth Percentile 67.0 52.1 to 60.6 60.7 to 66.3 66.4 or higher52.0 or lower
Math Median Adjusted Growth Percentile 48.0 46.8 to 59.1 59.2 to 67.3 67.4 or higher46.7 or lower
English Median Adjusted Growth Percentile - School's Lowest Third 82.5 66.4 to 75.1 75.2 to 80.8 80.9 or higher66.3 or lower
Math Median Adjusted Growth Percentile - School's Lowest Third 66.0 62.8 to 72.0 72.1 to 78.1 78.2 or higher62.7 or lower
English - Percentage of Students at Level 3 or 4 10.3% 8.8% to 13.4% 13.5% to 18.7% 18.8% or higher8.7% or lower
Math - Percentage of Students at Level 3 or 4 8.3% 9.1% to 15.8% 15.9% to 23.4% 23.5% or higher9.0% or lower
English - Average Student Proficiency 2.24 2.18 to 2.29 2.30 to 2.42 2.43 or higher2.17 or lower
Math - Average Student Proficiency 2.12 2.11 to 2.32 2.33 to 2.56 2.57 or higher2.10 or lower
Percent of Students Passing an English Course 94.1% 78.1% to 84.4% 84.5% to 91.7% 91.8% or higher78.0% or lower
Percent of Students Passing a Math Course 82.4% 76.8% to 83.5% 83.6% to 91.2% 91.3% or higher76.7% or lower
Percent of Students Passing a Science Course 93.6% 79.0% to 85.1% 85.2% to 92.0% 92.1% or higher78.9% or lower
Percent of Students Passing a Social Studies Course 94.1% 76.6% to 83.4% 83.5% to 91.1% 91.2% or higher76.5% or lower
Percent of 8th Graders Earning High School Credit 17.1% 12.3% to 21.3% 21.4% to 31.6% 31.7% or higher12.2% or lower
9th Grade Adjusted Credit Accumulation of Former 8th Graders 90.0% 69.0% to 77.9% 78.0% to 88.9% 89.0% or higher68.9% or lower
School Survey - Instructional Core 84.1% 82.6% to 87.7% 87.8% to 92.0% 92.1% or higher82.5% or lower
School Survey - School Culture 81.7% 78.5% to 84.5% 84.6% to 89.5% 89.6% or higher78.4% or lower
School Survey - Structures for Improvement 81.4% 79.2% to 85.2% 85.3% to 90.3% 90.4% or higher79.1% or lower
Attendance Rate 90.3% 89.5% to 91.5% 91.6% to 93.3% 93.4% or higher89.4% or lower
Metric Targets for 2014-15 - continued
The previous pages in this report have shown the school's performance in 2013-14 and earlier. In contrast, this page is forward looking
and shows targets connected to the category ratings for the 2014-15 school year.
Not Meeting Target Approaching Target Meeting Target Exceeding Target
2014-15 Metric Values Needed for Each RatingThis School's
2013-14
Result
Closing the Achievement Gap
17
Percent at Level 3 or 4
English
Self-Contained 2.3% 0.4% to 0.7% 0.8% to 1.2% 1.3% or higher0.3% or lower
Integrated Co-Teaching (ICT) 0.0% 1.6% to 3.1% 3.2% to 5.0% 5.1% or higher1.5% or lower
Special Education Teacher Support Services (SETSS) 0.0% 2.6% to 5.1% 5.2% to 8.1% 8.2% or higher2.5% or lower
Mathematics
Self-Contained 2.4% 0.7% to 1.3% 1.4% to 2.2% 2.3% or higher0.6% or lower
Integrated Co-Teaching (ICT) 0.0% 2.4% to 4.7% 4.8% to 7.5% 7.6% or higher2.3% or lower
Special Education Teacher Support Services (SETSS) 0.0% 3.3% to 6.5% 6.6% to 10.3% 10.4% or higher3.2% or lower
Percent at 75th Growth Percentile or Higher
English
English Language Learners 51.8% 27.0% to 36.5% 36.6% to 47.7% 47.8% or higher26.9% or lower
Lowest Third Citywide 53.6% 39.4% to 47.1% 47.2% to 56.2% 56.3% or higher39.3% or lower
Self-Contained/ICT/SETSS 55.0% 42.9% to 50.7% 50.8% to 59.9% 60.0% or higher42.8% or lower
Black and Hispanic Males in Lowest Third Citywide 50.0% 38.0% to 46.1% 46.2% to 55.8% 55.9% or higher37.9% or lower
Mathematics
English Language Learners 29.5% 22.8% to 32.9% 33.0% to 44.9% 45.0% or higher22.7% or lower
Lowest Third Citywide 34.7% 34.1% to 43.6% 43.7% to 54.8% 54.9% or higher34.0% or lower
Self-Contained/ICT/SETSS 48.7% 34.5% to 42.9% 43.0% to 53.0% 53.1% or higher34.4% or lower
Black and Hispanic Males in Lowest Third Citywide 37.5% 34.0% to 43.6% 43.7% to 55.0% 55.1% or higher33.9% or lower
Movement from SC/ICT/SETSS to Less Restrictive Environments 0.46 0.17 to 0.33 0.34 to 0.53 0.54 or higher0.16 or lower
English Language Learner Progress 35.8% 22.8% to 34.1% 34.2% to 47.4% 47.5% or higher22.7% or lower

School_Quality_Guide_2014_EMS_X125

  • 1.
    School Quality Guide 2013-2014 SchoolOverview School: J.H.S. 125 Henry Hudson DBN: 08X125 Principal: Lori Anne Dimarco Evanko School Type: Middle Grade Enrollment 2011-2012 2012-2013 2013-2014 Student Population Characteristics 2011-2012 2012-2013 2013-2014 In this report: School Overview 1 School Quality Guide Summary 2 Quality Review 3–4 Graphs Walk-Through 5 Student Progress 6 Student Achievement 7-9 School Environment 10 Closing the Achievement Gap 11 Summary of Section Ratings 12-13 Additional Information 14 Peer Group Schools 15 Metric Targets for 2014–15 16-17 Grade 6 185 123 139 Grade 7 205 182 126 Grade 8 242 236 197 632 541 462All Students % English Language Learners 18% 17% 21% % Students with IEPs 20% 22% 21% % Students with IEPs (less than 20% time with non-disabled peers) 10% 9% 7% % Free Lunch Eligible 81% 89% 89% % Overage - 3% 4% % Asian 25% 26% 25% % Black 15% 13% 13% % Hispanic 58% 58% 57% % White 2% 2% 3% % Other 0% 0% 2% Average Incoming ELA Proficiency (based on 4th grade) - 2.76 2.37 Average Incoming Math Proficiency (based on 4th grade) - 3.19 2.59
  • 2.
    School Quality GuideSummary Quality Review Student Progress Student Achievement School Environment Closing the Achievement Gap Dates of Review: April 9 - 10, 2013 Principal at Time of Review: Lori Anne Dimarco- Evanko UNDERDEVELOPED DEVELOPING PROFICIENT WELL DEVELOPED NOT MEETING TARGET APPROACHING TARGET MEETING TARGET EXCEEDING TARGET NOT MEETING TARGET APPROACHING TARGET MEETING TARGET EXCEEDING TARGET NOT MEETING TARGET APPROACHING TARGET MEETING TARGET EXCEEDING TARGET NOT MEETING TARGET APPROACHING TARGET MEETING TARGET EXCEEDING TARGET State Accountability The school's current status: Focus This designation is determined by the New York State Department of Education under the Elementary and Secondary Education Act (ESEA) Flexibility Waiver. More information on New York State accountability can be found here: http://schools.nyc.gov/Accountability/tools/accountability/default.htm. 2
  • 3.
    Quality Review 3 QRLead Reviewer: Teresa Caccavale Dates of Review: April 9 - 10, 2013 Principal at Time of Review: Lori Anne Dimarco-Evanko To what extent does the school... Ensure engaging, rigorous, and coherent curricula in all subjects, accessible for a variety of learners and aligned to Common Core Learning Standards and/or content standards? Develop teacher pedagogy from a coherent set of beliefs about how students learn best that is informed by the instructional shifts and Danielson Framework for Teaching, aligned to the curricula, engaging, and meets the needs of all learners so that all students produce meaningful work products? 1.1 1.2 2.2 Excerpt: Strengthen the design of curricula and academic tasks to consistently support rigorous and cognitively engaging learning opportunities for all students. Excerpt: Enhance teaching strategies, including scaffolds and routines, in order to enrich student participation, thereby increasing opportunities for further development of critical thinking skills. Excerpt: Strengthen the analysis of data gathering at the grade and school level to develop a stronger understanding of subgroup patterns and trends to improve student outcomes. DEVELOPING DEVELOPING DEVELOPING The Quality Review is an evaluation of the school by an experienced educator based on a formal school visit. The educator observes classrooms and engages in conversations with parents, students, teachers, and school leaders to assess schoolwide practices. The Quality Review report provides specific feedback to support the school’s efforts. The information displayed here reflects the most recent year that a Quality Review was conducted at this school. Some schools will not have Quality Review information if they opened within the last two years or if their most recent review took place prior to August 2010. 3.4 Excerpt: The principal has created a learning community well focused on student performance with a vision to accelerate learning for all students. DEVELOPING Engage in structured professional collaborations on teams using an inquiry approach that promotes shared leadership and focuses on improved student learning? 4.2 Excerpt: N/A - This indicator was rated but not written about in the school's final report. DEVELOPING Align assessments to curricula, use on-going assessment and grading practices, and analyze information on student learning outcomes to adjust instructional decisions at the team and classroom levels? Establish a culture for learning that communicates high expectations to staff, students, and families, and provide supports to achieve those expectations?
  • 4.
    Quality Review -continued 4 QR Lead Reviewer: Teresa Caccavale Dates of Review: April 9 - 10, 2013 Principal at Time of Review: Lori Anne Dimarco-Evanko Areas of Celebration Areas of Focus Structures for positive learning environment, inclusive culture, and student success A culture of learning that communicates high expectations with supports Support and evaluation of teachers through feedback using the Danielson framework and analysis of learning outcomes Curricula-aligned assessment practices that inform instruction Research-based, effective instruction that yields high quality student work Rigorous, engaging and coherent curricula aligned to the Common Core Learning Standards • • • • • •
  • 5.
    Graphs Walk-Through How toInterpret the Graphs Used in the Remainder of the Report Most of the metrics in the report are presented through two standard graphs, which are intended to help place the school’s performance in context. Graph Showing Metric Values This graph shows the school’s performance on each metric over the past three years, as well as the range of historical performance by peer schools and citywide schools used in the School Quality Guide (or Progress Report) for those three years. Peer schools for an elementary or K-8 school are similar along the following student population characteristics: Economic Need Index, percent of students with disabilities, percent of black or Hispanic students, and percent of English language learners. Peer schools for middle schools are similar along the following student population characteristics: students’ average proficiency on 4th grade ELA and math tests, percent of students with disabilities, and percent of students two or more years overage upon entry into 6th grade. Peer schools for high schools are similar along the following student population characteristics: average 8th grade ELA proficiency, average 8th grade math proficiency, percent students with disabilities, percent students with self-contained placements, and percent over-age students.  The vertical bars show the school’s values on the metric for the last three years, with the school’s numerical values (e.g., 30, 19, and 19 in the example below) displayed at the bottom of the bars. These bars can show trends over time in the school’s own performance.  Each year, the School Quality Guide compares the school’s performance against multiple years of historical performance by peer and city schools. The middle horizontal line, in black, shows the average from this pool of historical performance by peer schools or the city, depending on which comparison group is being used. Comparing the top of the vertical bar with this black line shows whether the school is above or below the average of the pool of historical results achieved by the comparison group.  The top and bottom horizontal lines, in gray, show the top and bottom of the “range” of historical values for the comparison group. The range spans two standard deviations above and below the average; in general, this range contains approximately 96% of the values attained by schools in the comparison group. The lower gray line shows the value at the bottom of the range for the comparison group and the higher gray line shows the value at the top of the range for the comparison group. The position of the vertical bar between the two gray lines shows visually where the school falls within the distribution of results achieved by the comparison group. Graph Showing Percent of Range This graph displays the “percent of range” of the school’s values for the last three years. The percent of range reflects where the school’s value falls between the bottom and top of the range. In mathematical terms, percent of range = (school’s value – bottom of range) / (top of range – bottom of range). The colors to the right of the chart display the ranges for the various ratings. The range for Exceeding Target is shown in dark green, Meeting Target is shown in light green, Approaching Target is shown in orange, and Not Meeting Target is shown in red. 100%of range Average value among similar schools or city This school’s result 0%of range Exceeding Target Meeting Target Approaching Target Not Meeting Target 5
  • 6.
    Student Progress Student Progressincludes growth metrics based on how students improved on the state tests between 2013 and 2014. MEETING TARGET 6 English Median Adjusted Growth Percentile (n=371) Math Median Adjusted Growth Percentile (n=391) English Median Adjusted Growth Percentile - School's Lowest Third (n=118) Math Median Adjusted Growth Percentile - School's Lowest Third (n=130) This metric calculates the median adjusted growth percentile of a school’s eligible students. A student’s growth percentile compares his or her growth to the growth of all students in the City who started at the same level of proficiency the year before. This metric calculates the median adjusted growth percentile of a school’s eligible students. A student’s growth percentile compares his or her growth to the growth of all students in the City who started at the same level of proficiency the year before. This metric calculates the median adjusted growth percentile of a school’s lowest third of students in prior year English scores. A student’s growth percentile compares his or her growth to the growth of all students in the City who started at the same level of proficiency the year before. This metric calculates the median adjusted growth percentile of a school’s lowest third of students in prior year Math scores. A student’s growth percentile compares his or her growth to the growth of all students in the City who started at the same level of proficiency the year before. Peer Percent of Peer RangeSchool and Peer Values 51.0 70.0 67.0 0 20 40 60 80 100 2012 2013 2014 Peer 24% 51% 13% 0% 20% 40% 60% 80% 100% 2012 2013 2014 Percent of Peer RangeSchool and Peer Values 48.061.042.0 0 20 40 60 80 100 2012 2013 2014 Peer 72% 80% 23% 0% 20% 40% 60% 80% 100% 2012 2013 2014 Percent of Peer RangeSchool and Peer Values 82.587.062.0 0 20 40 60 80 100 2012 2013 2014 Peer 30% 52% 24% 0% 20% 40% 60% 80% 100% 2012 2013 2014 Percent of Peer RangeSchool and Peer Values 66.075.556.0 0 20 40 60 80 100 2012 2013 2014 City 63% 68% 14% 0% 20% 40% 60% 80% 100% 2012 2013 2014 Percent of City RangeSchool and City Values 67.070.051.0 0 20 40 60 80 100 2012 2013 2014 City 71% 78% 13% 0% 20% 40% 60% 80% 100% 2012 2013 2014 Percent of City RangeSchool and City Values 82.587.062.0 0 20 40 60 80 100 2012 2013 2014 City 16% 48% 14% 0% 20% 40% 60% 80% 100% 2012 2013 2014 Percent of City RangeSchool and City Values 48.061.042.0 0 20 40 60 80 100 2012 2013 2014 City 28% 53% 25% 0% 20% 40% 60% 80% 100% 2012 2013 2014 Percent of City RangeSchool and City Values 66.075.556.0 0 20 40 60 80 100 2012 2013 2014 71%71% 17% 0% 20% 40% 60% 80% 100% 2012 2013 2014
  • 7.
    Student Achievement 7 StudentAchievement is based on results on the 2014 state tests in English and Math, core course pass rates, and measures of next-level readiness. English - Percentage of Students at Level 3 or 4 (n=419) Math - Percentage of Students at Level 3 or 4 (n=445) English - Average Student Proficiency (n=419) Math - Average Student Proficiency (n=445) This metric shows the percentage of students who are performing at or above proficiency as defined by New York State on Common Core ELA exams in the current year. This is the percentage of students at either Level 3 (proficient) or Level 4 (advanced). This metric shows the percentage of students who are performing at or above proficiency as defined by New York State on Common Core math exams in the current year. This is the percentage of students at either Level 3 (proficient) or Level 4 (advanced). This metric represents the average (mean) Proficiency Rating in ELA for all students attributed to the school. The Average Proficiency Rating is measured on a scale of 1.00 to 4.50, and is based on students’ scale scores on the State exams in ELA. This metric represents the average (mean) Proficiency Rating in Math for all students attributed to the school. The Average Proficiency Rating is measured on a scale of 1.00 to 4.50, and is based on students’ scale scores on the State exams in Math. Peer Percent of Peer RangeSchool and Peer Values 24 11 10 0 20 40 60 80 100 2012 2013 2014 Peer 28% 31% 12% 0% 20% 40% 60% 80% 100% 2012 2013 2014 Percent of Peer RangeSchool and Peer Values 8930 0 20 40 60 80 100 2012 2013 2014 Peer 39% 26% 16% 0% 20% 40% 60% 80% 100% 2012 2013 2014 Percent of Peer RangeSchool and Peer Values 2.55 2.23 2.24 0 0.5 1 1.5 2 2.5 3 3.5 4 4.5 2012 2013 2014 Peer 29% 24% 9% 0% 20% 40% 60% 80% 100% 2012 2013 2014 Percent of Peer RangeSchool and Peer Values 2.122.122.66 0 0.5 1 1.5 2 2.5 3 3.5 4 4.5 2012 2013 2014 City 25%26% 35% 0% 20% 40% 60% 80% 100% 2012 2013 2014 Percent of City RangeSchool and City Values 101124 0 20 40 60 80 100 2012 2013 2014 City 38%37%38% 0% 20% 40% 60% 80% 100% 2012 2013 2014 Percent of City RangeSchool and City Values 2.242.232.55 0 0.5 1 1.5 2 2.5 3 3.5 4 4.5 2012 2013 2014 City 18%21% 28% 0% 20% 40% 60% 80% 100% 2012 2013 2014 Percent of City RangeSchool and City Values 8930 0 20 40 60 80 100 2012 2013 2014 City 31%31%28% 0% 20% 40% 60% 80% 100% 2012 2013 2014 Percent of City RangeSchool and City Values 2.122.122.66 0 0.5 1 1.5 2 2.5 3 3.5 4 4.5 2012 2013 2014 38% 30% 22% 0% 20% 40% 60% 80% 100% 2012 2013 2014 APPROACHING TARGET
  • 8.
    Student Achievement -continued 8 Student Achievement is based on results on the 2014 state tests in English and Math, core course pass rates, and measures of next-level readiness. APPROACHING TARGET Percent of Students Passing an English Course (n=437) Percent of Students Passing a Science Course (n=437) Percent of Students Passing a Social Studies Course (n=437) This metric indicates the percentage of students in 6th through 8th grade who received a passing grade in a full year course in English. This metric indicates the percentage of students in 6th through 8th grade who received a passing grade in a full year course in Science. This metric indicates the percentage of students in 6th through 8th grade who received a passing grade in a full year course in Social Studies. Peer Percent of Peer RangeSchool and Peer Values 85 89 94 0 20 40 60 80 100 2012 2013 2014 Peer 45% 0% 37% 0% 20% 40% 60% 80% 100% 2012 2013 2014 Percent of Peer RangeSchool and Peer Values 82 73 82 0 20 40 60 80 100 2012 2013 2014 Peer 78% 39% 16% 0% 20% 40% 60% 80% 100% 2012 2013 2014 Percent of Peer RangeSchool and Peer Values 948774 0 20 40 60 80 100 2012 2013 2014 Peer 81% 19% 5% 0% 20% 40% 60% 80% 100% 2012 2013 2014 Percent of Peer RangeSchool and Peer Values 948071 0 20 40 60 80 100 2012 2013 2014 City 83% 64% 52% 0% 20% 40% 60% 80% 100% 2012 2013 2014 Percent of City RangeSchool and City Values 948985 0 20 40 60 80 100 2012 2013 2014 City 80% 55% 20% 0% 20% 40% 60% 80% 100% 2012 2013 2014 Percent of City RangeSchool and City Values 948774 0 20 40 60 80 100 2012 2013 2014 City 49% 14% 47% 0% 20% 40% 60% 80% 100% 2012 2013 2014 Percent of City RangeSchool and City Values 827382 0 20 40 60 80 100 2012 2013 2014 City 84% 37% 9% 0% 20% 40% 60% 80% 100% 2012 2013 2014 Percent of City RangeSchool and City Values 948071 0 20 40 60 80 100 2012 2013 2014 80% 55% 39% 0% 20% 40% 60% 80% 100% 2012 2013 2014 Percent of Students Passing a Math Course (n=437) This metric indicates the percentage of students in 6th through 8th grade who received a passing grade in a full year course in Math.
  • 9.
    Student Achievement -continued 9 Student Achievement is based on results on the 2014 state tests in English and Math, core course pass rates, and measures of next-level readiness. APPROACHING TARGET Percent of 8th Graders Earning High School Credit (n=187) 9th Grade Adjusted Credit Accumulation of Former 8th Graders (n=181) This metric indicates the percentage of students in 6th through 8th grade who received a passing grade in a full year course in English. This metric indicates the percentage of students in 6th through 8th grade who received a passing grade in a full year course in Math. Peer Percent of Peer RangeSchool and Peer Values 0 21 17 0 20 40 60 80 100 2012 2013 2014 Peer 77% 57%57% 0% 20% 40% 60% 80% 100% 2012 2013 2014 Percent of Peer RangeSchool and Peer Values 908581 0 20 40 60 80 100 2012 2013 2014 City 33% 39% 1% 0% 20% 40% 60% 80% 100% 2012 2013 2014 Percent of City RangeSchool and City Values 17210 0 20 40 60 80 100 2012 2013 2014 City 74% 57%57% 0% 20% 40% 60% 80% 100% 2012 2013 2014 Percent of City RangeSchool and City Values 908581 0 20 40 60 80 100 2012 2013 2014 42%42% 1% 0% 20% 40% 60% 80% 100% 2012 2013 2014
  • 10.
    School Environment The NYCSchool Survey is administered annually to all parents, all teachers, and students in grades 6–12. Through the survey, these members of school communities respond to questions that gauge their satisfaction with elements of the school’s learning environment. In 2013–14 accountability reports, these responses were reorganized to broadly align to guiding concepts in the Quality Review rubric: the instructional core, school culture, and systems for improvement. Please note that this organization is designed to help school communities better interpret survey responses, but survey responses do not contribute to Quality Review ratings in these categories. APPROACHING TARGET 10 Survey Satisfaction - Instructional Core Survey Satisfaction - School Culture Survey Satisfaction - Systems for Improvement Attendance This metric shows the average percent of positive responses to the NYC School Survey questions related to the school's instructional core. This metric shows the average percent of positive responses to the NYC School Survey questions related to the school's culture. This metric shows the average percent of positive responses to the NYC School Survey questions related to the school's systems for improvement. The attendance rate includes the attendance for all K-8 students on a school's register at any point during the school year (September through June). Peer City Peer Peer Peer City City City 31% 0% 23% 0% 20% 40% 60% 80% 100% 2012 2013 2014 31% 16% 38% 0% 20% 40% 60% 80% 100% 2012 2013 2014 Percent of Peer Range Percent of City Range School and Peer Values School and City Values 91 89 90 60 70 80 90 100 2012 2013 2014 91 89 90 60 70 80 90 100 2012 2013 2014 29% 0% 20% 40% 60% 80% 100% 2012 2013 2014 29% 0% 20% 40% 60% 80% 100% 2012 2013 2014 Percent of Peer Range Percent of City Range School and Peer Values School and City Values 84 0 20 40 60 80 100 2012 2013 2014 84 0 20 40 60 80 100 2012 2013 2014 36% 0% 20% 40% 60% 80% 100% 2012 2013 2014 33% 0% 20% 40% 60% 80% 100% 2012 2013 2014 Percent of Peer Range Percent of City Range School and Peer Values School and City Values 82 0 20 40 60 80 100 2012 2013 2014 82 0 20 40 60 80 100 2012 2013 2014 31% 0% 20% 40% 60% 80% 100% 2012 2013 2014 30% 0% 20% 40% 60% 80% 100% 2012 2013 2014 Percent of Peer Range Percent of City Range School and Peer Values School and City Values 81 0 20 40 60 80 100 2012 2013 2014 81 0 20 40 60 80 100 2012 2013 2014
  • 11.
    Closing the AchievementGap Closing the Achivement Gap measures the extent to which the school serves and succeeds with students in special populations. APPROACHING TARGET 11 SCHOOL'S RESULTS POPULATION PERCENTAGE SCHOOL'S RESULTS POPULATION PERCENTAGE SCHOOL'S RESULTS POPULATION PERCENTAGE 2011-12 2012-13 2013-14 Percent at Level 3 or 4 English Self-Contained (n = 44) 3.0% 11.4% 1.8% 11.0% 2.3% 10.5% Integrated Co-Teaching (ICT) (n = 28) 0.0% 3.7% 0.0% 6.8% 0.0% 6.7% Special Education Teacher Support Services (SETSS) (n = 15) 0.0% 4.1% 0.0% 3.8% 0.0% 3.6% Mathematics Self-Contained (n = 42) 0.0% 11.3% 0.0% 10.6% 2.4% 9.4% Integrated Co-Teaching (ICT) (n = 28) 4.5% 3.6% 2.9% 6.6% 0.0% 6.3% Special Education Teacher Support Services (SETSS) (n = 15) 4.0% 4.1% 0.0% 3.7% 0.0% 3.4% Percent at 75th Growth Percentile or Higher English English Language Learners (n = 85) 29.4% 19.6% 42.2% 22.8% 51.8% 22.9% Lowest Third Citywide (n = 179) 33.9% 43.6% 61.1% 49.3% 53.6% 48.2% Self-Contained/ICT/SETSS (n = 80) 50.0% 19.2% 74.0% 22.3% 55.0% 21.6% Black and Hispanic Males in Lowest Third Citywide (n = 84) 36.1% 18.6% 67.3% 23.9% 50.0% 22.6% Mathematics English Language Learners (n = 105) 23.3% 21.6% 37.2% 25.7% 29.5% 26.9% Lowest Third Citywide (n = 193) 22.5% 50.5% 49.6% 51.5% 34.7% 49.4% Self-Contained/ICT/SETSS (n = 78) 21.8% 18.8% 56.9% 21.7% 48.7% 19.9% Black and Hispanic Males in Lowest Third Citywide (n = 72) 24.5% 20.5% 51.9% 23.0% 37.5% 18.4% Movement from SC/ICT/SETSS to Less Restrictive Environments (n = 70) 0.47 17.4% 0.28 18.3% 0.46 15.2% English Language Learner Progress (n = 95) 54.3% 16.6% 35.4% 14.6% 35.8% 20.7%
  • 12.
    Summary of SectionRatings This School's Results Percent of Peer Range Peer Comparison (weighted 75%) Points Possible Points Earned Peer Range 0% 100% Percent of City Range City Comparison (weighted 25%) City Range 0% 100% Student Progress Student Achievement School Environment Average Average This section shows how the ratings are calculated for the Student Progress, Student Achievement, School Environment, and Closing the Achievement Gap sections. 12 English Median Adjusted Growth Percentile (n = 371) 67.0 45.1 76.1 70.6% 49.4 77.4 62.9% 25.0 17.260.6 63.4 Math Median Adjusted Growth Percentile (n = 391) 48.0 37.0 82.4 24.2% 41.7 80.9 16.1% 25.0 5.559.7 61.3 English Median Adjusted Growth Percentile - School's Lowest Third (n = 118) 82.5 59.6 91.4 72.0% 62.7 90.7 70.7% 25.0 17.975.5 76.7 Math Median Adjusted Growth Percentile - School's Lowest Third (n = 130) 66.0 56.3 89.1 29.6% 56.8 89.4 28.2% 25.0 7.372.7 73.1 Student Progress Section Rating 47.9 Not Meeting Target 19.4 or Lower Approaching Target 19.5 to 47.7 Meeting Target 47.8 to 66.5 Exceeding Target 66.6 or Higher English - Percentage of Students at Level 3 or 4 (n = 419) 10.3% 2.9% 22.3% 38.1% 0.0% 40.6% 25.4% 19.0 6.612.6% 20.3% Math - Percentage of Students at Level 3 or 4 (n = 445) 8.3% 0.0% 29.4% 28.2% 0.0% 45.0% 18.4% 19.0 4.914.7% 22.5% English - Average Student Proficiency (n = 419) 2.24 2.06 2.52 39.1% 1.68 3.16 37.8% 19.0 7.42.29 2.42 Math - Average Student Proficiency (n = 445) 2.12 1.86 2.76 28.9% 1.57 3.33 31.3% 19.0 5.62.31 2.45 Percent of Students Passing an English Course (n = 437) 94.1% 70.5% 100.0% 80.0% 65.4% 100.0% 82.9% 4.0 3.287.5% 88.8% Percent of Students Passing a Math Course (n = 437) 82.4% 68.2% 100.0% 44.7% 65.6% 100.0% 48.8% 4.0 1.885.5% 87.7% Percent of Students Passing a Science Course (n = 437) 93.6% 71.6% 100.0% 77.5% 67.4% 100.0% 80.4% 4.0 3.187.8% 89.1% Percent of Students Passing a Social Studies Course (n = 437) 94.1% 68.5% 100.0% 81.3% 63.1% 100.0% 84.0% 4.0 3.387.1% 88.3% Percent of 8th Graders Earning High School Credit (n = 187) 17.1% 0.0% 41.2% 41.5% 0.0% 51.2% 33.4% 4.0 1.620.6% 25.6% 9th Grade Adjusted Credit Accumulation of Former 8th Graders (n = 181) 90.0% 56.0% 100.0% 77.3% 61.0% 100.0% 74.4% 4.0 3.181.0% 84.0% Student Achievement Section Rating 40.6 Not Meeting Target 28.3 or Lower Approaching Target 28.4 to 49.4 Meeting Target 49.5 to 73.0 Exceeding Target 73.1 or Higher School Survey - Instructional Core 84.1% 78.0% 99.0% 29.0% 77.7% 99.5% 29.4% 22.2 6.588.6%88.5% School Survey - School Culture 81.7% 72.8% 97.8% 35.6% 73.8% 98.0% 32.6% 22.2 7.785.9%85.3% School Survey - Structures for Improvement 81.4% 73.6% 98.6% 31.2% 73.7% 99.1% 30.3% 22.2 6.986.4%86.1% Attendance Rate 90.3% 87.9% 95.7% 30.8% 86.6% 98.4% 31.4% 33.3 10.392.5%91.8% School Environment Section Rating 31.4 Not Meeting Target 22.0 or Lower Approaching Target 22.1 to 46.4 Meeting Target 46.5 to 66.7 Exceeding Target 66.8 or Higher
  • 13.
    Summary of SectionRatings - continued This School's Population Percentage This School's Population Percentage (Percent of City Range) This School's Results (Percent of City Range) This School's Results Closing the Achievement Gap Closing the Achievement Gap 37.6 Not Meeting Target 19.1 or Lower Approaching Target 19.2 to 38.0 Meeting Target 38.1 to 60.2 Exceeding Target 60.3 or Higher This section shows how the ratings are calculated for the Student Progress, Student Achievement, School Environment, and Closing the Achievement Gap sections. Average of Results (Percent of City Range) This Closing the Achievement Gap section reflects the degree to which the school is helping high-need students succeed. In some cases, schools will not receive a rating in this section because those students make up a very small proportion of the school’s student population. The metric values, listed as “This School’s Results,” show the school’s results with its students in the relevant group. The metric scores, listed as “This School’s Results (Percent of City Range),” show how the school’s results compared to the rest of the city. A metric will not be scored, however, if those students are a very small proportion of the school—specifically, if “This School’s Population Percentage (Percent of City Range)” is less than 25.0% (meaning that the school’s population percentage is more than one standard deviation below the citywide average). For these unscored metrics, “This School’s Results (Percent of City Range)” will be left blank. The section score is the average of the school’s metric scores, and the section rating is determined by the range that the score falls within, which will be shaded in the ratings table above. A school will not receive a rating, however, if it has fewer than five scored metrics in this section. 13 Percent at Level 3 or 4 English Self-Contained (n = 44) 10.5% 2.3%50.2% 100.0% Integrated Co-Teaching (ICT) (n = 28) 6.7% 0.0%36.2% 0.0% Special Education Teacher Support Services (SETSS) (n = 15) 3.6% 0.0%35.3% 0.0% Mathematics Self-Contained (n = 42) 9.4% 2.4%45.2% 63.2% Integrated Co-Teaching (ICT) (n = 28) 6.3% 0.0%34.2% 0.0% Special Education Teacher Support Services (SETSS) (n = 15) 3.4% 0.0%33.7% 0.0% Percent at 75th Growth Percentile or Higher English English Language Learners (n = 85) 22.9% 51.8%48.9% 68.1% Lowest Third Citywide (n = 179) 48.2% 53.6%58.9% 53.6% Self-Contained/ICT/SETSS (n = 80) 21.6% 55.0%50.3% 48.3% Black and Hispanic Males in Lowest Third Citywide (n = 84) 22.6% 50.0%46.2% 46.8% Mathematics English Language Learners (n = 105) 26.9% 29.5%53.0% 31.7% Lowest Third Citywide (n = 193) 49.4% 34.7%58.9% 20.4% Self-Contained/ICT/SETSS (n = 78) 19.9% 48.7%46.7% 50.7% Black and Hispanic Males in Lowest Third Citywide (n = 72) 18.4% 37.5%37.6% 26.1% Movement from SC/ICT/SETSS to Less Restrictive Environments (n = 70) 15.2% 0.4643.7% 51.1% English Language Learner Progress (n = 95) 20.7% 35.8%56.7% 40.8%
  • 14.
    This page providesmore granular data on student outcomes. While the numbers here do not individually count for points, the detailed deconstruction should provide deeper insight into 2013–14 student outcomes. 6th Grade (n = 132) 2.08 6.1% 39.0 7th Grade (n = 120) 2.15 6.7% 65.5 8th Grade (n = 193) 2.13 10.9% 53.0 6th Grade (n = 130) 2.21 6.9% 60.0 7th Grade (n = 116) 2.23 14.7% 75.0 8th Grade (n = 173) 2.26 9.8% 64.5 State Exam Scores by Grade ALL SUBJECTS: 17.6% MATHEMATICS: 17.6% 97.0% SCIENCE: 16.0% 87.9% LANGUAGE OTHER THAN ENGLISH: 0.0% 100.0% . AVERAGE STUDENT PROFICIENCY PERCENTAGE OF STUDENTS AT LEVEL 3 OR LEVEL 4 MEDIAN ADJUSTED GROWTH PERCENTILE Mathematics English Science 17.1% 15.5% 16.0% 0.0% % of 8th Graders Earning High School Credit FORMULA: ( % taking accelerated courses ) X ( % taking accelerated courses who passed ) = % EARNING HIGH SCHOOL CREDIT ) = ) = ) = ) = ) X ( ) X ( ) X ( ) X ( ( ( ( ( THIS SCHOOL'S RESULTS PEER AVERAGE CITY AVERAGE 8th Grade (n = 187) 2.53 28.9% . Chronic Absenteeism 35.7%Students With Less Than 90% Attendance (n = 502) 23.4% PERCENTAGE OF STUDENTS SCHOOLWIDE AVERAGE OF SCHOOLS CITYWIDE English (n = 150 ) 50.0 56.5 61.1 Mathematics (n = 159 ) 40.0 55.6 58.9 Long-Term Growth Percentile High School Readiness Indicators Additional Information 14
  • 15.
    Peer Group Schools Eachschool's performance is compared to the performance of schools in its peer group. Peer schools are those New York City public schools with a student population most like this school's population, according to the peering characteristics. Each school has up to 40 peer schools (except for K-8 schools, which have up to 30 peer schools). Peer groupings are created using a matching methodology that examines the mathematical difference between a school and all potential peers on the peering characteristics. Schools with the smallest difference across all the characteristics are peered together. 15 DBN SCHOOL AVERAGE ENGLISH PROFICIENCY AVERAGE MATH PROFICIENCY % STUDENTS WITH DISABILITIES % OVERAGE 08X125 J.H.S. 125 Henry Hudson 2.37 2.59 21.4% 3.9% 03M421 West Prep Academy 2.29 2.41 22.0% 3.7% 04M825 Isaac Newton Middle School for Math & Science 2.40 2.66 24.7% 4.3% 08X131 J.H.S. 131 Albert Einstein 2.31 2.54 24.1% 5.4% 08X269 Bronx Studio School for Writers and Artists 2.30 2.52 23.6% 3.8% 08X562 Blueprint Middle School 2.31 2.58 24.4% 4.5% 09X231 Eagle Academy for Young Men 2.35 2.57 26.0% 3.5% 09X241 Urban Assembly School for Applied Math and Science, The 2.32 2.47 19.4% 2.3% 09X327 Comprehensive Model School Project M.S. 327 2.41 2.63 20.8% 3.1% 09X454 Science and Technology Academy: A Mott Hall School 2.44 2.58 20.9% 4.8% 10X368 In-Tech Academy (M.S. / High School 368) 2.39 2.61 20.2% 4.6% 11X326 Bronx Green Middle School 2.28 2.54 23.0% 3.2% 11X556 Bronx Park Middle School 2.32 2.52 18.5% 3.5% 12X242 Mott Hall V 2.35 2.64 21.8% 3.3% 12X286 Fannie Lou Hamer Middle School 2.27 2.43 23.5% 4.0% 12X316 Kappa III 2.46 2.62 20.1% 3.0% 13K103 Satellite Three 2.37 2.58 19.0% 3.4% 13K113 M.S. 113 Ronald Edmonds Learning Center 2.46 2.61 20.6% 3.8% 13K596 MS 596 Peace Academy 2.23 2.40 22.7% 4.5% 13K691 Fort Greene Preparatory Academy 2.40 2.58 21.8% 1.9% 16K393 Frederick Douglass Academy IV Secondary School 2.41 2.64 24.1% 3.4% 16K681 Madiba Prep Middle School 2.47 2.54 25.5% 4.2% 18K211 I.S. 211 John Wilson 2.45 2.55 21.5% 3.3% 21K096 I.S. 096 Seth Low 2.45 2.74 21.4% 3.0% 22K078 J.H.S. 078 Roy H. Mann 2.40 2.57 21.9% 2.7% 23K518 Kappa V 2.40 2.51 18.0% 3.0% 24Q077 I.S. 077 2.39 2.56 23.5% 2.5% 27Q226 J.H.S. 226 Virgil I. Grissom 2.43 2.64 19.9% 5.3% 27Q309 Academy of Medical Technology: A College Board School 2.40 2.58 21.5% 5.0% 28Q072 Catherine & Count Basie Middle School 72 2.39 2.53 20.6% 5.2% 29Q289 Queens United Middle School 2.43 2.41 20.0% 3.8% 29Q327 Eagle Academy for Young Men III 2.41 2.53 22.6% 1.9% 30Q126 Albert Shanker School for Visual and Performing Arts 2.34 2.55 20.7% 2.1% 30Q204 I.S. 204 Oliver W. Holmes 2.41 2.69 20.0% 4.3% 32K347 I.S. 347 School of Humanities 2.29 2.46 20.8% 3.8% 84K730 Summit Academy Charter School 2.35 2.53 21.7% 1.8% 84K757 Unity Prep Charter School 2.45 2.53 21.6% 3.6% 84M065 Democracy Prep Endurance Charter School 2.33 2.53 23.9% 5.0% 84M350 Democracy Prep Charter School 2.41 2.54 21.6% 4.0% 84X177 Mott Hall Charter School 2.39 2.54 24.3% 2.7% 84X488 The Equality Charter School 2.29 2.47 22.3% 2.1% 2.37 2.55 21.9% 3.6%PEER GROUP AVERAGES
  • 16.
    Metric Targets for2014-15 The previous pages in this report have shown the school's performance in 2013-14 and earlier. In contrast, this page is forward looking and shows targets connected to the category ratings for the 2014-15 school year. Not Meeting Target Approaching Target Meeting Target Exceeding Target 2014-15 Metric Values Needed for Each RatingThis School's 2013-14 Result Student Progress Student Achievement School Environment 16 English Median Adjusted Growth Percentile 67.0 52.1 to 60.6 60.7 to 66.3 66.4 or higher52.0 or lower Math Median Adjusted Growth Percentile 48.0 46.8 to 59.1 59.2 to 67.3 67.4 or higher46.7 or lower English Median Adjusted Growth Percentile - School's Lowest Third 82.5 66.4 to 75.1 75.2 to 80.8 80.9 or higher66.3 or lower Math Median Adjusted Growth Percentile - School's Lowest Third 66.0 62.8 to 72.0 72.1 to 78.1 78.2 or higher62.7 or lower English - Percentage of Students at Level 3 or 4 10.3% 8.8% to 13.4% 13.5% to 18.7% 18.8% or higher8.7% or lower Math - Percentage of Students at Level 3 or 4 8.3% 9.1% to 15.8% 15.9% to 23.4% 23.5% or higher9.0% or lower English - Average Student Proficiency 2.24 2.18 to 2.29 2.30 to 2.42 2.43 or higher2.17 or lower Math - Average Student Proficiency 2.12 2.11 to 2.32 2.33 to 2.56 2.57 or higher2.10 or lower Percent of Students Passing an English Course 94.1% 78.1% to 84.4% 84.5% to 91.7% 91.8% or higher78.0% or lower Percent of Students Passing a Math Course 82.4% 76.8% to 83.5% 83.6% to 91.2% 91.3% or higher76.7% or lower Percent of Students Passing a Science Course 93.6% 79.0% to 85.1% 85.2% to 92.0% 92.1% or higher78.9% or lower Percent of Students Passing a Social Studies Course 94.1% 76.6% to 83.4% 83.5% to 91.1% 91.2% or higher76.5% or lower Percent of 8th Graders Earning High School Credit 17.1% 12.3% to 21.3% 21.4% to 31.6% 31.7% or higher12.2% or lower 9th Grade Adjusted Credit Accumulation of Former 8th Graders 90.0% 69.0% to 77.9% 78.0% to 88.9% 89.0% or higher68.9% or lower School Survey - Instructional Core 84.1% 82.6% to 87.7% 87.8% to 92.0% 92.1% or higher82.5% or lower School Survey - School Culture 81.7% 78.5% to 84.5% 84.6% to 89.5% 89.6% or higher78.4% or lower School Survey - Structures for Improvement 81.4% 79.2% to 85.2% 85.3% to 90.3% 90.4% or higher79.1% or lower Attendance Rate 90.3% 89.5% to 91.5% 91.6% to 93.3% 93.4% or higher89.4% or lower
  • 17.
    Metric Targets for2014-15 - continued The previous pages in this report have shown the school's performance in 2013-14 and earlier. In contrast, this page is forward looking and shows targets connected to the category ratings for the 2014-15 school year. Not Meeting Target Approaching Target Meeting Target Exceeding Target 2014-15 Metric Values Needed for Each RatingThis School's 2013-14 Result Closing the Achievement Gap 17 Percent at Level 3 or 4 English Self-Contained 2.3% 0.4% to 0.7% 0.8% to 1.2% 1.3% or higher0.3% or lower Integrated Co-Teaching (ICT) 0.0% 1.6% to 3.1% 3.2% to 5.0% 5.1% or higher1.5% or lower Special Education Teacher Support Services (SETSS) 0.0% 2.6% to 5.1% 5.2% to 8.1% 8.2% or higher2.5% or lower Mathematics Self-Contained 2.4% 0.7% to 1.3% 1.4% to 2.2% 2.3% or higher0.6% or lower Integrated Co-Teaching (ICT) 0.0% 2.4% to 4.7% 4.8% to 7.5% 7.6% or higher2.3% or lower Special Education Teacher Support Services (SETSS) 0.0% 3.3% to 6.5% 6.6% to 10.3% 10.4% or higher3.2% or lower Percent at 75th Growth Percentile or Higher English English Language Learners 51.8% 27.0% to 36.5% 36.6% to 47.7% 47.8% or higher26.9% or lower Lowest Third Citywide 53.6% 39.4% to 47.1% 47.2% to 56.2% 56.3% or higher39.3% or lower Self-Contained/ICT/SETSS 55.0% 42.9% to 50.7% 50.8% to 59.9% 60.0% or higher42.8% or lower Black and Hispanic Males in Lowest Third Citywide 50.0% 38.0% to 46.1% 46.2% to 55.8% 55.9% or higher37.9% or lower Mathematics English Language Learners 29.5% 22.8% to 32.9% 33.0% to 44.9% 45.0% or higher22.7% or lower Lowest Third Citywide 34.7% 34.1% to 43.6% 43.7% to 54.8% 54.9% or higher34.0% or lower Self-Contained/ICT/SETSS 48.7% 34.5% to 42.9% 43.0% to 53.0% 53.1% or higher34.4% or lower Black and Hispanic Males in Lowest Third Citywide 37.5% 34.0% to 43.6% 43.7% to 55.0% 55.1% or higher33.9% or lower Movement from SC/ICT/SETSS to Less Restrictive Environments 0.46 0.17 to 0.33 0.34 to 0.53 0.54 or higher0.16 or lower English Language Learner Progress 35.8% 22.8% to 34.1% 34.2% to 47.4% 47.5% or higher22.7% or lower