SlideShare a Scribd company logo
1 of 31
AssessingthefullgreenhousegasbalanceofEUcountriesand
ecosystems
a first look at different emission
estimates and their uncertainties
A.M. Roxana Petrescu1,2, Han Dolman1, Efisio Solazzo2, Adrian
Leip2, Gert-Jan Nabuurs3, Mart-Jan Schelhaas3, Peter
Bergamaschi2, Giacomo Grassi2, Roberto Pilli2 and Glen Peters4
1 VUA- Vrije Universiteit Amsterdam, The Netherlands
2 JRC European Commission, Ispra, Italy
3 WUR - Wageningen University, The Netherlands
4 CICERO- Center for International Climate Research, Norway
“When the European balance is extended from CO2 towards the
main GHGs, C-uptake by terrestrial and aquatic ecosystems is
offset by emissions of non-CO2 GHGs.
As such, the European ecosystems are unlikely to contribute to
mitigating the effects of climate change.”
S. Luyssaert et al., 2012
(GCP - RECCAP)
Where we are…
• Countries report their greenhouse gas (GHG) emissions yearly to
UNFCCC
• The scientific community carries out measurements and is
running models to understand processes and quantify GHG
emissions and their uncertainties
• In February this year a new EU H2020 funded project started
http://verify.lsce.ipsl.fr/
What we do…
Assess the existing “best available/possible estimate” of country GHG
budgets from the climate perspective having UNFCCC as policy base
WP5: Reconciliation and
assessment of different
models and tools leading
to verification of GHG
inventories
Provide the process
through which different
scientific data-streams on
GHG budgets from other
WPs will be synthesized
for comparison with
official inventories aiming
to obtain the smallest
overall uncertainty
Illustration of the main land surface sources and sinks for CO2, CH4 and N2O GHGs for Europe.
Data sources - definitions
For CH4
• UNFCCC – United Nations Framework Convention on Climate Change
• FAO – The food and agriculture organization (UN)
• EDGAR – The Emissions Database for Global Atmospheric Research (EC-JRC
and PBL)
• CAPRI – Common Agricultural Policy Regionalised Impact model (EC-JRC)
• Inverse model ensemble
For N2O
• UNFCCC
• FAO
• EDGAR
• CAPRI
For Carbon (NBP – net biome productivity)
• UNFCCC
• EFISCEN - The European Forest Information SCENario Model (inventory-
based model Alterra & EFI)
• CBM – Carbon Budget Model (inventory-based model – EC-JRC)
Data sources
CH4: UNFCCC, EDGAR, CAPRI, Inverse ensemble
AGRICULTURE: Enteric fermentation (ENT), Manure management (MAN),
Rice cultivation
INVERSIONS
• EU28 and DEU, UK+IRL
N2O: UNFCCC, EDGAR, CAPRI, FAO
AGRICULTURE: Manure management, direct soil emissions, grazing and
indirect emissions
• DEU, GRC, ITA, NDL, POL, SWE
Years: 1990, 2000, 2010 and 2012
Carbon (NBP): UNFCCC vs EFISCEN vs CBM – forest remaining forest
• DEU, GRC, ITA, NDL, POL, SWE
Years: 2010 and 2015
Research questions
• Are all these different data sources linked and consistent in using
the input information (e.g. AD, EFs)?
• Are uncertainties calculated using the same methodology? What
causes the difference?
• What are countries reporting and what are they not?
• How can we calculate and choose the best estimate without
dismissing another and reduce the overall uncertainty to obtain
the minimum C budget for the atmosphere?
• Are all data sources suitable to be used for GHG calculations?
(e.g. UNFCCC, models, inventories)
Research questions
• Are all these different data sources linked and consistent in
using the input information (e.g. AD, EFs)?
• Are uncertainties calculated using the same methodology?
What causes the difference?
• What are countries reporting and what are they not?
• How can we calculate and choose the best estimate without
dismissing another and reduce the overall uncertainty to
obtain the minimum C budget for the atmosphere?
• Are all data sources suitable to be used for GHG calculations?
(e.g. UNFCCC, models, inventories)
CH4 ENT
(kg CH4 / head yr) UNFCCC EF
FAO EFs
all years
Countries 1990 2000 2010 2012
Germany 68.25 71.07 73.26 74.06 117
Greece 68.01 73.61 73.56 72.6 117
Italy 67.93 69.73 73.7 76.09 117
Netherlands 66.55 68.12 70.83 71.76 117
Poland 76.91 77.85 78.6 79.45 99
Sweden 67.14 69.57 69.02 68.93 117
Country choice for EFs for Enteric fermentation (ENT)
VariabilityofUNFCCCEFsusedforCH4 agriculture
EntericFermentation(ENT)andManureManagement(MAN)–Cattle
64
66
68
70
72
74
76
78
80
82
1985 1990 1995 2000 2005 2010 2015
EF(kgCH4/head/yr)
ENT
DEU
GRC
ITA
NDL
POL
SWE
0
2
4
6
8
10
12
14
16
18
20
1985 1990 1995 2000 2005 2010 2015
EF(kgCH4/head/yr)
MAN
DEU
GRC
ITA
NDL
POL
SWE
Choiceofactivitydata-PopulationDairyCattle
0
1000
2000
3000
4000
5000
6000
7000
0 2 4 6 8 10 12 14 16
Populationheads(1000s)
DEU
GRC
ITA
NLD
POL
SWE
FAO/EDGAR
UNFCCC
CAPRI
FAO/EDGAR
UNFCCC
CAPRI
FAO/EDGAR
UNFCCC
CAPRI
FAO/EDGAR
UNFCCC
CAPRI
1990 2000 2010 2012
0.00
2000.00
4000.00
6000.00
8000.00
10000.00
12000.00
14000.00
16000.00
1990 2000 2010 2012
CH4kt/yr Total EU28 Agriculture CH4 emissions
95% confidence interval
EDGAR
UNFCCC
CAPRI
mean
0
100
200
300
400
500
600
700
800
900
1000
1990 2000 2010 2012
N2Okt/yr
Total EU28 Agriculture N2O emissions
95% confidence interval
EDGAR
UNFCCC
CAPRI
mean
0
5000
10000
15000
20000
25000
30000
1990 2000 2010 2012
CH4kt/yr Total EU28 Agriculture CH4 emissions
95% confidence
interval
EDGAR
UNFCCC
CAPRI
mean
FAO
0
100
200
300
400
500
600
700
800
900
1000
1990 2000 2010 2012
N2Okt/yr
Total EU28 Agriculture N2O emissions 95% confidence
interval
UNFCCC
EDGAR
CAPRI
FAO
mean
Research questions
• Are all these different data sources linked and consistent in
using the input information (e.g. AD, EFs)?
• Are emissions calculated using the same methodology? What
causes the difference?
• What are countries reporting and what are they not?
• How can we calculate and choose the best estimate without
dismissing another and reduce the overall uncertainty to
obtain the minimum C budget for the atmosphere?
• Are all data sources suitable to be used for GHG calculations?
(e.g. UNFCCC, models, inventories)
-50
0
50
100
150
200
1990 2000 2010 2012
ktN2O/yr
MAN UNFCCC
MAN EDGAR
MAN CAPRI
DIR UNFCCC
DIR EDGAR
DIR CAPRI
DIR UNFCCC
GRA EDGAR
GRA CAPRI
GRA UNFCCC
IND EDGAR
IND CAPRI
IND FAO
0
200
400
600
800
1000
1200
1400
1600
1800
1990 2000 2010 2012
CH4kt/yr Germany - CH4 and N2O emissions from agricultural sub-sectors
ENT UNFCCC
ENT EDGAR
ENT CAPRI
ENT FAO
MAN UNFCCC
MAN EDGAR
MAN CAPRI
MAN FAO
Uncertaintybetweenuncertainties
0
500
1000
1500
2000
2500
3000
3500
2012
ktCH4/yr
Germany
CH4 from Agriculture - Enteric Fermentation
UNFCCC
EDGAR
CAPRI
FAO
CH4 from Inversions
• Inverse ensemble vs UNFCCC total CH4 (sectors 1, 2, 3 and 5)
• A posteriori emissions (inversions)
• Scenario S4 (2006-2012)
• Total CH4 emissions in Tg / yr
• Inversions compared to UNFCCC anthropogenic emissions-
uncorrelated uncertainties (sectors 1,2,3 and 5) calculated from
total sectoral EU28 uncertainty
• Uncertainty of inverse model - 1 sigma uncertainties as
provided by the data providers
0
5
10
15
20
25
30
35
2006 2007 2008 2009 2010 2011 2012
TgCH4/yr
Total EU28 CH4 emissions from Inversions
UNFCCC
NAT
TM5
LMDZ
STILT
NAME
TM5_CT
0
1
2
3
4
5
6
2006 2007 2008 2009 2010 2011 2012
TgCH4/yr
UK+IRL
UNFCCC
NAT
TM5 JRC
LMDZ
STILT
NAME
TM5-CT
0
0.5
1
1.5
2
2.5
3
3.5
4
4.5
5
2006 2007 2008 2009 2010 2011 2012
TgCH4/yr
Germany
UNFCCC
NAT
TM5
LMDZ
STILT
NAME
TM5-CT
CH4 from INVERSE, UNFCCC and Natural
Research questions
• Are all these different data sources linked and consistent in
using the input information (e.g. AD, EFs)?
• Are emissions calculated using the same methodology? What
causes the difference?
• What are countries reporting and what are they not?
• How can we calculate and choose the best estimate without
dismissing another and reduce the overall uncertainty to
obtain the minimum C budget for the atmosphere?
• Are all data sources suitable to be used for GHG calculations?
(e.g. UNFCCC, models, inventories)
-20
-10
0
10
20
30
40
50
1990 2000 2010 2012
ktN2O/yr
GRC
UNFCCC
EDGAR
CAPRI
N2O emissions from agricultural sub-sectors
-50
0
50
100
150
200
1990 2000 2010 2012
ktN2O/yr
DEU
Research questions
• Are all these different data sources linked and consistent in
using the input information (e.g. AD, EFs)?
• Are emissions calculated using the same methodology? What
causes the differences?
• What are countries reporting and what are they not?
• How can we calculate and choose the best estimate without
dismissing another and reduce the overall uncertainty to
obtain the minimum C budget for the atmosphere?
• Are all data sources suitable to be used for GHG calculations?
(e.g. UNFCCC, models, inventories)
Methods
Uncorrelated uncertainty calculation from the IPCC guidelines 2006: between
EDGAR and UNFCCC sectoral totals
Variance of the 95% confidence interval: in EDGAR and between different estimates
of same sector (e.g. Agriculture)
0
5000
10000
15000
20000
25000
30000
35000
UNFCCC
EDGAR
UNFCCC
EDGAR
UNFCCC
EDGAR
UNFCCC
EDGAR
UNFCCC
EDGAR
UNFCCC
EDGAR
UNFCCC
EDGAR
UNFCCC
EDGAR
UNFCCC
EDGAR
UNFCCC
EDGAR
UNFCCC
EDGAR
UNFCCC
EDGAR
UNFCCC
EDGAR
UNFCCC
EDGAR
UNFCCC
EDGAR
UNFCCC
EDGAR
UNFCCC
EDGAR
UNFCCC
EDGAR
UNFCCC
EDGAR
UNFCCC
EDGAR
UNFCCC
EDGAR
UNFCCC
EDGAR
UNFCCC
EDGAR
1990 1991 1992 1993 1994 1995 1996 1997 1998 1999 2000 2001 2002 2003 2004 2005 2006 2007 2008 2009 2010 20112012
ktCH4/yr
Total EU28 sectoral CH4 emissions
1A Energy Industries
1.B.1 Fugitive emissions from solid fuels
1.B.2 Fugitive emissions from oil and gas
2.B Chemical Industry
2.C Metal Industry
3.A Enteric Fermentation
3.B Manure management
3.C Rice Cultivation
5.A Solid Waste Disposal
5.D Wastewater Treatment and Discharge
0
2000
4000
6000
8000
10000
12000
14000
16000
Energy
Industries
Fugitive
emissions
from solid
fuels
Fugitive
emissions
from oil and
gas
Chemical
Industry
Metal
Industry
Enteric
Fermentation
Manure
management
Rice
Cultivation
Solid Waste
Disposal
Wastewater
Treatment
and Discharge
1A 1.B.1 1.B.2 2.B 2.C 3.A 3.B 3.C 5.A 5.D
2012
UNFCCC
2012
EDGAR
0
50
100
150
200
250
Chemical IndustryMetal IndustryRice Cultivation
2.B 2.C 3.C
CH4kt/yr
EU 28 total CH4 sectoral
emissions - 2012
2012
UNFCCC
2012
EDGAR
CH4 total sectoral emissions 2012
0
50
100
150
200
250
Chemical Industry Metal Industry Rice Cultivation
2.B 2.C 3.C
CH4kt/yr
Chemical industry, Metal Industry and Rice Cultivation 2012
2012
UNFCCC
2012
EDGAR
Research questions
• Are all these different data sources linked and consistent in
using the input information (e.g. AD, EFs)?
• Are emissions calculated using the same methodology? What
causes the difference?
• What are countries reporting and what are they not?
• How can we calculate and choose the best estimate without
dismissing another and reduce the overall uncertainty to
obtain the minimum C budget for the atmosphere?
• Are all data sources suitable to be used for GHG calculations?
(e.g. UNFCCC, models, inventories)
Carbon
NBP definitions
• UNFCCC NBP is = 'net change' in 'carbon stock change in living
biomass‘.
• CBM NBP is = the difference between NEP and the direct losses
due to harvest and natural disturbances (e.g., fires)
• EFISCEN NBP is derived from total tree gross growth minus soil
losses, minus (density related )mortality minus harvest.
Due to different ways in calculating the NBP we have to careful
when assessing their results:
UNFCCC vs EFISCEN vs CBM looking only forest land remaining
forest land
Units: tC / ha yr
UNFCCC–EFISCEN-CBM forestremainingforest
-2.5
-2
-1.5
-1
-0.5
0
0.5
tC/hayr
EFISCEN
UNFCCC
CBM
2010 2015
DEU GRC ITA NDL POL SWE DEU GRC ITA NDL POL SWE
We observed that…
CH4 & N2O: UNFCCC, EDGAR, CAPRI, Inverse models
• AD and EF are different
• Methodology for uncertainty calculation differ
• Countries do not report always same things
• Within models ensembles methods differ and uncertainties are
calculated different
Carbon (NBP)
• Definitions and sign conventions might differ
• Not always consistency in model set-up
What next…
We need
• more data and more uncertainties…
• to narrow down the analysis to sensitive
parameters (AD, EF) which may trigger the
differences
• to check for consistency in the way uncertainties
are calculated for different data sources
• to define a common methodology for overall
uncertainty calculation
To be continued….

More Related Content

What's hot

SESSION 4_Renaud Coulomb, LSE_Critical materials- CIRCLE workshop Oct. 2014
SESSION 4_Renaud Coulomb, LSE_Critical materials- CIRCLE workshop Oct. 2014SESSION 4_Renaud Coulomb, LSE_Critical materials- CIRCLE workshop Oct. 2014
SESSION 4_Renaud Coulomb, LSE_Critical materials- CIRCLE workshop Oct. 2014OECD Environment
 
Transparency of mitigation: lessons learned from Costa Rica, Pascal Girot CCX...
Transparency of mitigation: lessons learned from Costa Rica, Pascal Girot CCX...Transparency of mitigation: lessons learned from Costa Rica, Pascal Girot CCX...
Transparency of mitigation: lessons learned from Costa Rica, Pascal Girot CCX...OECD Environment
 
Roadmap to 2nd FREL
Roadmap to 2nd FRELRoadmap to 2nd FREL
Roadmap to 2nd FRELCIFOR-ICRAF
 
Benefits and Challenges of Implementing Carbon Capture and Sequestration Tech...
Benefits and Challenges of Implementing Carbon Capture and Sequestration Tech...Benefits and Challenges of Implementing Carbon Capture and Sequestration Tech...
Benefits and Challenges of Implementing Carbon Capture and Sequestration Tech...theijes
 
Towards healthy soils: Is soil contamination a real issue? Luca Montanarella...
Towards healthy soils: Is soil contamination a real issue?  Luca Montanarella...Towards healthy soils: Is soil contamination a real issue?  Luca Montanarella...
Towards healthy soils: Is soil contamination a real issue? Luca Montanarella...FAO
 
Times Spain: an analytical tool for energy policy assessment in Spain
Times Spain: an analytical tool for energy policy assessment in SpainTimes Spain: an analytical tool for energy policy assessment in Spain
Times Spain: an analytical tool for energy policy assessment in SpainIEA-ETSAP
 
SEEA Agriculture Forestry and Fisheries Accounting Tools: Accounting Exercises
SEEA Agriculture Forestry and Fisheries Accounting Tools: Accounting ExercisesSEEA Agriculture Forestry and Fisheries Accounting Tools: Accounting Exercises
SEEA Agriculture Forestry and Fisheries Accounting Tools: Accounting ExercisesFAO
 

What's hot (17)

tarekegne
 tarekegne tarekegne
tarekegne
 
Carbon footprint assessment and mitigation options of dairy under Chinese con...
Carbon footprint assessment and mitigation options of dairy under Chinese con...Carbon footprint assessment and mitigation options of dairy under Chinese con...
Carbon footprint assessment and mitigation options of dairy under Chinese con...
 
SESSION 4_Renaud Coulomb, LSE_Critical materials- CIRCLE workshop Oct. 2014
SESSION 4_Renaud Coulomb, LSE_Critical materials- CIRCLE workshop Oct. 2014SESSION 4_Renaud Coulomb, LSE_Critical materials- CIRCLE workshop Oct. 2014
SESSION 4_Renaud Coulomb, LSE_Critical materials- CIRCLE workshop Oct. 2014
 
14a Conferenza Nazionale di Statistica
14a Conferenza Nazionale di Statistica14a Conferenza Nazionale di Statistica
14a Conferenza Nazionale di Statistica
 
Transparency of mitigation: lessons learned from Costa Rica, Pascal Girot CCX...
Transparency of mitigation: lessons learned from Costa Rica, Pascal Girot CCX...Transparency of mitigation: lessons learned from Costa Rica, Pascal Girot CCX...
Transparency of mitigation: lessons learned from Costa Rica, Pascal Girot CCX...
 
Matthews incentivising climate smart agriculture on Irish farms
Matthews incentivising climate smart agriculture on Irish farmsMatthews incentivising climate smart agriculture on Irish farms
Matthews incentivising climate smart agriculture on Irish farms
 
Van Trinh GHG emission in agric Vietnam Nov 10 2014
Van Trinh GHG emission in agric Vietnam Nov 10 2014Van Trinh GHG emission in agric Vietnam Nov 10 2014
Van Trinh GHG emission in agric Vietnam Nov 10 2014
 
Roadmap to 2nd FREL
Roadmap to 2nd FRELRoadmap to 2nd FREL
Roadmap to 2nd FREL
 
Introduction to the Soil carbon sequestration in the Nationally Determined Co...
Introduction to the Soil carbon sequestration in the Nationally Determined Co...Introduction to the Soil carbon sequestration in the Nationally Determined Co...
Introduction to the Soil carbon sequestration in the Nationally Determined Co...
 
Benefits and Challenges of Implementing Carbon Capture and Sequestration Tech...
Benefits and Challenges of Implementing Carbon Capture and Sequestration Tech...Benefits and Challenges of Implementing Carbon Capture and Sequestration Tech...
Benefits and Challenges of Implementing Carbon Capture and Sequestration Tech...
 
14a Conferenza Nazionale di Statistica
14a Conferenza Nazionale di Statistica14a Conferenza Nazionale di Statistica
14a Conferenza Nazionale di Statistica
 
Towards healthy soils: Is soil contamination a real issue? Luca Montanarella...
Towards healthy soils: Is soil contamination a real issue?  Luca Montanarella...Towards healthy soils: Is soil contamination a real issue?  Luca Montanarella...
Towards healthy soils: Is soil contamination a real issue? Luca Montanarella...
 
UE INDC
UE INDCUE INDC
UE INDC
 
Soil carbon sequestration in the NDCs: Contributions from Japan | SOC in NDCs...
Soil carbon sequestration in the NDCs: Contributions from Japan | SOC in NDCs...Soil carbon sequestration in the NDCs: Contributions from Japan | SOC in NDCs...
Soil carbon sequestration in the NDCs: Contributions from Japan | SOC in NDCs...
 
Times Spain: an analytical tool for energy policy assessment in Spain
Times Spain: an analytical tool for energy policy assessment in SpainTimes Spain: an analytical tool for energy policy assessment in Spain
Times Spain: an analytical tool for energy policy assessment in Spain
 
Suzuki CDM methodologies for agriculture Nov 10 2014
Suzuki CDM methodologies for agriculture Nov 10 2014Suzuki CDM methodologies for agriculture Nov 10 2014
Suzuki CDM methodologies for agriculture Nov 10 2014
 
SEEA Agriculture Forestry and Fisheries Accounting Tools: Accounting Exercises
SEEA Agriculture Forestry and Fisheries Accounting Tools: Accounting ExercisesSEEA Agriculture Forestry and Fisheries Accounting Tools: Accounting Exercises
SEEA Agriculture Forestry and Fisheries Accounting Tools: Accounting Exercises
 

Similar to Assessing the full greenhouse gas balance of EU countries and ecosystems

Global Adipic Acid Market To Surpass US$ 12.12 Billion By 2025, Buoyed By Inc...
Global Adipic Acid Market To Surpass US$ 12.12 Billion By 2025, Buoyed By Inc...Global Adipic Acid Market To Surpass US$ 12.12 Billion By 2025, Buoyed By Inc...
Global Adipic Acid Market To Surpass US$ 12.12 Billion By 2025, Buoyed By Inc...Pareesh P
 
Rapport Commission européenne CO2
Rapport Commission européenne CO2Rapport Commission européenne CO2
Rapport Commission européenne CO2Paperjam_redaction
 
"Business as usual" baselines: Challenges for tracking NDCs by Andrew Prag
"Business as usual" baselines: Challenges for tracking NDCs by Andrew Prag"Business as usual" baselines: Challenges for tracking NDCs by Andrew Prag
"Business as usual" baselines: Challenges for tracking NDCs by Andrew PragOECD Environment
 
Waste: Local Actions with Global Effects
Waste: Local Actions with Global EffectsWaste: Local Actions with Global Effects
Waste: Local Actions with Global EffectsD-Waste
 
Ecological Footprint Atlas 2010
Ecological Footprint Atlas 2010Ecological Footprint Atlas 2010
Ecological Footprint Atlas 2010teknoport
 
Waste: Local Actions with Global Effects - David Newman
Waste: Local Actions with Global Effects - David Newman  Waste: Local Actions with Global Effects - David Newman
Waste: Local Actions with Global Effects - David Newman Humanidade2012
 
Ecological footprint atlas_2010
Ecological footprint atlas_2010Ecological footprint atlas_2010
Ecological footprint atlas_2010philipgeukens
 
Energy and environmental impacts of biomass use in the residential Sector: a ...
Energy and environmental impacts of biomass use in the residential Sector: a ...Energy and environmental impacts of biomass use in the residential Sector: a ...
Energy and environmental impacts of biomass use in the residential Sector: a ...IEA-ETSAP
 
Different approaches to estimating land GHG emissions: a crash course overview
Different approaches to estimating land GHG emissions: a crash course overviewDifferent approaches to estimating land GHG emissions: a crash course overview
Different approaches to estimating land GHG emissions: a crash course overviewipcc-media
 
United Nations Framework Convention on Climate Change
United Nations Framework Convention on Climate ChangeUnited Nations Framework Convention on Climate Change
United Nations Framework Convention on Climate Changebhavyarkrishnan2000
 
OECD Green Growth Policy Review of Indonesia 2019 - Launch presentation
OECD Green Growth Policy Review of Indonesia 2019 - Launch presentationOECD Green Growth Policy Review of Indonesia 2019 - Launch presentation
OECD Green Growth Policy Review of Indonesia 2019 - Launch presentationOECD Environment
 
Sanz sánchez, mª jose
Sanz sánchez, mª joseSanz sánchez, mª jose
Sanz sánchez, mª joseREMEDIAnetwork
 
Consumption-based approaches in climate policy - Glen Peters
Consumption-based approaches in climate policy - Glen PetersConsumption-based approaches in climate policy - Glen Peters
Consumption-based approaches in climate policy - Glen Peterstankesmedjanfores
 
The Paris meeting: the vision of an international power utility (BC3 Summer ...
The Paris meeting: the vision of an international power utility  (BC3 Summer ...The Paris meeting: the vision of an international power utility  (BC3 Summer ...
The Paris meeting: the vision of an international power utility (BC3 Summer ...BC3 - Basque Center for Climate Change
 
Remedia oecc vietnam julio 2014
Remedia oecc vietnam julio 2014Remedia oecc vietnam julio 2014
Remedia oecc vietnam julio 2014REMEDIAnetwork
 

Similar to Assessing the full greenhouse gas balance of EU countries and ecosystems (20)

Global Adipic Acid Market To Surpass US$ 12.12 Billion By 2025, Buoyed By Inc...
Global Adipic Acid Market To Surpass US$ 12.12 Billion By 2025, Buoyed By Inc...Global Adipic Acid Market To Surpass US$ 12.12 Billion By 2025, Buoyed By Inc...
Global Adipic Acid Market To Surpass US$ 12.12 Billion By 2025, Buoyed By Inc...
 
Examples of mitigation strategies in the Dutch dairy sector
Examples of mitigation strategies in the Dutch dairy sectorExamples of mitigation strategies in the Dutch dairy sector
Examples of mitigation strategies in the Dutch dairy sector
 
Rapport Commission européenne CO2
Rapport Commission européenne CO2Rapport Commission européenne CO2
Rapport Commission européenne CO2
 
"Business as usual" baselines: Challenges for tracking NDCs by Andrew Prag
"Business as usual" baselines: Challenges for tracking NDCs by Andrew Prag"Business as usual" baselines: Challenges for tracking NDCs by Andrew Prag
"Business as usual" baselines: Challenges for tracking NDCs by Andrew Prag
 
Waste: Local Actions with Global Effects
Waste: Local Actions with Global EffectsWaste: Local Actions with Global Effects
Waste: Local Actions with Global Effects
 
Ecological Footprint Atlas 2010
Ecological Footprint Atlas 2010Ecological Footprint Atlas 2010
Ecological Footprint Atlas 2010
 
Waste: Local Actions with Global Effects - David Newman
Waste: Local Actions with Global Effects - David Newman  Waste: Local Actions with Global Effects - David Newman
Waste: Local Actions with Global Effects - David Newman
 
Bottom-up and top-down methods in national GHG emission reporting
Bottom-up and top-down methods in national GHG emission reportingBottom-up and top-down methods in national GHG emission reporting
Bottom-up and top-down methods in national GHG emission reporting
 
MRV of soil organic carbon: Where are we and what is missing? | SOC in NDC we...
MRV of soil organic carbon: Where are we and what is missing? | SOC in NDC we...MRV of soil organic carbon: Where are we and what is missing? | SOC in NDC we...
MRV of soil organic carbon: Where are we and what is missing? | SOC in NDC we...
 
3 lago
3 lago3 lago
3 lago
 
Ecological footprint atlas_2010
Ecological footprint atlas_2010Ecological footprint atlas_2010
Ecological footprint atlas_2010
 
Energy and environmental impacts of biomass use in the residential Sector: a ...
Energy and environmental impacts of biomass use in the residential Sector: a ...Energy and environmental impacts of biomass use in the residential Sector: a ...
Energy and environmental impacts of biomass use in the residential Sector: a ...
 
Different approaches to estimating land GHG emissions: a crash course overview
Different approaches to estimating land GHG emissions: a crash course overviewDifferent approaches to estimating land GHG emissions: a crash course overview
Different approaches to estimating land GHG emissions: a crash course overview
 
United Nations Framework Convention on Climate Change
United Nations Framework Convention on Climate ChangeUnited Nations Framework Convention on Climate Change
United Nations Framework Convention on Climate Change
 
Zmiany klimatyczne: mity czy realia
Zmiany klimatyczne: mity czy realiaZmiany klimatyczne: mity czy realia
Zmiany klimatyczne: mity czy realia
 
OECD Green Growth Policy Review of Indonesia 2019 - Launch presentation
OECD Green Growth Policy Review of Indonesia 2019 - Launch presentationOECD Green Growth Policy Review of Indonesia 2019 - Launch presentation
OECD Green Growth Policy Review of Indonesia 2019 - Launch presentation
 
Sanz sánchez, mª jose
Sanz sánchez, mª joseSanz sánchez, mª jose
Sanz sánchez, mª jose
 
Consumption-based approaches in climate policy - Glen Peters
Consumption-based approaches in climate policy - Glen PetersConsumption-based approaches in climate policy - Glen Peters
Consumption-based approaches in climate policy - Glen Peters
 
The Paris meeting: the vision of an international power utility (BC3 Summer ...
The Paris meeting: the vision of an international power utility  (BC3 Summer ...The Paris meeting: the vision of an international power utility  (BC3 Summer ...
The Paris meeting: the vision of an international power utility (BC3 Summer ...
 
Remedia oecc vietnam julio 2014
Remedia oecc vietnam julio 2014Remedia oecc vietnam julio 2014
Remedia oecc vietnam julio 2014
 

More from Integrated Carbon Observation System (ICOS)

Kirtzel, Hans-Jürgen: FM-CW Wind Lidar “Wind Ranger” and Multi-Path Sonic “uS...
Kirtzel, Hans-Jürgen: FM-CW Wind Lidar “Wind Ranger” and Multi-Path Sonic “uS...Kirtzel, Hans-Jürgen: FM-CW Wind Lidar “Wind Ranger” and Multi-Path Sonic “uS...
Kirtzel, Hans-Jürgen: FM-CW Wind Lidar “Wind Ranger” and Multi-Path Sonic “uS...Integrated Carbon Observation System (ICOS)
 
Dukat, Paulina: How does drought impact water and carbon exchange in the temp...
Dukat, Paulina: How does drought impact water and carbon exchange in the temp...Dukat, Paulina: How does drought impact water and carbon exchange in the temp...
Dukat, Paulina: How does drought impact water and carbon exchange in the temp...Integrated Carbon Observation System (ICOS)
 
van Zwieten, Ruthger: Performance assessment of the mobile g4301 Cavity Ring-...
van Zwieten, Ruthger: Performance assessment of the mobile g4301 Cavity Ring-...van Zwieten, Ruthger: Performance assessment of the mobile g4301 Cavity Ring-...
van Zwieten, Ruthger: Performance assessment of the mobile g4301 Cavity Ring-...Integrated Carbon Observation System (ICOS)
 
McKinley, Galen: Physical knowledge to improve and extend machine learning pC...
McKinley, Galen: Physical knowledge to improve and extend machine learning pC...McKinley, Galen: Physical knowledge to improve and extend machine learning pC...
McKinley, Galen: Physical knowledge to improve and extend machine learning pC...Integrated Carbon Observation System (ICOS)
 
Kowalska, Natalia: Does Below-Above Canopy Air Mass Decoupling Impact Tempera...
Kowalska, Natalia: Does Below-Above Canopy Air Mass Decoupling Impact Tempera...Kowalska, Natalia: Does Below-Above Canopy Air Mass Decoupling Impact Tempera...
Kowalska, Natalia: Does Below-Above Canopy Air Mass Decoupling Impact Tempera...Integrated Carbon Observation System (ICOS)
 
Cinelli, Giorgia: Use of outdoor radon activity concentration and radon flux ...
Cinelli, Giorgia: Use of outdoor radon activity concentration and radon flux ...Cinelli, Giorgia: Use of outdoor radon activity concentration and radon flux ...
Cinelli, Giorgia: Use of outdoor radon activity concentration and radon flux ...Integrated Carbon Observation System (ICOS)
 
McKain, Kathryn: One year of aircraft vertical profile measurements of CO2, C...
McKain, Kathryn: One year of aircraft vertical profile measurements of CO2, C...McKain, Kathryn: One year of aircraft vertical profile measurements of CO2, C...
McKain, Kathryn: One year of aircraft vertical profile measurements of CO2, C...Integrated Carbon Observation System (ICOS)
 
Leseurre, Coraline: Investigation of the Suess Effect in the Southern Indian ...
Leseurre, Coraline: Investigation of the Suess Effect in the Southern Indian ...Leseurre, Coraline: Investigation of the Suess Effect in the Southern Indian ...
Leseurre, Coraline: Investigation of the Suess Effect in the Southern Indian ...Integrated Carbon Observation System (ICOS)
 
Havu, Minttu: Spatial variability of local carbon emissions and sinks in Hels...
Havu, Minttu: Spatial variability of local carbon emissions and sinks in Hels...Havu, Minttu: Spatial variability of local carbon emissions and sinks in Hels...
Havu, Minttu: Spatial variability of local carbon emissions and sinks in Hels...Integrated Carbon Observation System (ICOS)
 
Suto, Hiroshi: The Greenhouse gas Observations of Biospheric and Local Emissi...
Suto, Hiroshi: The Greenhouse gas Observations of Biospheric and Local Emissi...Suto, Hiroshi: The Greenhouse gas Observations of Biospheric and Local Emissi...
Suto, Hiroshi: The Greenhouse gas Observations of Biospheric and Local Emissi...Integrated Carbon Observation System (ICOS)
 
Moonen, Robbert: First results of CO2 and H2O isotope-Flux Measurements in th...
Moonen, Robbert: First results of CO2 and H2O isotope-Flux Measurements in th...Moonen, Robbert: First results of CO2 and H2O isotope-Flux Measurements in th...
Moonen, Robbert: First results of CO2 and H2O isotope-Flux Measurements in th...Integrated Carbon Observation System (ICOS)
 
Mikaloff-Fletcher, Sara: MethaneSAT: Towards detecting agricultural emissions...
Mikaloff-Fletcher, Sara: MethaneSAT: Towards detecting agricultural emissions...Mikaloff-Fletcher, Sara: MethaneSAT: Towards detecting agricultural emissions...
Mikaloff-Fletcher, Sara: MethaneSAT: Towards detecting agricultural emissions...Integrated Carbon Observation System (ICOS)
 
Leggett, Graham: LI-COR Trace Gas Analyzers - Applications for Measurements o...
Leggett, Graham: LI-COR Trace Gas Analyzers - Applications for Measurements o...Leggett, Graham: LI-COR Trace Gas Analyzers - Applications for Measurements o...
Leggett, Graham: LI-COR Trace Gas Analyzers - Applications for Measurements o...Integrated Carbon Observation System (ICOS)
 
Kikaj, Dafina: Importance of harmonizing radon datasets for reducing uncertai...
Kikaj, Dafina: Importance of harmonizing radon datasets for reducing uncertai...Kikaj, Dafina: Importance of harmonizing radon datasets for reducing uncertai...
Kikaj, Dafina: Importance of harmonizing radon datasets for reducing uncertai...Integrated Carbon Observation System (ICOS)
 
Grünwald, Thomas: Windthrow turns a former old spruce forest into a net CO2 s...
Grünwald, Thomas: Windthrow turns a former old spruce forest into a net CO2 s...Grünwald, Thomas: Windthrow turns a former old spruce forest into a net CO2 s...
Grünwald, Thomas: Windthrow turns a former old spruce forest into a net CO2 s...Integrated Carbon Observation System (ICOS)
 
Davis, Kenneth: Applications of eddy covariance flux measurements in quantify...
Davis, Kenneth: Applications of eddy covariance flux measurements in quantify...Davis, Kenneth: Applications of eddy covariance flux measurements in quantify...
Davis, Kenneth: Applications of eddy covariance flux measurements in quantify...Integrated Carbon Observation System (ICOS)
 

More from Integrated Carbon Observation System (ICOS) (20)

Röttger, Annette: Overview on radon metrology
Röttger, Annette:  Overview on radon metrologyRöttger, Annette:  Overview on radon metrology
Röttger, Annette: Overview on radon metrology
 
Kirtzel, Hans-Jürgen: FM-CW Wind Lidar “Wind Ranger” and Multi-Path Sonic “uS...
Kirtzel, Hans-Jürgen: FM-CW Wind Lidar “Wind Ranger” and Multi-Path Sonic “uS...Kirtzel, Hans-Jürgen: FM-CW Wind Lidar “Wind Ranger” and Multi-Path Sonic “uS...
Kirtzel, Hans-Jürgen: FM-CW Wind Lidar “Wind Ranger” and Multi-Path Sonic “uS...
 
Jocher, Georg: Addressing forest canopy decoupling on a global scale
Jocher, Georg: Addressing forest canopy decoupling on a global scaleJocher, Georg: Addressing forest canopy decoupling on a global scale
Jocher, Georg: Addressing forest canopy decoupling on a global scale
 
Dukat, Paulina: How does drought impact water and carbon exchange in the temp...
Dukat, Paulina: How does drought impact water and carbon exchange in the temp...Dukat, Paulina: How does drought impact water and carbon exchange in the temp...
Dukat, Paulina: How does drought impact water and carbon exchange in the temp...
 
van Zwieten, Ruthger: Performance assessment of the mobile g4301 Cavity Ring-...
van Zwieten, Ruthger: Performance assessment of the mobile g4301 Cavity Ring-...van Zwieten, Ruthger: Performance assessment of the mobile g4301 Cavity Ring-...
van Zwieten, Ruthger: Performance assessment of the mobile g4301 Cavity Ring-...
 
Vainio, Elisa: Carbon Action – Towards regenerative agriculture in Finland
Vainio, Elisa: Carbon Action – Towards regenerative agriculture in FinlandVainio, Elisa: Carbon Action – Towards regenerative agriculture in Finland
Vainio, Elisa: Carbon Action – Towards regenerative agriculture in Finland
 
McKinley, Galen: Physical knowledge to improve and extend machine learning pC...
McKinley, Galen: Physical knowledge to improve and extend machine learning pC...McKinley, Galen: Physical knowledge to improve and extend machine learning pC...
McKinley, Galen: Physical knowledge to improve and extend machine learning pC...
 
Kowalska, Natalia: Does Below-Above Canopy Air Mass Decoupling Impact Tempera...
Kowalska, Natalia: Does Below-Above Canopy Air Mass Decoupling Impact Tempera...Kowalska, Natalia: Does Below-Above Canopy Air Mass Decoupling Impact Tempera...
Kowalska, Natalia: Does Below-Above Canopy Air Mass Decoupling Impact Tempera...
 
Cinelli, Giorgia: Use of outdoor radon activity concentration and radon flux ...
Cinelli, Giorgia: Use of outdoor radon activity concentration and radon flux ...Cinelli, Giorgia: Use of outdoor radon activity concentration and radon flux ...
Cinelli, Giorgia: Use of outdoor radon activity concentration and radon flux ...
 
McKain, Kathryn: One year of aircraft vertical profile measurements of CO2, C...
McKain, Kathryn: One year of aircraft vertical profile measurements of CO2, C...McKain, Kathryn: One year of aircraft vertical profile measurements of CO2, C...
McKain, Kathryn: One year of aircraft vertical profile measurements of CO2, C...
 
Leseurre, Coraline: Investigation of the Suess Effect in the Southern Indian ...
Leseurre, Coraline: Investigation of the Suess Effect in the Southern Indian ...Leseurre, Coraline: Investigation of the Suess Effect in the Southern Indian ...
Leseurre, Coraline: Investigation of the Suess Effect in the Southern Indian ...
 
Havu, Minttu: Spatial variability of local carbon emissions and sinks in Hels...
Havu, Minttu: Spatial variability of local carbon emissions and sinks in Hels...Havu, Minttu: Spatial variability of local carbon emissions and sinks in Hels...
Havu, Minttu: Spatial variability of local carbon emissions and sinks in Hels...
 
Veerkamp, Hannes: Measurements of the CO2 gas transfer velocity in Jade Bay
Veerkamp, Hannes: Measurements of the CO2 gas transfer velocity in Jade BayVeerkamp, Hannes: Measurements of the CO2 gas transfer velocity in Jade Bay
Veerkamp, Hannes: Measurements of the CO2 gas transfer velocity in Jade Bay
 
Suto, Hiroshi: The Greenhouse gas Observations of Biospheric and Local Emissi...
Suto, Hiroshi: The Greenhouse gas Observations of Biospheric and Local Emissi...Suto, Hiroshi: The Greenhouse gas Observations of Biospheric and Local Emissi...
Suto, Hiroshi: The Greenhouse gas Observations of Biospheric and Local Emissi...
 
Moonen, Robbert: First results of CO2 and H2O isotope-Flux Measurements in th...
Moonen, Robbert: First results of CO2 and H2O isotope-Flux Measurements in th...Moonen, Robbert: First results of CO2 and H2O isotope-Flux Measurements in th...
Moonen, Robbert: First results of CO2 and H2O isotope-Flux Measurements in th...
 
Mikaloff-Fletcher, Sara: MethaneSAT: Towards detecting agricultural emissions...
Mikaloff-Fletcher, Sara: MethaneSAT: Towards detecting agricultural emissions...Mikaloff-Fletcher, Sara: MethaneSAT: Towards detecting agricultural emissions...
Mikaloff-Fletcher, Sara: MethaneSAT: Towards detecting agricultural emissions...
 
Leggett, Graham: LI-COR Trace Gas Analyzers - Applications for Measurements o...
Leggett, Graham: LI-COR Trace Gas Analyzers - Applications for Measurements o...Leggett, Graham: LI-COR Trace Gas Analyzers - Applications for Measurements o...
Leggett, Graham: LI-COR Trace Gas Analyzers - Applications for Measurements o...
 
Kikaj, Dafina: Importance of harmonizing radon datasets for reducing uncertai...
Kikaj, Dafina: Importance of harmonizing radon datasets for reducing uncertai...Kikaj, Dafina: Importance of harmonizing radon datasets for reducing uncertai...
Kikaj, Dafina: Importance of harmonizing radon datasets for reducing uncertai...
 
Grünwald, Thomas: Windthrow turns a former old spruce forest into a net CO2 s...
Grünwald, Thomas: Windthrow turns a former old spruce forest into a net CO2 s...Grünwald, Thomas: Windthrow turns a former old spruce forest into a net CO2 s...
Grünwald, Thomas: Windthrow turns a former old spruce forest into a net CO2 s...
 
Davis, Kenneth: Applications of eddy covariance flux measurements in quantify...
Davis, Kenneth: Applications of eddy covariance flux measurements in quantify...Davis, Kenneth: Applications of eddy covariance flux measurements in quantify...
Davis, Kenneth: Applications of eddy covariance flux measurements in quantify...
 

Recently uploaded

Traditional Agroforestry System in India- Shifting Cultivation, Taungya, Home...
Traditional Agroforestry System in India- Shifting Cultivation, Taungya, Home...Traditional Agroforestry System in India- Shifting Cultivation, Taungya, Home...
Traditional Agroforestry System in India- Shifting Cultivation, Taungya, Home...jana861314
 
SOLUBLE PATTERN RECOGNITION RECEPTORS.pptx
SOLUBLE PATTERN RECOGNITION RECEPTORS.pptxSOLUBLE PATTERN RECOGNITION RECEPTORS.pptx
SOLUBLE PATTERN RECOGNITION RECEPTORS.pptxkessiyaTpeter
 
Luciferase in rDNA technology (biotechnology).pptx
Luciferase in rDNA technology (biotechnology).pptxLuciferase in rDNA technology (biotechnology).pptx
Luciferase in rDNA technology (biotechnology).pptxAleenaTreesaSaji
 
Physiochemical properties of nanomaterials and its nanotoxicity.pptx
Physiochemical properties of nanomaterials and its nanotoxicity.pptxPhysiochemical properties of nanomaterials and its nanotoxicity.pptx
Physiochemical properties of nanomaterials and its nanotoxicity.pptxAArockiyaNisha
 
Biological Classification BioHack (3).pdf
Biological Classification BioHack (3).pdfBiological Classification BioHack (3).pdf
Biological Classification BioHack (3).pdfmuntazimhurra
 
NAVSEA PEO USC - Unmanned & Small Combatants 26Oct23.pdf
NAVSEA PEO USC - Unmanned & Small Combatants 26Oct23.pdfNAVSEA PEO USC - Unmanned & Small Combatants 26Oct23.pdf
NAVSEA PEO USC - Unmanned & Small Combatants 26Oct23.pdfWadeK3
 
Cultivation of KODO MILLET . made by Ghanshyam pptx
Cultivation of KODO MILLET . made by Ghanshyam pptxCultivation of KODO MILLET . made by Ghanshyam pptx
Cultivation of KODO MILLET . made by Ghanshyam pptxpradhanghanshyam7136
 
A relative description on Sonoporation.pdf
A relative description on Sonoporation.pdfA relative description on Sonoporation.pdf
A relative description on Sonoporation.pdfnehabiju2046
 
Call Girls in Munirka Delhi 💯Call Us 🔝8264348440🔝
Call Girls in Munirka Delhi 💯Call Us 🔝8264348440🔝Call Girls in Munirka Delhi 💯Call Us 🔝8264348440🔝
Call Girls in Munirka Delhi 💯Call Us 🔝8264348440🔝soniya singh
 
Boyles law module in the grade 10 science
Boyles law module in the grade 10 scienceBoyles law module in the grade 10 science
Boyles law module in the grade 10 sciencefloriejanemacaya1
 
Disentangling the origin of chemical differences using GHOST
Disentangling the origin of chemical differences using GHOSTDisentangling the origin of chemical differences using GHOST
Disentangling the origin of chemical differences using GHOSTSérgio Sacani
 
Is RISC-V ready for HPC workload? Maybe?
Is RISC-V ready for HPC workload? Maybe?Is RISC-V ready for HPC workload? Maybe?
Is RISC-V ready for HPC workload? Maybe?Patrick Diehl
 
Biopesticide (2).pptx .This slides helps to know the different types of biop...
Biopesticide (2).pptx  .This slides helps to know the different types of biop...Biopesticide (2).pptx  .This slides helps to know the different types of biop...
Biopesticide (2).pptx .This slides helps to know the different types of biop...RohitNehra6
 
Stunning ➥8448380779▻ Call Girls In Panchshil Enclave Delhi NCR
Stunning ➥8448380779▻ Call Girls In Panchshil Enclave Delhi NCRStunning ➥8448380779▻ Call Girls In Panchshil Enclave Delhi NCR
Stunning ➥8448380779▻ Call Girls In Panchshil Enclave Delhi NCRDelhi Call girls
 
zoogeography of pakistan.pptx fauna of Pakistan
zoogeography of pakistan.pptx fauna of Pakistanzoogeography of pakistan.pptx fauna of Pakistan
zoogeography of pakistan.pptx fauna of Pakistanzohaibmir069
 
Nightside clouds and disequilibrium chemistry on the hot Jupiter WASP-43b
Nightside clouds and disequilibrium chemistry on the hot Jupiter WASP-43bNightside clouds and disequilibrium chemistry on the hot Jupiter WASP-43b
Nightside clouds and disequilibrium chemistry on the hot Jupiter WASP-43bSérgio Sacani
 
Analytical Profile of Coleus Forskohlii | Forskolin .pdf
Analytical Profile of Coleus Forskohlii | Forskolin .pdfAnalytical Profile of Coleus Forskohlii | Forskolin .pdf
Analytical Profile of Coleus Forskohlii | Forskolin .pdfSwapnil Therkar
 

Recently uploaded (20)

Engler and Prantl system of classification in plant taxonomy
Engler and Prantl system of classification in plant taxonomyEngler and Prantl system of classification in plant taxonomy
Engler and Prantl system of classification in plant taxonomy
 
Traditional Agroforestry System in India- Shifting Cultivation, Taungya, Home...
Traditional Agroforestry System in India- Shifting Cultivation, Taungya, Home...Traditional Agroforestry System in India- Shifting Cultivation, Taungya, Home...
Traditional Agroforestry System in India- Shifting Cultivation, Taungya, Home...
 
SOLUBLE PATTERN RECOGNITION RECEPTORS.pptx
SOLUBLE PATTERN RECOGNITION RECEPTORS.pptxSOLUBLE PATTERN RECOGNITION RECEPTORS.pptx
SOLUBLE PATTERN RECOGNITION RECEPTORS.pptx
 
Luciferase in rDNA technology (biotechnology).pptx
Luciferase in rDNA technology (biotechnology).pptxLuciferase in rDNA technology (biotechnology).pptx
Luciferase in rDNA technology (biotechnology).pptx
 
Physiochemical properties of nanomaterials and its nanotoxicity.pptx
Physiochemical properties of nanomaterials and its nanotoxicity.pptxPhysiochemical properties of nanomaterials and its nanotoxicity.pptx
Physiochemical properties of nanomaterials and its nanotoxicity.pptx
 
Biological Classification BioHack (3).pdf
Biological Classification BioHack (3).pdfBiological Classification BioHack (3).pdf
Biological Classification BioHack (3).pdf
 
NAVSEA PEO USC - Unmanned & Small Combatants 26Oct23.pdf
NAVSEA PEO USC - Unmanned & Small Combatants 26Oct23.pdfNAVSEA PEO USC - Unmanned & Small Combatants 26Oct23.pdf
NAVSEA PEO USC - Unmanned & Small Combatants 26Oct23.pdf
 
Cultivation of KODO MILLET . made by Ghanshyam pptx
Cultivation of KODO MILLET . made by Ghanshyam pptxCultivation of KODO MILLET . made by Ghanshyam pptx
Cultivation of KODO MILLET . made by Ghanshyam pptx
 
The Philosophy of Science
The Philosophy of ScienceThe Philosophy of Science
The Philosophy of Science
 
A relative description on Sonoporation.pdf
A relative description on Sonoporation.pdfA relative description on Sonoporation.pdf
A relative description on Sonoporation.pdf
 
Call Girls in Munirka Delhi 💯Call Us 🔝8264348440🔝
Call Girls in Munirka Delhi 💯Call Us 🔝8264348440🔝Call Girls in Munirka Delhi 💯Call Us 🔝8264348440🔝
Call Girls in Munirka Delhi 💯Call Us 🔝8264348440🔝
 
Boyles law module in the grade 10 science
Boyles law module in the grade 10 scienceBoyles law module in the grade 10 science
Boyles law module in the grade 10 science
 
Disentangling the origin of chemical differences using GHOST
Disentangling the origin of chemical differences using GHOSTDisentangling the origin of chemical differences using GHOST
Disentangling the origin of chemical differences using GHOST
 
Is RISC-V ready for HPC workload? Maybe?
Is RISC-V ready for HPC workload? Maybe?Is RISC-V ready for HPC workload? Maybe?
Is RISC-V ready for HPC workload? Maybe?
 
9953056974 Young Call Girls In Mahavir enclave Indian Quality Escort service
9953056974 Young Call Girls In Mahavir enclave Indian Quality Escort service9953056974 Young Call Girls In Mahavir enclave Indian Quality Escort service
9953056974 Young Call Girls In Mahavir enclave Indian Quality Escort service
 
Biopesticide (2).pptx .This slides helps to know the different types of biop...
Biopesticide (2).pptx  .This slides helps to know the different types of biop...Biopesticide (2).pptx  .This slides helps to know the different types of biop...
Biopesticide (2).pptx .This slides helps to know the different types of biop...
 
Stunning ➥8448380779▻ Call Girls In Panchshil Enclave Delhi NCR
Stunning ➥8448380779▻ Call Girls In Panchshil Enclave Delhi NCRStunning ➥8448380779▻ Call Girls In Panchshil Enclave Delhi NCR
Stunning ➥8448380779▻ Call Girls In Panchshil Enclave Delhi NCR
 
zoogeography of pakistan.pptx fauna of Pakistan
zoogeography of pakistan.pptx fauna of Pakistanzoogeography of pakistan.pptx fauna of Pakistan
zoogeography of pakistan.pptx fauna of Pakistan
 
Nightside clouds and disequilibrium chemistry on the hot Jupiter WASP-43b
Nightside clouds and disequilibrium chemistry on the hot Jupiter WASP-43bNightside clouds and disequilibrium chemistry on the hot Jupiter WASP-43b
Nightside clouds and disequilibrium chemistry on the hot Jupiter WASP-43b
 
Analytical Profile of Coleus Forskohlii | Forskolin .pdf
Analytical Profile of Coleus Forskohlii | Forskolin .pdfAnalytical Profile of Coleus Forskohlii | Forskolin .pdf
Analytical Profile of Coleus Forskohlii | Forskolin .pdf
 

Assessing the full greenhouse gas balance of EU countries and ecosystems

  • 1. AssessingthefullgreenhousegasbalanceofEUcountriesand ecosystems a first look at different emission estimates and their uncertainties A.M. Roxana Petrescu1,2, Han Dolman1, Efisio Solazzo2, Adrian Leip2, Gert-Jan Nabuurs3, Mart-Jan Schelhaas3, Peter Bergamaschi2, Giacomo Grassi2, Roberto Pilli2 and Glen Peters4 1 VUA- Vrije Universiteit Amsterdam, The Netherlands 2 JRC European Commission, Ispra, Italy 3 WUR - Wageningen University, The Netherlands 4 CICERO- Center for International Climate Research, Norway
  • 2. “When the European balance is extended from CO2 towards the main GHGs, C-uptake by terrestrial and aquatic ecosystems is offset by emissions of non-CO2 GHGs. As such, the European ecosystems are unlikely to contribute to mitigating the effects of climate change.” S. Luyssaert et al., 2012 (GCP - RECCAP)
  • 3. Where we are… • Countries report their greenhouse gas (GHG) emissions yearly to UNFCCC • The scientific community carries out measurements and is running models to understand processes and quantify GHG emissions and their uncertainties • In February this year a new EU H2020 funded project started http://verify.lsce.ipsl.fr/
  • 4. What we do… Assess the existing “best available/possible estimate” of country GHG budgets from the climate perspective having UNFCCC as policy base WP5: Reconciliation and assessment of different models and tools leading to verification of GHG inventories Provide the process through which different scientific data-streams on GHG budgets from other WPs will be synthesized for comparison with official inventories aiming to obtain the smallest overall uncertainty Illustration of the main land surface sources and sinks for CO2, CH4 and N2O GHGs for Europe.
  • 5. Data sources - definitions For CH4 • UNFCCC – United Nations Framework Convention on Climate Change • FAO – The food and agriculture organization (UN) • EDGAR – The Emissions Database for Global Atmospheric Research (EC-JRC and PBL) • CAPRI – Common Agricultural Policy Regionalised Impact model (EC-JRC) • Inverse model ensemble For N2O • UNFCCC • FAO • EDGAR • CAPRI For Carbon (NBP – net biome productivity) • UNFCCC • EFISCEN - The European Forest Information SCENario Model (inventory- based model Alterra & EFI) • CBM – Carbon Budget Model (inventory-based model – EC-JRC)
  • 6. Data sources CH4: UNFCCC, EDGAR, CAPRI, Inverse ensemble AGRICULTURE: Enteric fermentation (ENT), Manure management (MAN), Rice cultivation INVERSIONS • EU28 and DEU, UK+IRL N2O: UNFCCC, EDGAR, CAPRI, FAO AGRICULTURE: Manure management, direct soil emissions, grazing and indirect emissions • DEU, GRC, ITA, NDL, POL, SWE Years: 1990, 2000, 2010 and 2012 Carbon (NBP): UNFCCC vs EFISCEN vs CBM – forest remaining forest • DEU, GRC, ITA, NDL, POL, SWE Years: 2010 and 2015
  • 7. Research questions • Are all these different data sources linked and consistent in using the input information (e.g. AD, EFs)? • Are uncertainties calculated using the same methodology? What causes the difference? • What are countries reporting and what are they not? • How can we calculate and choose the best estimate without dismissing another and reduce the overall uncertainty to obtain the minimum C budget for the atmosphere? • Are all data sources suitable to be used for GHG calculations? (e.g. UNFCCC, models, inventories)
  • 8. Research questions • Are all these different data sources linked and consistent in using the input information (e.g. AD, EFs)? • Are uncertainties calculated using the same methodology? What causes the difference? • What are countries reporting and what are they not? • How can we calculate and choose the best estimate without dismissing another and reduce the overall uncertainty to obtain the minimum C budget for the atmosphere? • Are all data sources suitable to be used for GHG calculations? (e.g. UNFCCC, models, inventories)
  • 9. CH4 ENT (kg CH4 / head yr) UNFCCC EF FAO EFs all years Countries 1990 2000 2010 2012 Germany 68.25 71.07 73.26 74.06 117 Greece 68.01 73.61 73.56 72.6 117 Italy 67.93 69.73 73.7 76.09 117 Netherlands 66.55 68.12 70.83 71.76 117 Poland 76.91 77.85 78.6 79.45 99 Sweden 67.14 69.57 69.02 68.93 117 Country choice for EFs for Enteric fermentation (ENT)
  • 10. VariabilityofUNFCCCEFsusedforCH4 agriculture EntericFermentation(ENT)andManureManagement(MAN)–Cattle 64 66 68 70 72 74 76 78 80 82 1985 1990 1995 2000 2005 2010 2015 EF(kgCH4/head/yr) ENT DEU GRC ITA NDL POL SWE 0 2 4 6 8 10 12 14 16 18 20 1985 1990 1995 2000 2005 2010 2015 EF(kgCH4/head/yr) MAN DEU GRC ITA NDL POL SWE
  • 11. Choiceofactivitydata-PopulationDairyCattle 0 1000 2000 3000 4000 5000 6000 7000 0 2 4 6 8 10 12 14 16 Populationheads(1000s) DEU GRC ITA NLD POL SWE FAO/EDGAR UNFCCC CAPRI FAO/EDGAR UNFCCC CAPRI FAO/EDGAR UNFCCC CAPRI FAO/EDGAR UNFCCC CAPRI 1990 2000 2010 2012
  • 12. 0.00 2000.00 4000.00 6000.00 8000.00 10000.00 12000.00 14000.00 16000.00 1990 2000 2010 2012 CH4kt/yr Total EU28 Agriculture CH4 emissions 95% confidence interval EDGAR UNFCCC CAPRI mean 0 100 200 300 400 500 600 700 800 900 1000 1990 2000 2010 2012 N2Okt/yr Total EU28 Agriculture N2O emissions 95% confidence interval EDGAR UNFCCC CAPRI mean
  • 13. 0 5000 10000 15000 20000 25000 30000 1990 2000 2010 2012 CH4kt/yr Total EU28 Agriculture CH4 emissions 95% confidence interval EDGAR UNFCCC CAPRI mean FAO 0 100 200 300 400 500 600 700 800 900 1000 1990 2000 2010 2012 N2Okt/yr Total EU28 Agriculture N2O emissions 95% confidence interval UNFCCC EDGAR CAPRI FAO mean
  • 14. Research questions • Are all these different data sources linked and consistent in using the input information (e.g. AD, EFs)? • Are emissions calculated using the same methodology? What causes the difference? • What are countries reporting and what are they not? • How can we calculate and choose the best estimate without dismissing another and reduce the overall uncertainty to obtain the minimum C budget for the atmosphere? • Are all data sources suitable to be used for GHG calculations? (e.g. UNFCCC, models, inventories)
  • 15. -50 0 50 100 150 200 1990 2000 2010 2012 ktN2O/yr MAN UNFCCC MAN EDGAR MAN CAPRI DIR UNFCCC DIR EDGAR DIR CAPRI DIR UNFCCC GRA EDGAR GRA CAPRI GRA UNFCCC IND EDGAR IND CAPRI IND FAO 0 200 400 600 800 1000 1200 1400 1600 1800 1990 2000 2010 2012 CH4kt/yr Germany - CH4 and N2O emissions from agricultural sub-sectors ENT UNFCCC ENT EDGAR ENT CAPRI ENT FAO MAN UNFCCC MAN EDGAR MAN CAPRI MAN FAO
  • 17. CH4 from Inversions • Inverse ensemble vs UNFCCC total CH4 (sectors 1, 2, 3 and 5) • A posteriori emissions (inversions) • Scenario S4 (2006-2012) • Total CH4 emissions in Tg / yr • Inversions compared to UNFCCC anthropogenic emissions- uncorrelated uncertainties (sectors 1,2,3 and 5) calculated from total sectoral EU28 uncertainty • Uncertainty of inverse model - 1 sigma uncertainties as provided by the data providers
  • 18. 0 5 10 15 20 25 30 35 2006 2007 2008 2009 2010 2011 2012 TgCH4/yr Total EU28 CH4 emissions from Inversions UNFCCC NAT TM5 LMDZ STILT NAME TM5_CT
  • 19. 0 1 2 3 4 5 6 2006 2007 2008 2009 2010 2011 2012 TgCH4/yr UK+IRL UNFCCC NAT TM5 JRC LMDZ STILT NAME TM5-CT 0 0.5 1 1.5 2 2.5 3 3.5 4 4.5 5 2006 2007 2008 2009 2010 2011 2012 TgCH4/yr Germany UNFCCC NAT TM5 LMDZ STILT NAME TM5-CT CH4 from INVERSE, UNFCCC and Natural
  • 20. Research questions • Are all these different data sources linked and consistent in using the input information (e.g. AD, EFs)? • Are emissions calculated using the same methodology? What causes the difference? • What are countries reporting and what are they not? • How can we calculate and choose the best estimate without dismissing another and reduce the overall uncertainty to obtain the minimum C budget for the atmosphere? • Are all data sources suitable to be used for GHG calculations? (e.g. UNFCCC, models, inventories)
  • 21. -20 -10 0 10 20 30 40 50 1990 2000 2010 2012 ktN2O/yr GRC UNFCCC EDGAR CAPRI N2O emissions from agricultural sub-sectors -50 0 50 100 150 200 1990 2000 2010 2012 ktN2O/yr DEU
  • 22. Research questions • Are all these different data sources linked and consistent in using the input information (e.g. AD, EFs)? • Are emissions calculated using the same methodology? What causes the differences? • What are countries reporting and what are they not? • How can we calculate and choose the best estimate without dismissing another and reduce the overall uncertainty to obtain the minimum C budget for the atmosphere? • Are all data sources suitable to be used for GHG calculations? (e.g. UNFCCC, models, inventories)
  • 23. Methods Uncorrelated uncertainty calculation from the IPCC guidelines 2006: between EDGAR and UNFCCC sectoral totals Variance of the 95% confidence interval: in EDGAR and between different estimates of same sector (e.g. Agriculture)
  • 24. 0 5000 10000 15000 20000 25000 30000 35000 UNFCCC EDGAR UNFCCC EDGAR UNFCCC EDGAR UNFCCC EDGAR UNFCCC EDGAR UNFCCC EDGAR UNFCCC EDGAR UNFCCC EDGAR UNFCCC EDGAR UNFCCC EDGAR UNFCCC EDGAR UNFCCC EDGAR UNFCCC EDGAR UNFCCC EDGAR UNFCCC EDGAR UNFCCC EDGAR UNFCCC EDGAR UNFCCC EDGAR UNFCCC EDGAR UNFCCC EDGAR UNFCCC EDGAR UNFCCC EDGAR UNFCCC EDGAR 1990 1991 1992 1993 1994 1995 1996 1997 1998 1999 2000 2001 2002 2003 2004 2005 2006 2007 2008 2009 2010 20112012 ktCH4/yr Total EU28 sectoral CH4 emissions 1A Energy Industries 1.B.1 Fugitive emissions from solid fuels 1.B.2 Fugitive emissions from oil and gas 2.B Chemical Industry 2.C Metal Industry 3.A Enteric Fermentation 3.B Manure management 3.C Rice Cultivation 5.A Solid Waste Disposal 5.D Wastewater Treatment and Discharge
  • 25. 0 2000 4000 6000 8000 10000 12000 14000 16000 Energy Industries Fugitive emissions from solid fuels Fugitive emissions from oil and gas Chemical Industry Metal Industry Enteric Fermentation Manure management Rice Cultivation Solid Waste Disposal Wastewater Treatment and Discharge 1A 1.B.1 1.B.2 2.B 2.C 3.A 3.B 3.C 5.A 5.D 2012 UNFCCC 2012 EDGAR 0 50 100 150 200 250 Chemical IndustryMetal IndustryRice Cultivation 2.B 2.C 3.C CH4kt/yr EU 28 total CH4 sectoral emissions - 2012 2012 UNFCCC 2012 EDGAR CH4 total sectoral emissions 2012 0 50 100 150 200 250 Chemical Industry Metal Industry Rice Cultivation 2.B 2.C 3.C CH4kt/yr Chemical industry, Metal Industry and Rice Cultivation 2012 2012 UNFCCC 2012 EDGAR
  • 26. Research questions • Are all these different data sources linked and consistent in using the input information (e.g. AD, EFs)? • Are emissions calculated using the same methodology? What causes the difference? • What are countries reporting and what are they not? • How can we calculate and choose the best estimate without dismissing another and reduce the overall uncertainty to obtain the minimum C budget for the atmosphere? • Are all data sources suitable to be used for GHG calculations? (e.g. UNFCCC, models, inventories)
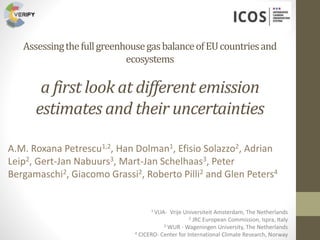
  • 27. Carbon NBP definitions • UNFCCC NBP is = 'net change' in 'carbon stock change in living biomass‘. • CBM NBP is = the difference between NEP and the direct losses due to harvest and natural disturbances (e.g., fires) • EFISCEN NBP is derived from total tree gross growth minus soil losses, minus (density related )mortality minus harvest. Due to different ways in calculating the NBP we have to careful when assessing their results: UNFCCC vs EFISCEN vs CBM looking only forest land remaining forest land Units: tC / ha yr
  • 29. We observed that… CH4 & N2O: UNFCCC, EDGAR, CAPRI, Inverse models • AD and EF are different • Methodology for uncertainty calculation differ • Countries do not report always same things • Within models ensembles methods differ and uncertainties are calculated different Carbon (NBP) • Definitions and sign conventions might differ • Not always consistency in model set-up
  • 30. What next… We need • more data and more uncertainties… • to narrow down the analysis to sensitive parameters (AD, EF) which may trigger the differences • to check for consistency in the way uncertainties are calculated for different data sources • to define a common methodology for overall uncertainty calculation

Editor's Notes

  1. Dear audience, I am glad to take part again after 4 or more years in a scientific conference. For this reason I asked for a poster and …I ended up here having a talk…I hope I wont make a big full of myself…on purpose I have the main title in very small letters because we are not there yet, assessing the full ghg balance…this presentation is about trying to put together a little bit of whats available in terms of ghg emissions and their uncertainties…
  2. I found this paragraph written by Sebastiaan some time ago and I must say I like it very much, it really fits the purpose of our new project VERIFY…
  3. Other WPs deal with data pertaining to measurements, models, inventories and inversions
  4. There is some difference between countries choice of EFs FAO has the same EF for all years –uncertainty is introduced when comparisons are made with FAO data
  5. Variation is good, AD should be very similar, then uncertainty between different emissions estimates will be minimum!
  6. Sometimes there is difference between AD for different sources …see the example of Germany and Poland in 1990, the rest of the countries have very similar numbers – should decrease uncertainty…
  7. In terms of quantifying the total CH4 and N2O what does it mean? STDEV of the variance, 95% confidence interval – variance of the best estimate First attempt to quantify an uncertainty from different instruments : strengths and weaknesses We can notice that uncertainties in 2012 are decreasing for N2O and increasing for CH4…WHY??? need to look for reasons… Shall we use UNFCCC as baseline and calculate 95% interval for the other sources?
  8. With FAO…clear differences due to the use of different EFs but the overall uncertainty in the trend remains more or less the same…can we conclude that by introducing more data sources the uncertainty remains constant?
  9. Mostly yes in UNFCCC 90% of countries use Tier 1 approach following the IPCC guidelines, some countries use Tier 2 Monte Carlo, EDGAR and FAO use same AD, EDGAR EF from IPCC - they are close by We see that different sources have different emissions, methods or AD and EF are the cause of these differences…to be investigated
  10. UNFCCC – IPCC Tier 1 or 2 EDGAR – 95 % confidence interval Very different magnitude of uncertainty…which one is better?
  11. Another methodology is applied to inversions, I present an example of CH4 inversions results vs UNFCCC
  12. UNFCCC uncertainty = total EU28 uncertainty 5% from 2018 submissions Inversions total CH4 with 1 sigma uncertainty as provided by the data providers Examples of countries which are best constrained by atmospheric observations (BENELUX and France as well) Natural emissions (which are not included in UNFCCC) could explain part of the difference
  13. Inversions total CH4 with 1 sigma uncertainty as provided by the data providers Examples of countries which are best constrained by atmospheric observations (BENELUX and France as well) Natural emissions (which are not included in UNFCCC) could explain part of the difference
  14. Some countries do not report all sub-sectoral uncertainties (e.g. Greece for grazing) It is also a challenge aggregate similar the emissions e.g. Capri model is more detailed and includes in direct soil emissions more activities N2OHIS(histosoils) N2OCRO(crop residues) N2OAPP(application of manure) N2OSYN (anorganic fertilizer) Indirect soil emissions, what activities are in for different data sources? Atm deposition ??? Should be taken into account and where? FAO – EDGAR how do they aggregate? What do countries report to UNFCCC?
  15. Total uncorrelated uncertainty between sectoral totals for UNFCCC = 16% - IPCC formula EDGAR takes AD from FAO or similar and uses IPCC defaults or similar? I am just wondering why EDGAR does not use UNFCCC directly? Is that to ensure consistent methodology over all countries? 
  16. UNFCCC Tab 4 Forest land remaining forest land - sink cell B9 –(Net CO2 emissions/removals ) Area Table 4.1 cell B7 UNFCCC Table 4 Total LULUCF– cell B7 (Net CO2 emissions/removals ) Area Table 4.1 cell L17