Dukat, Paulina: How does drought impact water and carbon exchange in the temperate and boreal Scots pine stands?
•Download as PPTX, PDF•
0 likes•14 views

ICOS Science Conference 2022: Day 2, Session 9

Recommended
Recommended
More Related Content
Similar to Dukat, Paulina: How does drought impact water and carbon exchange in the temperate and boreal Scots pine stands?
Similar to Dukat, Paulina: How does drought impact water and carbon exchange in the temperate and boreal Scots pine stands? (20)
More from Integrated Carbon Observation System (ICOS)
More from Integrated Carbon Observation System (ICOS) (20)
Recently uploaded
Recently uploaded (20)
Dukat, Paulina: How does drought impact water and carbon exchange in the temperate and boreal Scots pine stands?
- 1. How drought impacts of water and carbon exchange on Scots pine stands? Paulina Dukat1,2, Marek Urbaniak1, Klaudia Ziemblińska1, Pasi Kolari2, Ivan Mammarella2, Christian Bernhofer3, Ivan Janssens4, Matthias Mauder3,5, Matthias Peichl6, Janusz Olejnik1, Timo Vesala2 1Meteorology Lab., Poznan University of Life Sciences, Poznan, Poland. 2Institute for Atmospheric and Earth System Research/University of Helsinki,Finland. 3Faculty of Environmental Sciences, Technische Universität Dresden, Germany 4PLECO (Plants and Ecosystems), Department of Biology, University of Antwerp, Belgium 5Institute of Meteorology and Climate Research Karlsruhe Institute of Technology, Garmisch- Partenkirchen, Germany 6Department of Forest Ecology and Management, Swedish University of Agricultural Sciences, Umeå, Sweden
- 2. - Studied widely and one conclusion: drought is bad for plants. - Research question: How does drought influence pine forests across boreal and temporal climates? - Drought can be determined meteorologically by SPEI, based on difference of precipitation and potential ET - Scots pine comfort zone and drought resistance: importance of long growing season and light availability vs soil moisture and less water stress? - How does prolonged drought (even several summers in row), due to changing climate, influence the carbon and water balance?
- 3. Brasschaat - temperate maritime 2 ha, even-aged pine stand Tuczno - temperate mature pine forest with admixture (1%) of birch. Hyytiälä – boreal, rather homogenous pine stand Svartberget – boreal, 100 years old mixed forest with 60% pine and 40% Norway spruce Rosinedal – boreal, pine forest Värriö - Subarctic climate, Scots pine (Pinus sylvestris). Trees mostly 65–70 years old
- 4. Tsoil ≥ 5˚C GPP ≥ 10% of max daily GPP from multi year period
- 5. Source: https://spei.csic.es/map October January October 2018 2018 October October October & December Summer months HYYTIÄLÄ TUCZNO Extreme drought conditions below -2 2015 SPEI SPEI Example of SPEI multiyear courses
- 6. MAY 2018 JUNE 2018 JULY 2018 AUGUST 2018
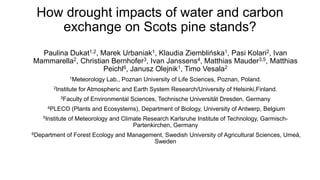
- 7. 10 15 20 25 −3 −2 −1 0 1 2 Varrio April − September SWC (%) SPEI 3 14 16 18 20 22 24 −3 −2 −1 0 1 2 Svartberget April − September SWC (%) SPEI 3 6 7 8 9 10 11 12 −3 −2 −1 0 1 2 Rosinedal April − September SWC (%) SPEI 3 10 15 20 25 30 −3 −2 −1 0 1 2 Hyytiala April − September SWC (%) SPEI 3 4 6 8 10 −3 −2 −1 0 1 2 Tuczno April − September SWC (%) SPEI 3 10 15 20 −3 −2 −1 0 1 2 Brasschaat April − September SWC (%) SPEI 3 SPEI vs in-situ monthly Soil Water Content
- 8. -1000 -800 -600 -400 -200 0 200 2012 2013 2014 2015 2016 2017 2018 2019 NEE (gC m -2 year -1 ) Bra Tu Hyy Sva Ro Va Tu Reduction in assimilation rate for Tuczno in 2015 0 100 200 300 400 500 600 700 800 2012 2013 2014 2015 2016 2017 2018 2019 ET (mm m -2 year -1 ) Bra Tu Hyy Sva Ro Va Tu Effect of repeating drought
- 10. Conclusions: • Linking of long-term SPEI with in-situ flux and soil data is useful • helps in understanding of Ecosystem response to drought • Appearance of drought depends on the ecozone: northern sites show meteorological drought at higher SWC • Appearance of strong drought - for different zones and SWC range - linked to similar WUE • Multi-year drying tendency decreases the average carbon uptake – especially in temperate forest