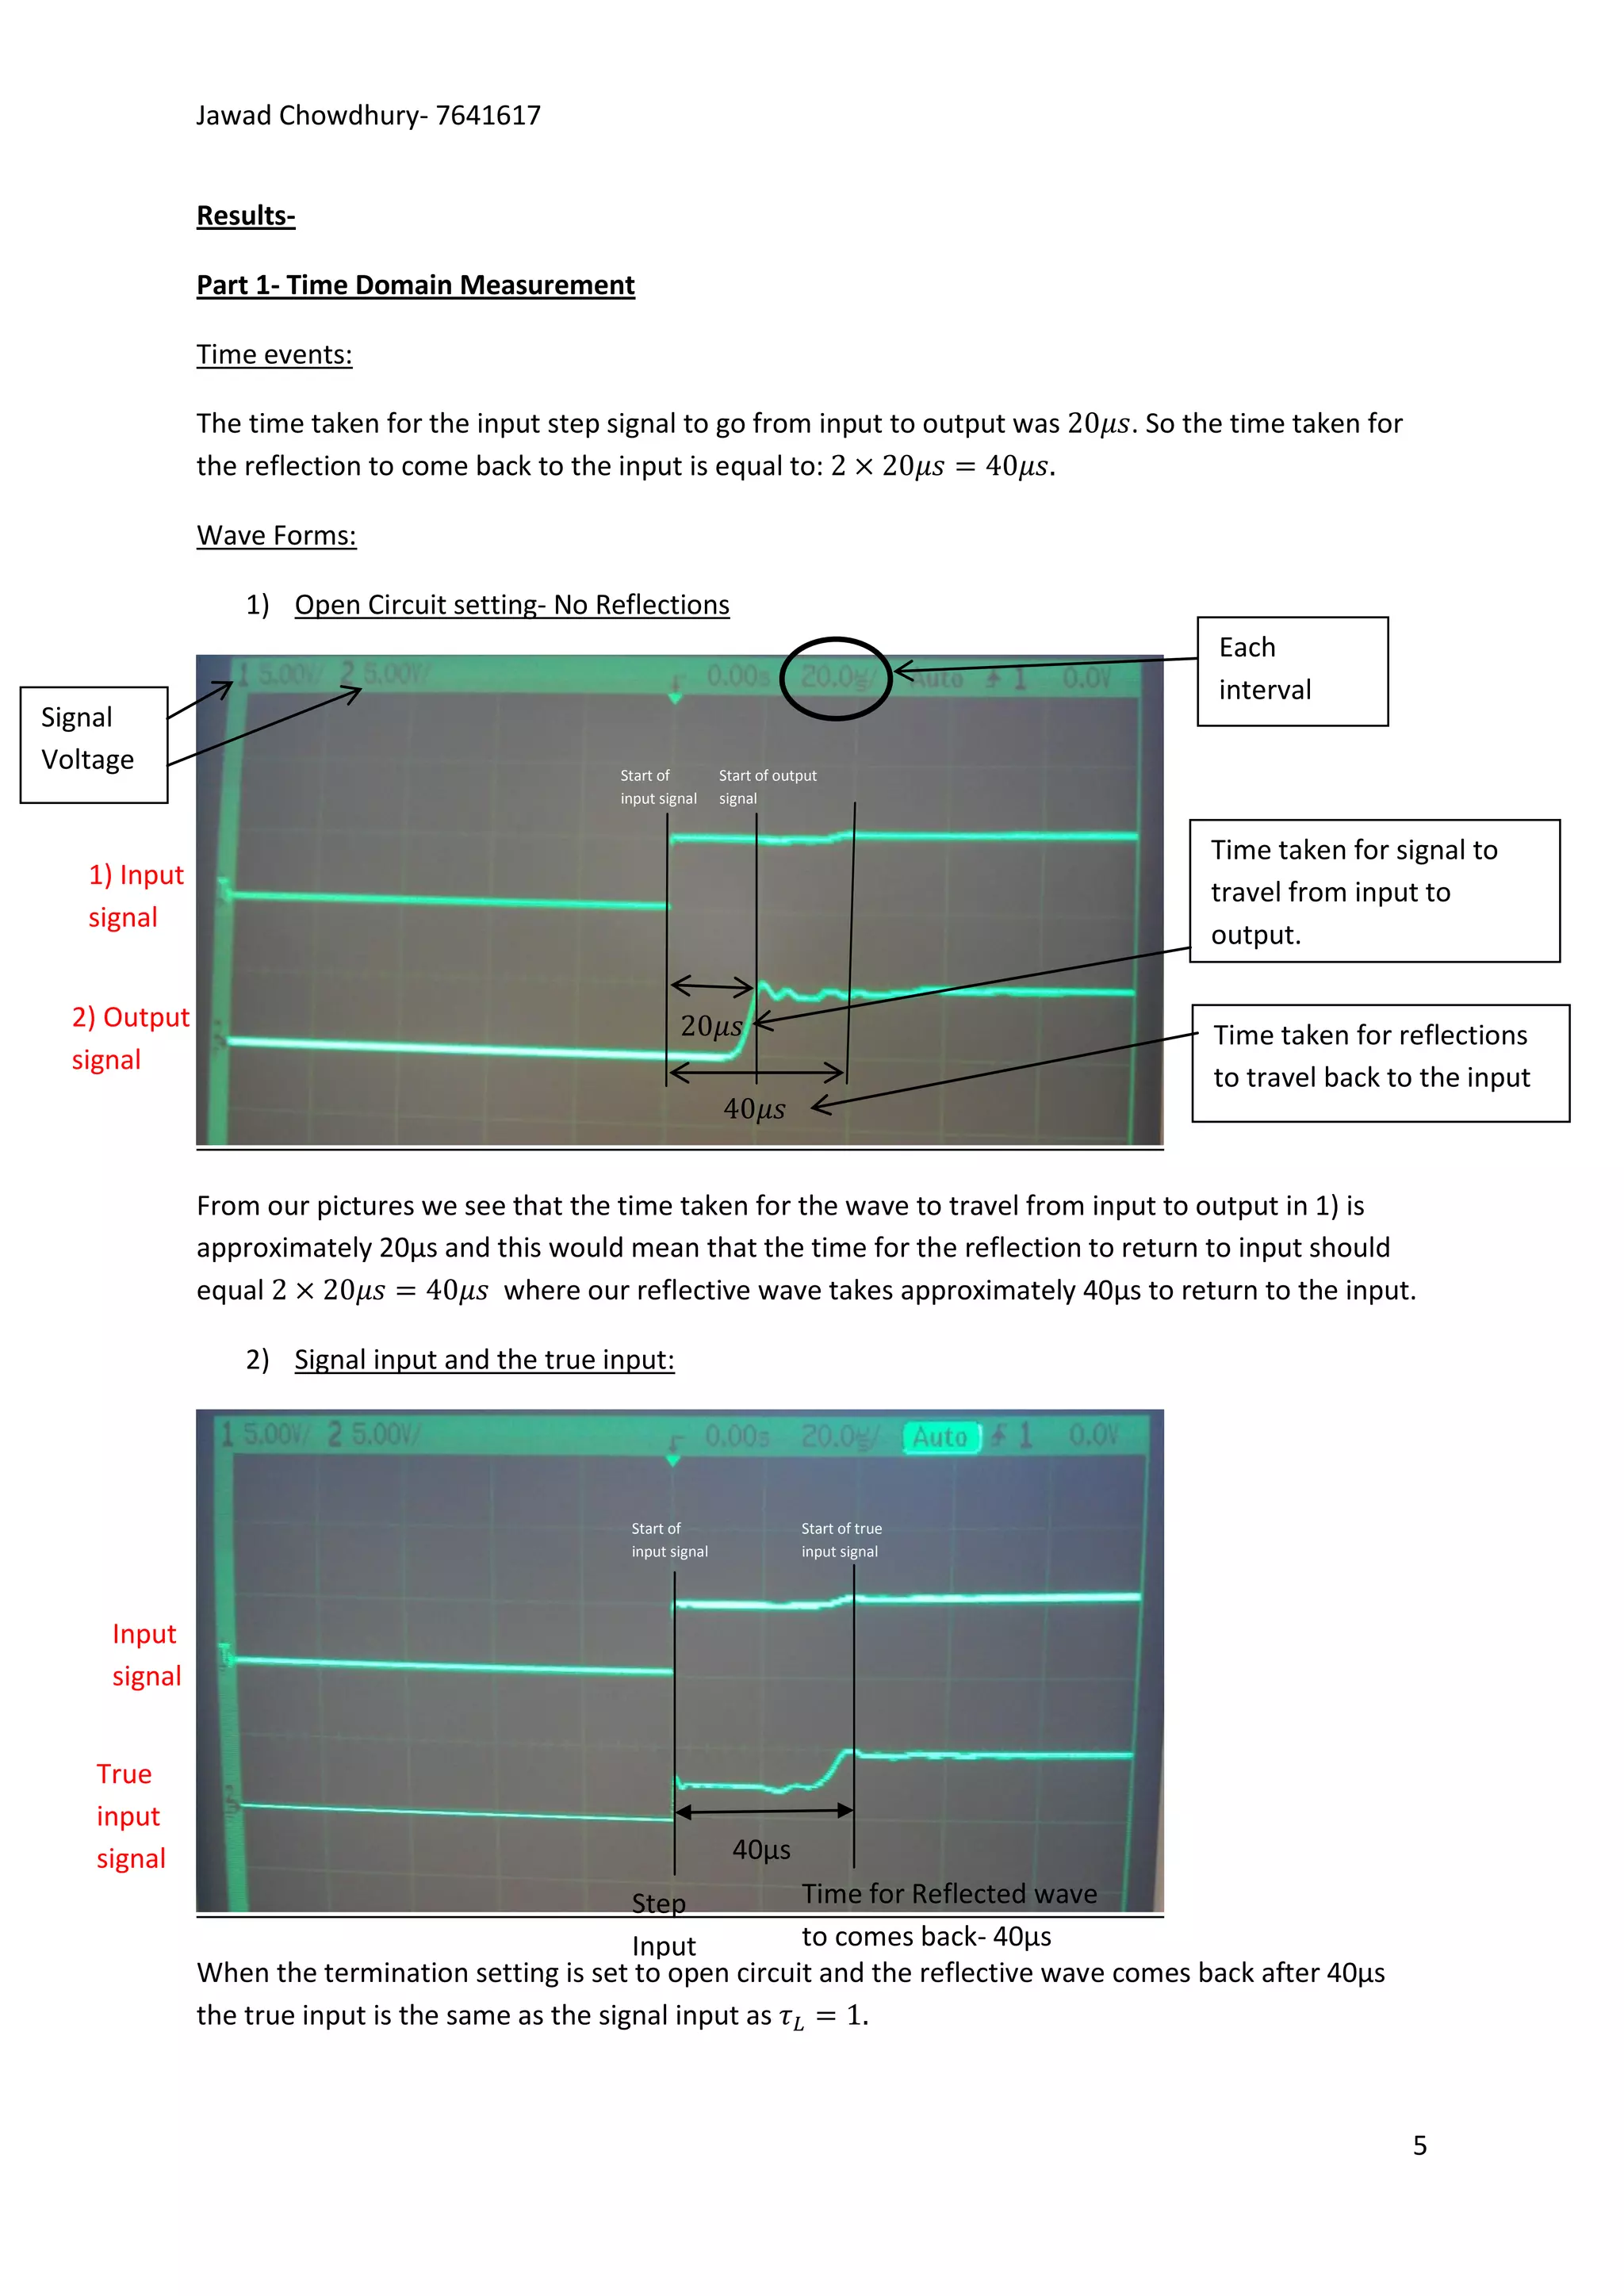
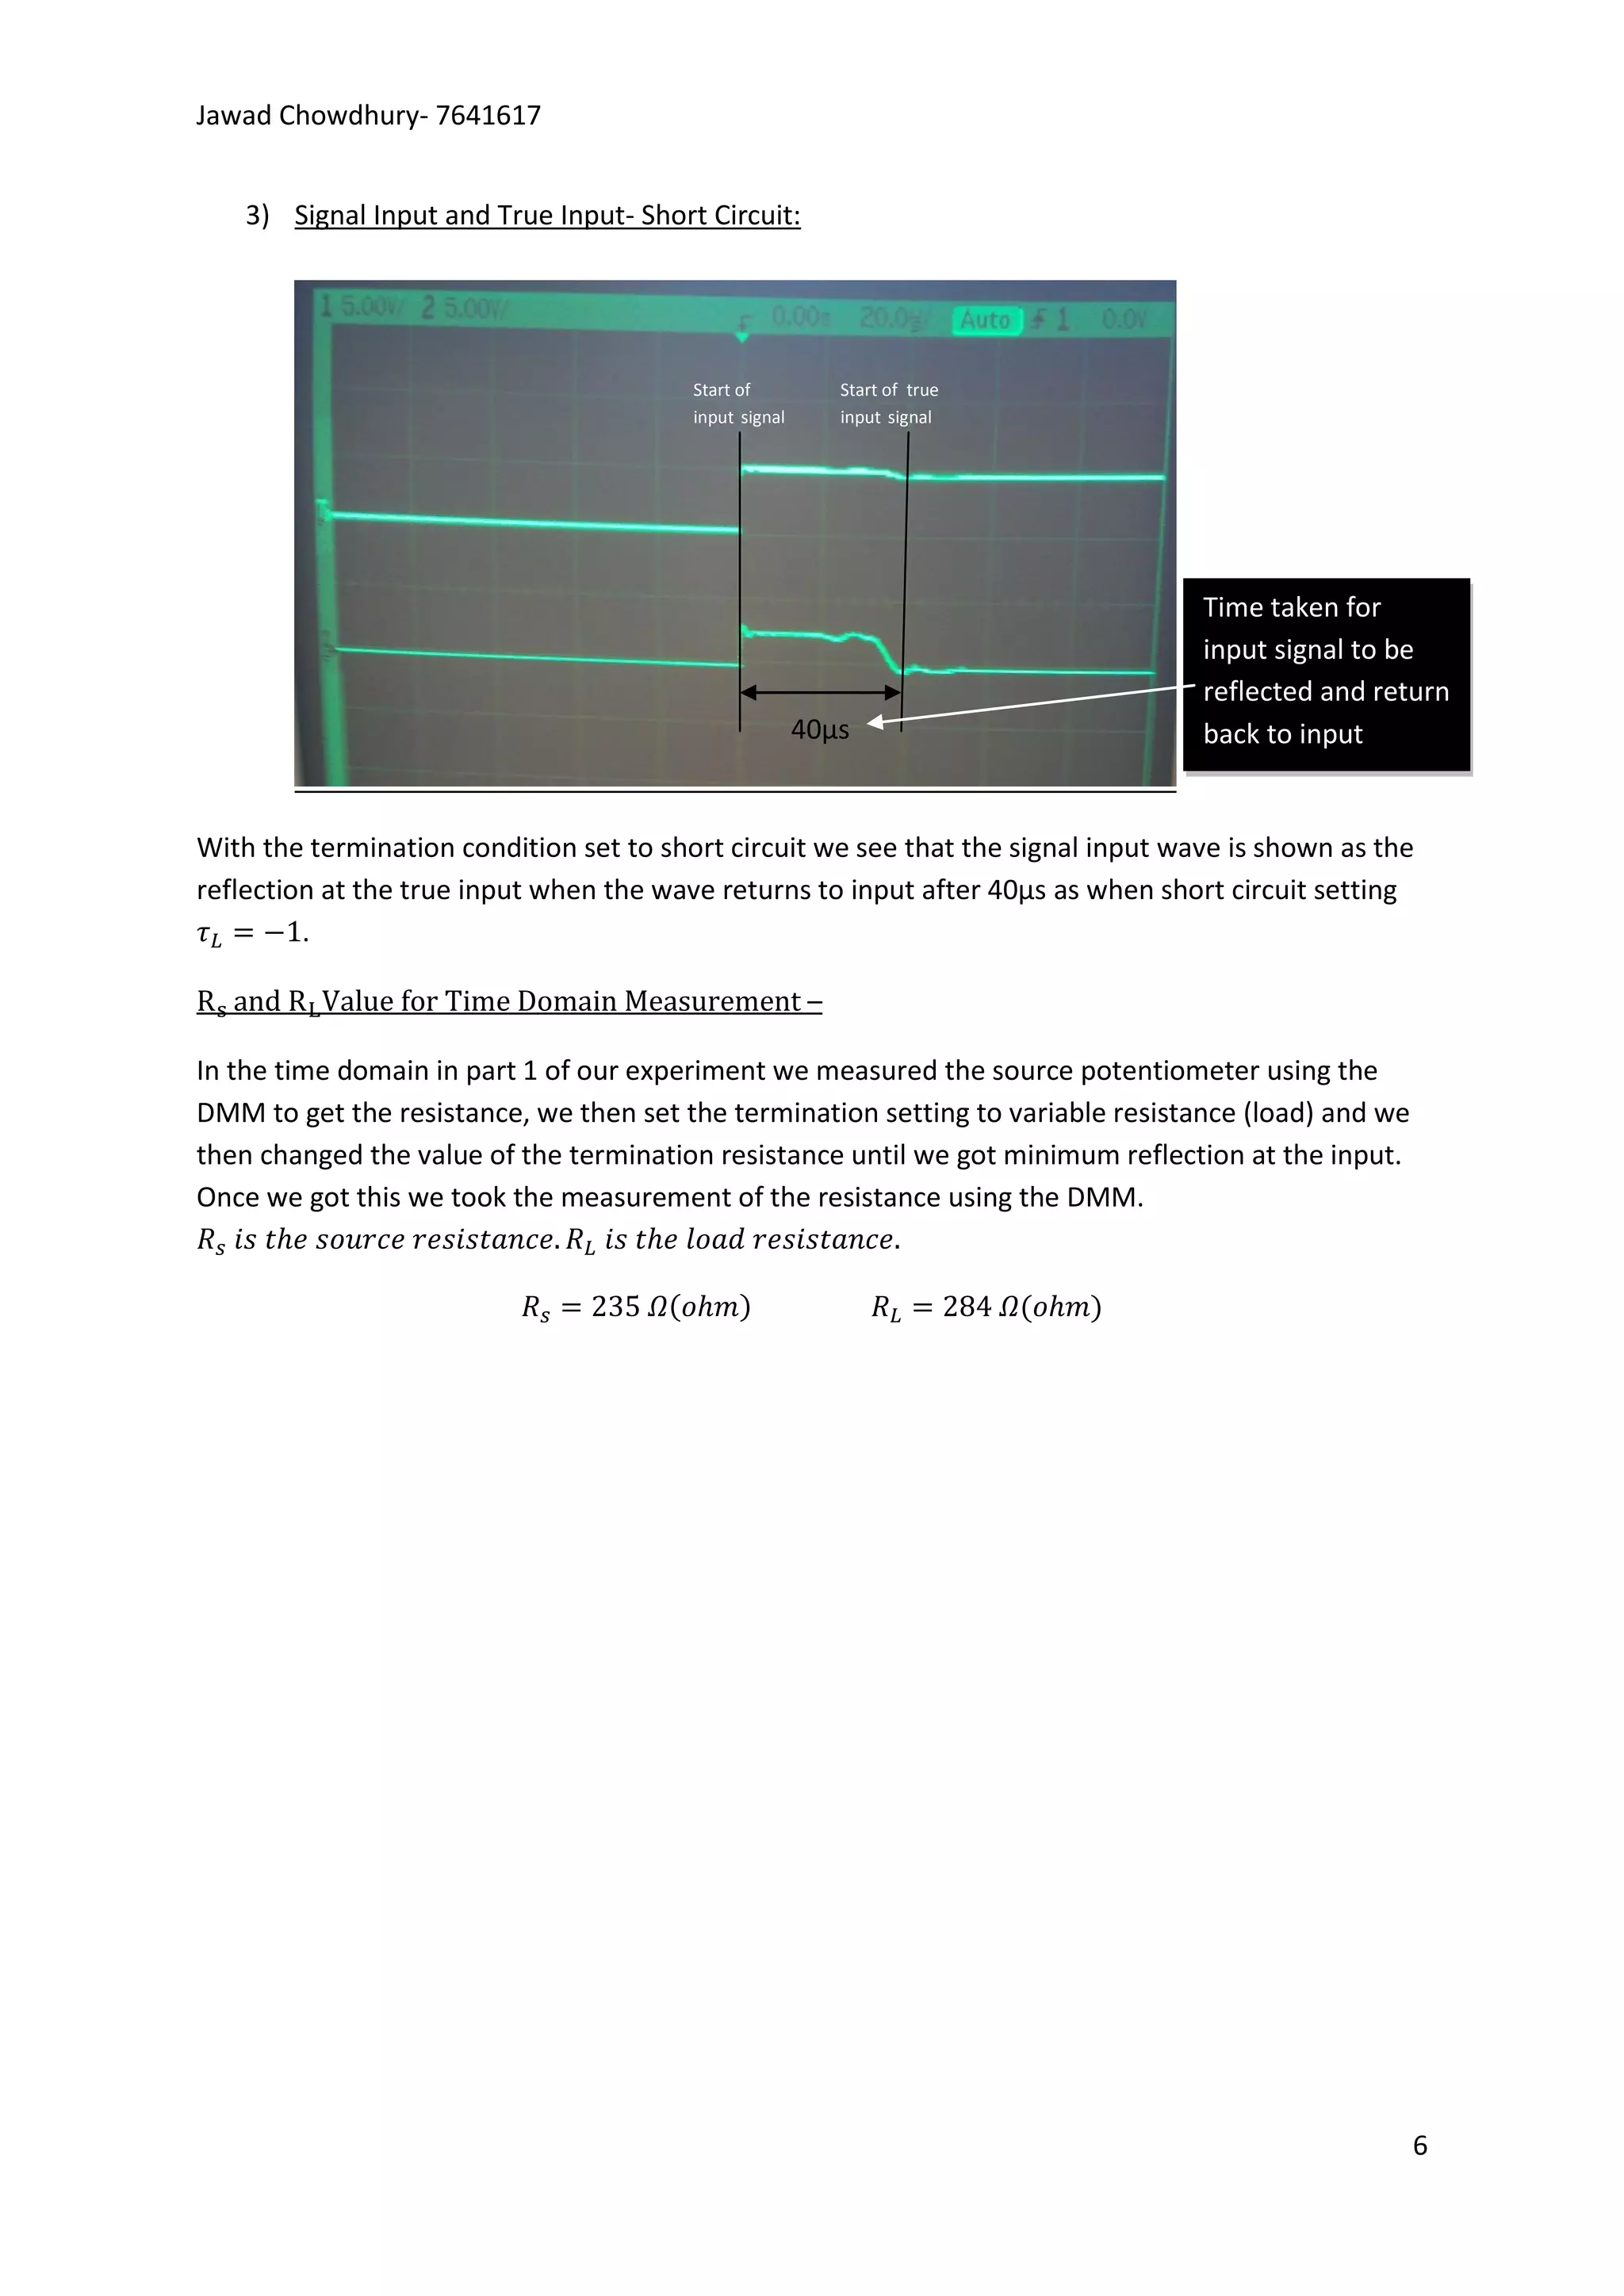
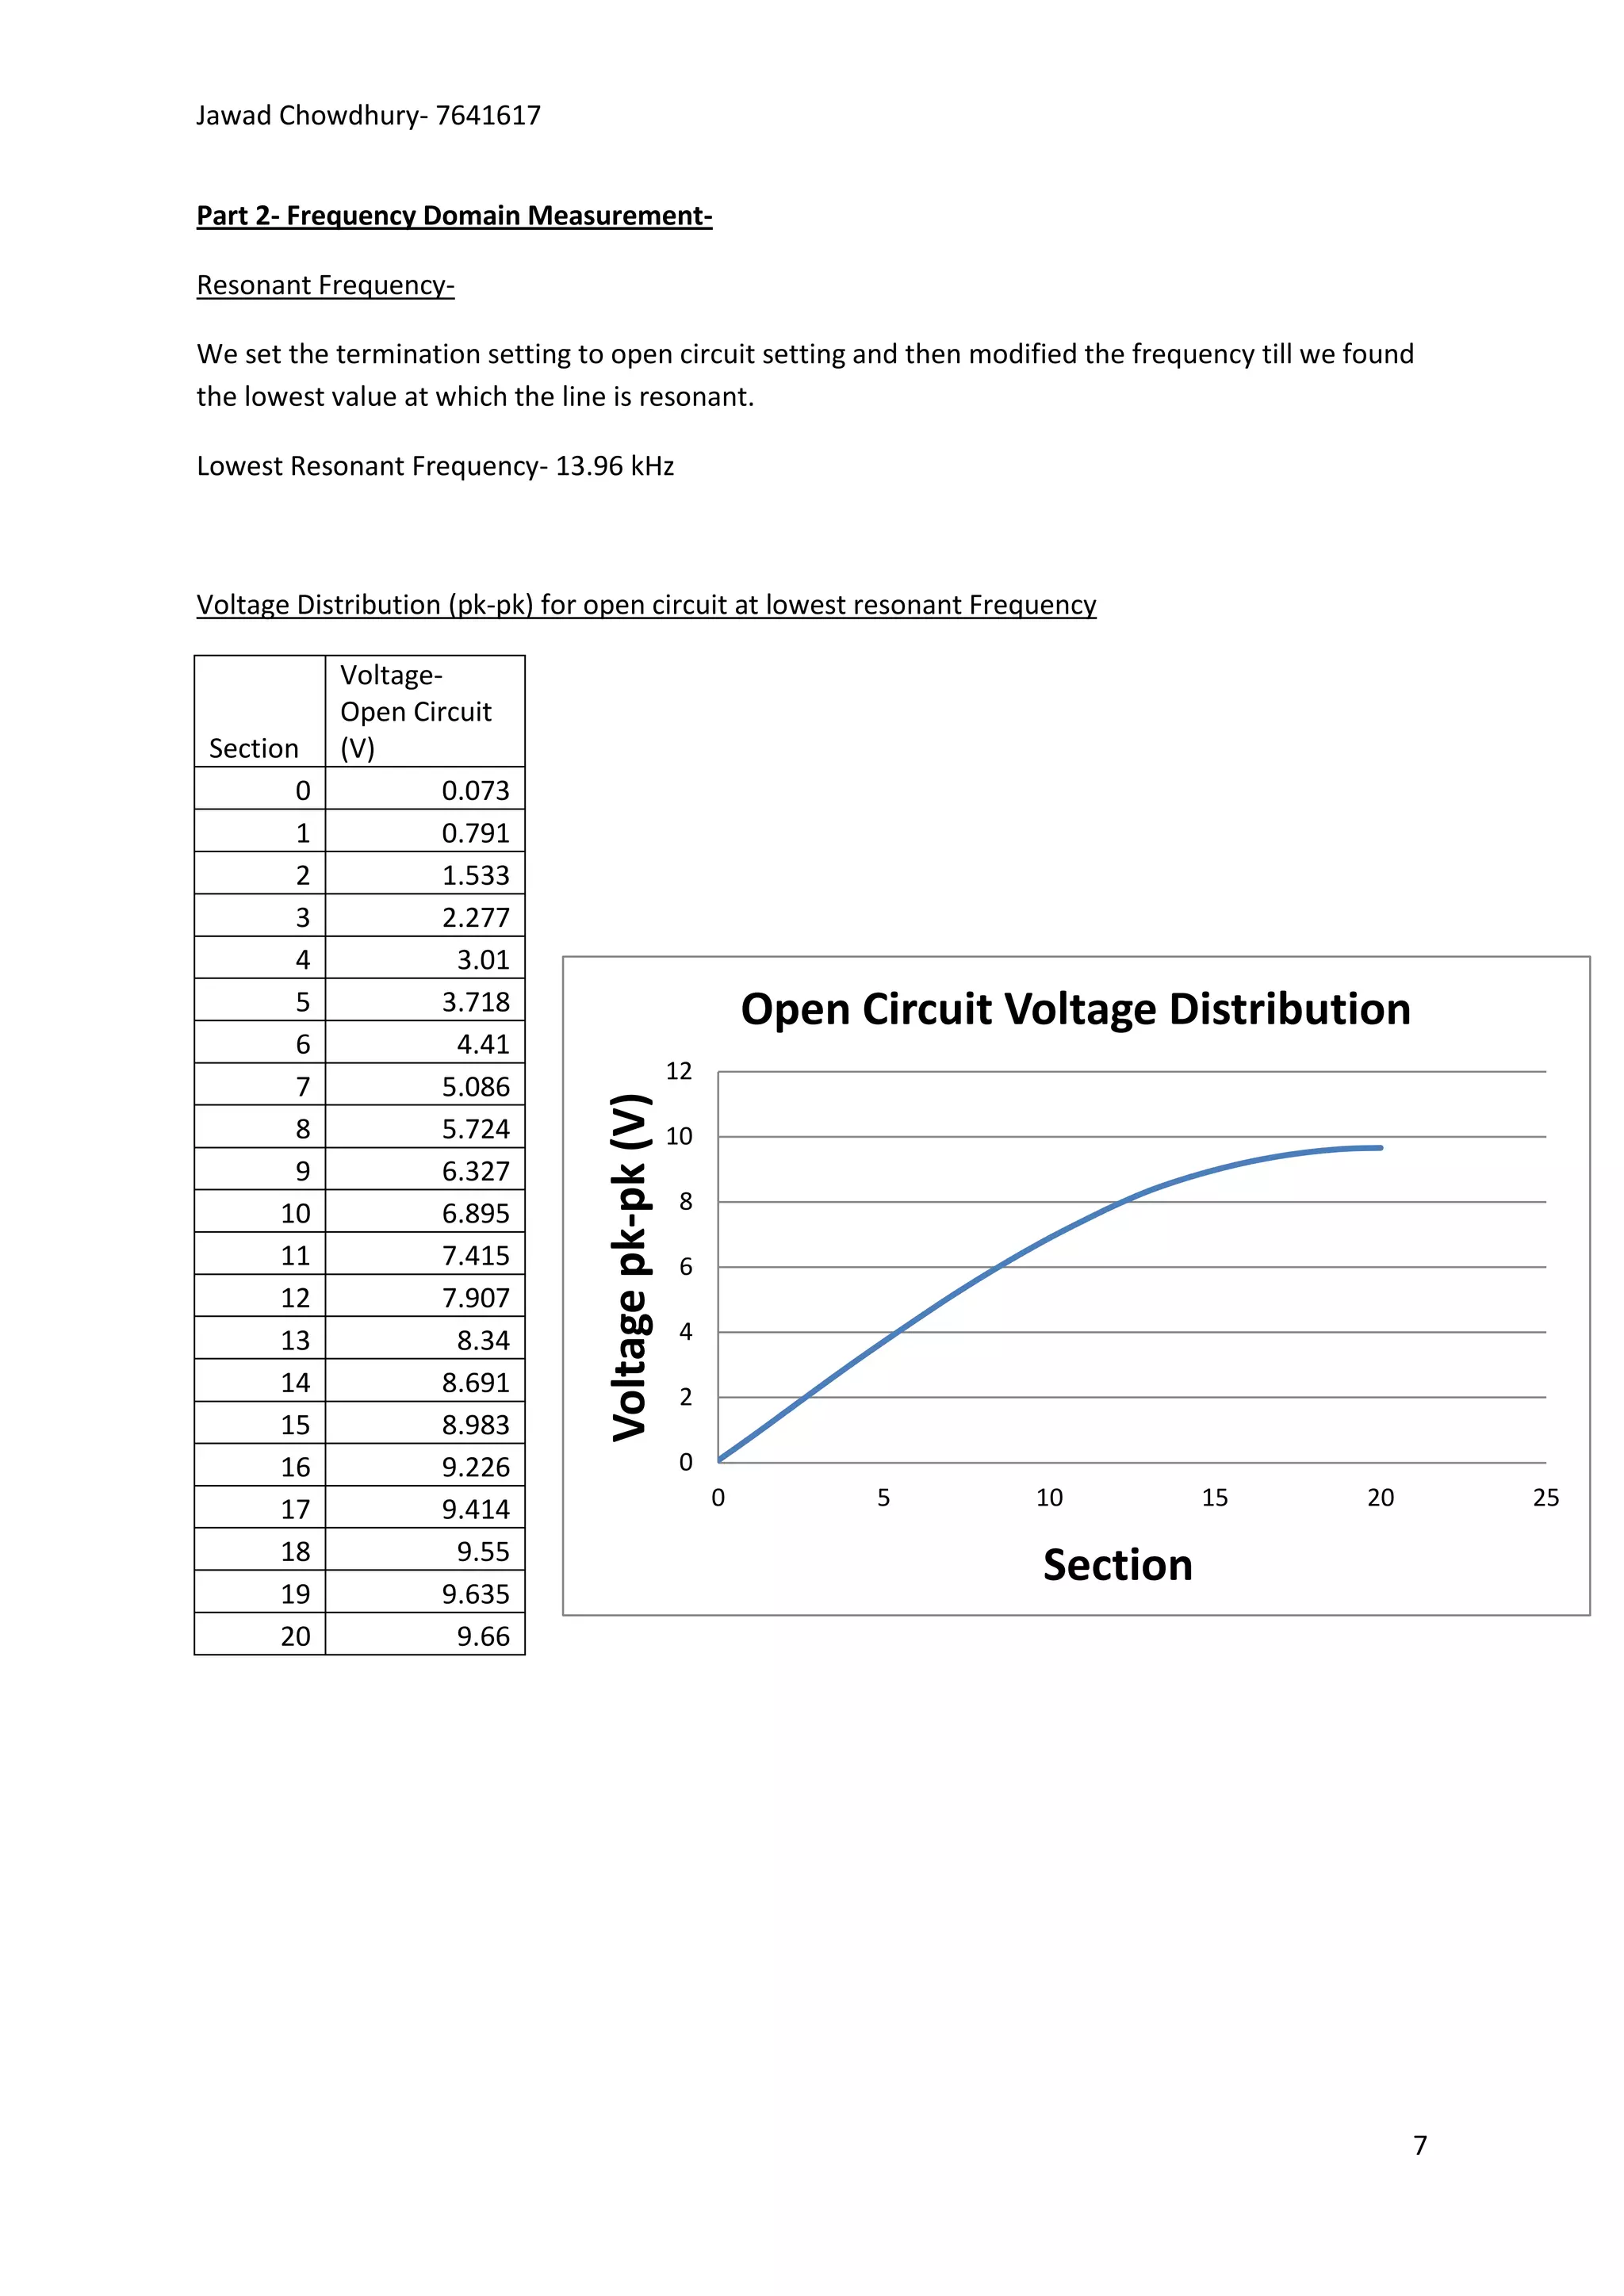
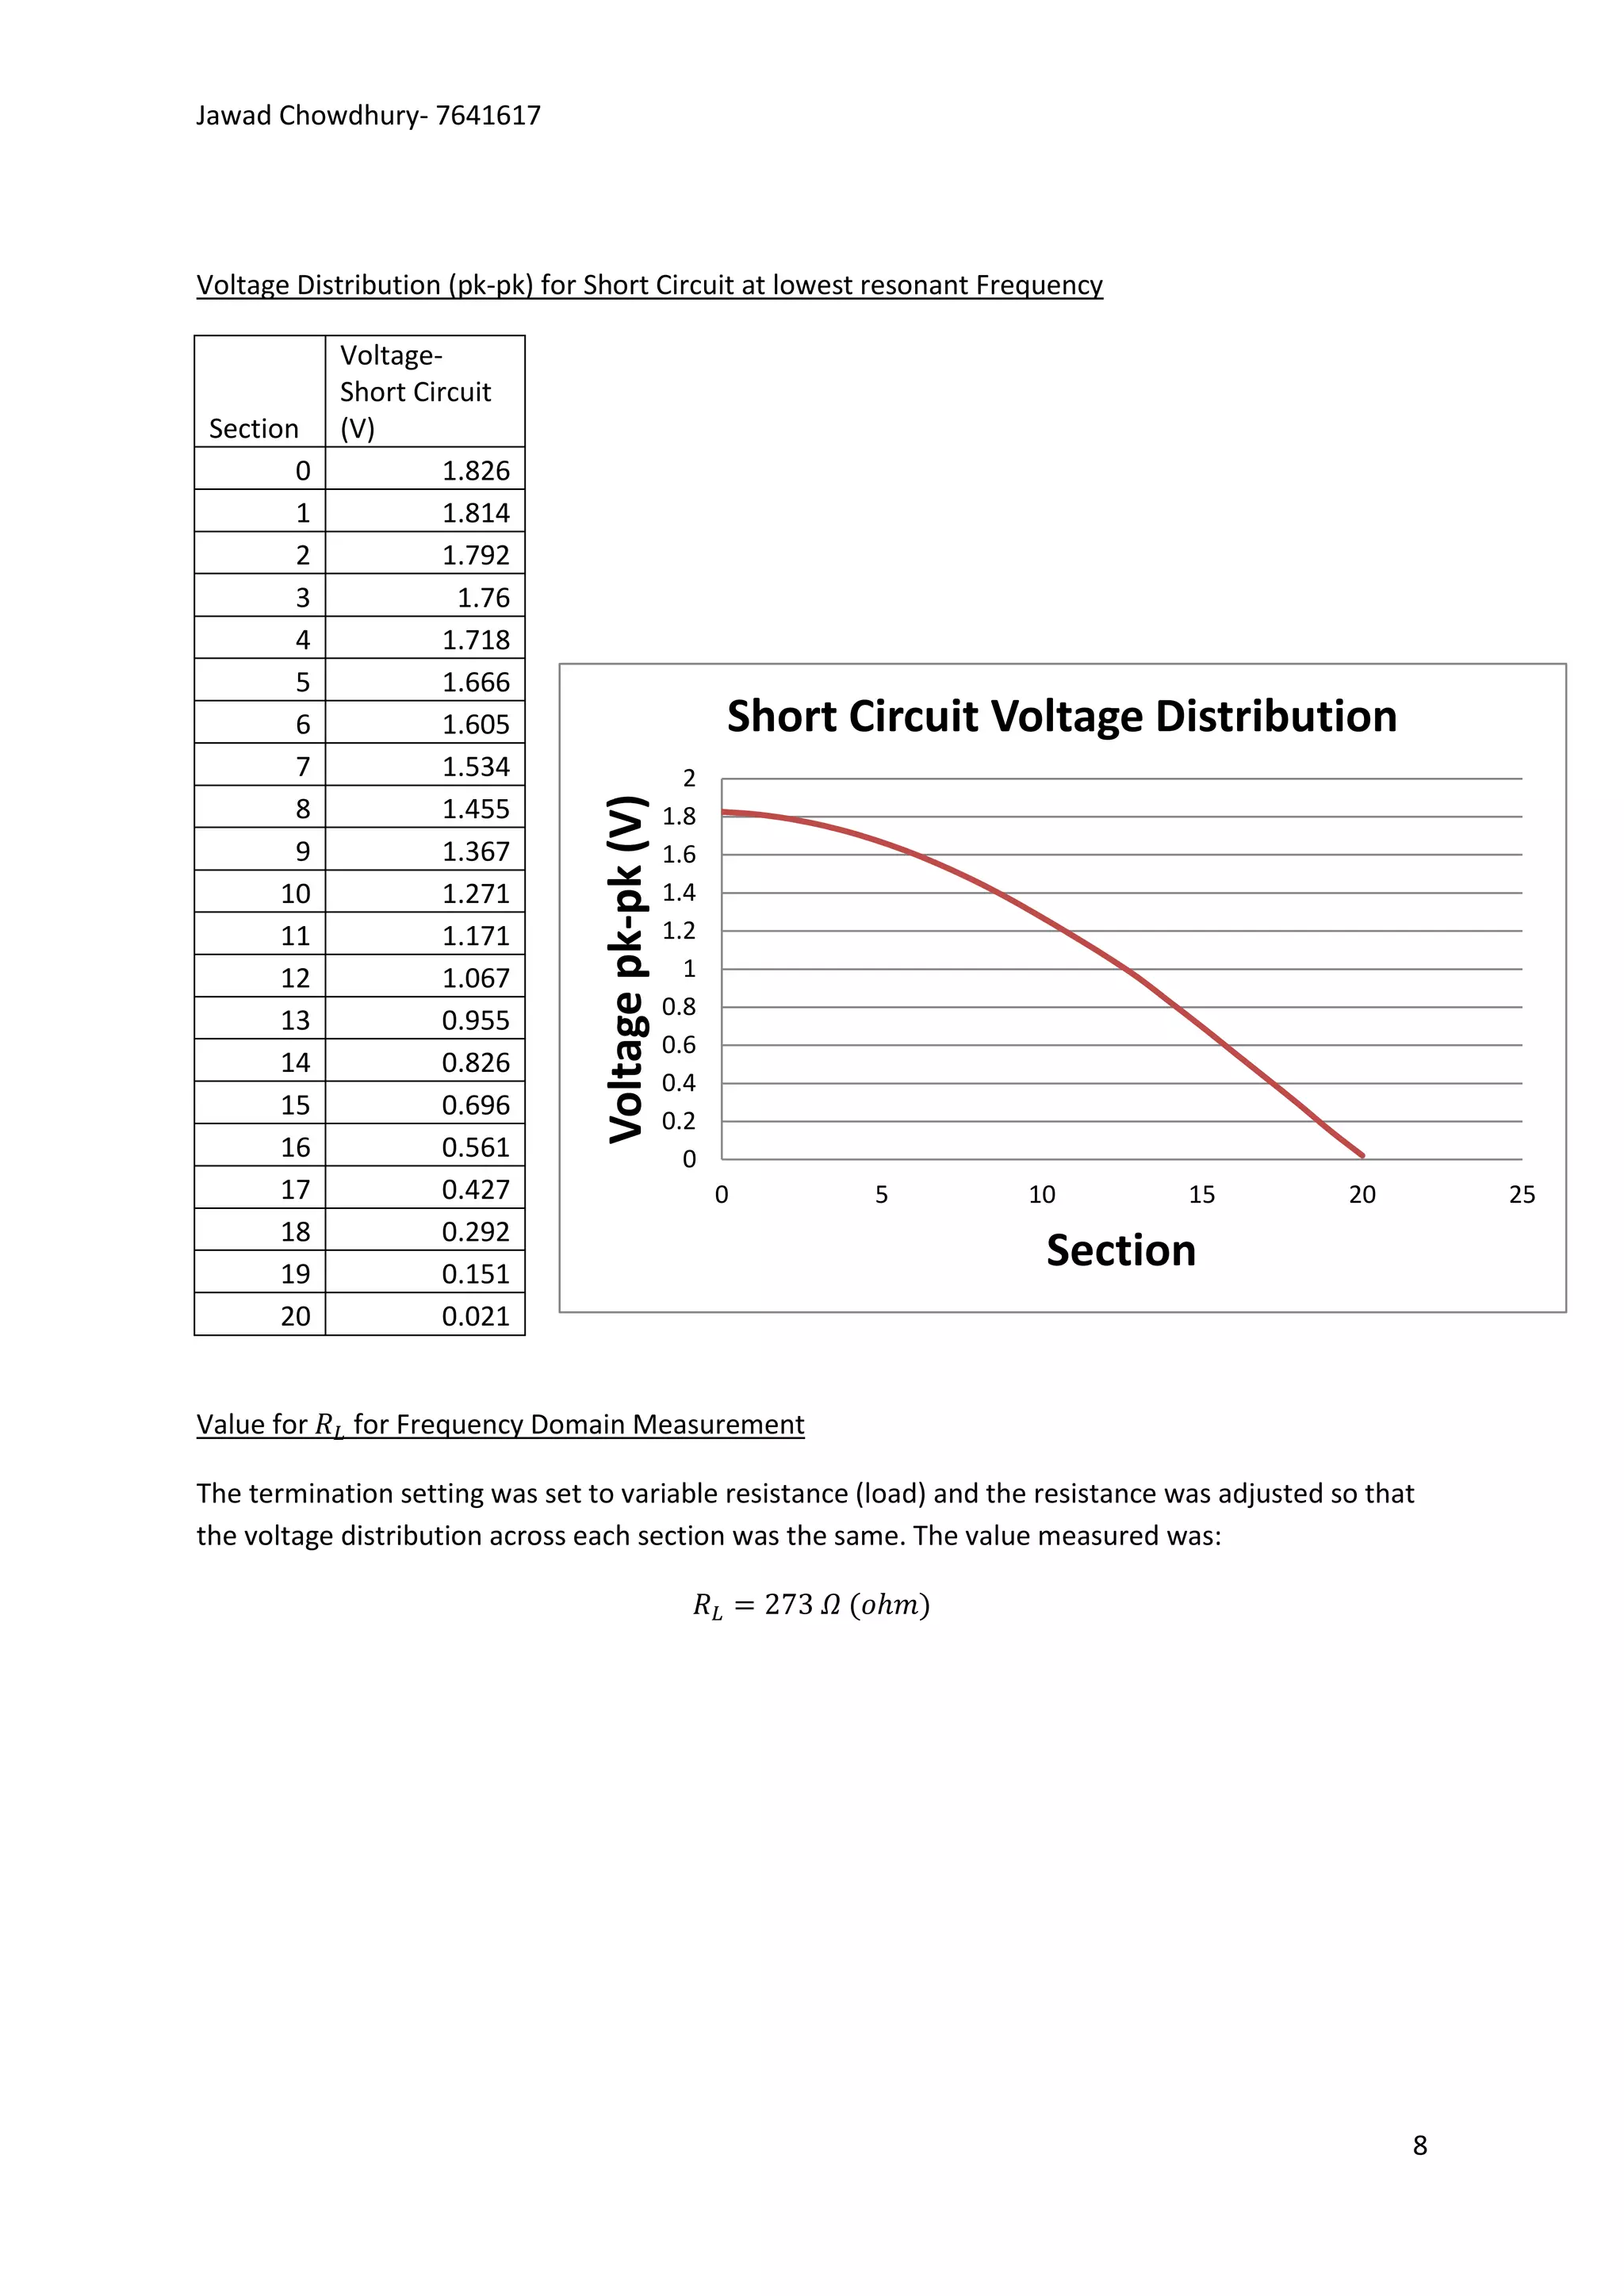
Jawad Chowdhury- 7641617


                                  Artificial Line Laboratory


Objectives: The aim of this experiment was to be able to study the behaviour of a transmission line,
with sinusoidal and step signal input under different terminating conditions. Also to analyse the
output waves produced by the transmission line and to study there reflections, reflective co-efficient
and the effects of the different termination conditions.

By studying these different behaviours we should be able to determine the characteristic impedance
and the length of the artificial transmission line with step input signal, using the time domain
measurement technique based on the reflection concept, and with a sinusoidal excitation signal.

Background Theory:

General Information-

The artificial line that was used in the lab consists of a number of sections and was used to simulate
a length of power line spanning approximately 6000 meters. The sections were built up with
inductive elements twisted around ferrite rings to provide an inductance of 300µH and capacitors of
approximately 3500pF.

Artificial transmission lines are discrete lumped circuit elements designed to represent real
transmission lines. If it was possible to have an infinite number of circuit elements within our
artificial line then we would be able to give a perfectly accurate simulation of a long transmission
line, however this is not possible so we only have a finite number of sections with our artificial line
and this allows us to only represent a transmission line below a high frequency limit.

For our resonant condition of the artificial line is such that the reflected wave exactly opposes the
applied input waveform. Also the lowest frequency for resonance is when the line length is one
quarter of the wave length.

Reflection Co-efficient-


  : Reflection Co-efficient,    : Load Resistance,   : Characteristic Impedance

The reflection co-efficient is a very important concept for transmission lines.

Termination Conditions-

          For          (short circuit)

          For          (open circuit)

          For           (Match- load resistance is same as characteristic impedance)

Impedance match is the proper termination if we don’t want any reflections.

                                                                                                          1
Jawad Chowdhury- 7641617


Characteristic Impedance-

Using KVL and KCL for a small section of the line and having the limit        we arrive at
‘Telegraphers equations’:


When the equations are linked together we derived the wave equation:


The wave equation shows that the currents and voltages on the transmission line satisfy the one
dimensional wave equation.

Therefore since current satisfies the wave equation:


And current and voltage are related by equation (1), so for the general function this gives:


And since the forward waves are independent of the reverse waves we have:


Where
            √

Within a constant we have:


                                                    √


   is equal to the Characteristic impedance of the line.


                                                                                                  2
Jawad Chowdhury- 7641617


Length of Line-

Time Domain:

In the time domain to calculate the length of line = speed of light x wave time from input to output

Length = (                                     m

Frequency Domain:

To calculate the length of line we first have to find out the wave time by using the equation:


So by using this equation we get the time as:


Now that we know the time we can calculate the length of the line:

Length of line =                                        m

Propagation Velocity-

We know that       √        for the velocity of wave propagation. So we can calculate the velocity as
we know                                    :


                        √


Knowing this we can calculate the transit time of the transmission line.


                                                                                                        3
Jawad Chowdhury- 7641617


Experimental Procedure-

Equipment: Agilent oscilloscope, Adjustable Frequency Signal generator, artificial line apparatus,
Digital Multi-Meter (DMM)

Part 1- Time Domain Measurement:

    (a) We set the switches on the artificial line apparatus so that it produces a full element line.
        We set the line termination to the open circuit setting and connected the oscilloscope to the
        end of the line so we could monitor the output. The source potentiometers were then
        adjusted so that the output waveform matched the input meaning there was no reflection.
        We then determined the time taken for the step input signal to travel from input to output
        and sketched the wave forms and estimated the time taken for reflections to travel back to
        the input.
    (b) Next with the load still on the open circuit setting and the source potentiometers adjusted
        so as to remove any reflections of the output wave we disconnected the output and
        connected one channel of the oscilloscope at the first element of the transition line. We
        then drew the wave forms at the signal input and at the true input. Then we switched the
        setting of the load to short circuit setting and drew the waveforms.
    (c) The input signal was disconnected and the source potentiometers were measured using the
        DMM.
    (d) The input signal was then reconnected and the termination setting was set to variable
        resistance (load) and we modified the load resistance till we found the value of termination
        resistance which gave the minimum reflection at the input. The resistance was then
        measured with the DMM and recorded.

Part 2- Frequency Domain Measurement:

    (a) The adjustable frequency signal generator was connected up to the input and the
        oscilloscope was also connected in parallel. The signal generator was set to an input signal of
        5V pk-pk with 0V d.c. offset.
    (b) Then the termination setting of the line was set to open circuit setting and we modified the
        frequency to find the lowest frequency at which the line is resonant. Once this value was
        found the DMM was used to plot the voltage distribution (pk-pk) along the line by measuring
        the voltage at each signal point along the line.
    (c) We then switched the termination setting to short circuit and measured the voltage
        distribution along the line without changing the frequency already set.
    (d) The termination setting was changed to the variable resistance and the resistance was
        adjusted so that the voltage distribution at each point along the line was as uniform as
        possible. By doing this the variable load resistance should be the same as the characteristic
        impedance of the line. This value was then measured by the DMM and recorded.
    (e) Finally we switched the setting back to the open circuit setting and recorded as many
        resonant frequencies as we could.


                                                                                                     4
Jawad Chowdhury- 7641617


              Results-

              Part 1- Time Domain Measurement

              Time events:

              The time taken for the input step signal to go from input to output was       . So the time taken for
              the reflection to come back to the input is equal to:

              Wave Forms:

                  1) Open Circuit setting- No Reflections
                                                                                                   Each
                                                                                                   interval
Signal
Voltage                                         Start of        Start of output
                                                input signal    signal


                                                                                                  Time taken for signal to
   1) Input
                                                                                                  travel from input to
   signal
                                                                                                  output.

  2) Output
                                                                                                  Time taken for reflections
  signal
                                                                                                  to travel back to the input


              From our pictures we see that the time taken for the wave to travel from input to output in 1) is
              approximately 20µs and this would mean that the time for the reflection to return to input should
              equal                   where our reflective wave takes approximately 40µs to return to the input.

                  2) Signal input and the true input:


                                                 Start of                   Start of true
                                                 input signal               input signal


     Input
     signal


    True
    input
    signal                                                        40µs
                                                   Step         Time for Reflected wave
                                                   Input        to comes back- 40µs
              When the termination setting is set to open circuit and the reflective wave comes back after 40µs
              the true input is the same as the signal input as


                                                                                                                      5
Jawad Chowdhury- 7641617


    3) Signal Input and True Input- Short Circuit:


                                         Start of            Start of true
                                         input signal        input signal


                                                                                   Time taken for
                                                                                   input signal to be
                                                                                   reflected and return
                                                        40µs                       back to input


With the termination condition set to short circuit we see that the signal input wave is shown as the
reflection at the true input when the wave returns to input after 40µs as when short circuit setting
         .

                                                         –

In the time domain in part 1 of our experiment we measured the source potentiometer using the
DMM to get the resistance, we then set the termination setting to variable resistance (load) and we
then changed the value of the termination resistance until we got minimum reflection at the input.
Once we got this we took the measurement of the resistance using the DMM.


                                                                                                      6
Jawad Chowdhury- 7641617


Part 2- Frequency Domain Measurement-

Resonant Frequency-

We set the termination setting to open circuit setting and then modified the frequency till we found
the lowest value at which the line is resonant.

Lowest Resonant Frequency- 13.96 kHz


Voltage Distribution (pk-pk) for open circuit at lowest resonant Frequency

            Voltage-
            Open Circuit
 Section    (V)
        0           0.073
        1           0.791
        2           1.533
        3           2.277
        4            3.01
        5           3.718                                     Open Circuit Voltage Distribution
        6            4.41
                                                     12
        7           5.086
                                 Voltage pk-pk (V)


        8           5.724                            10
        9           6.327
       10           6.895                             8

       11           7.415                             6
       12           7.907
       13            8.34                             4
       14           8.691                             2
       15           8.983
       16           9.226                             0
       17           9.414                                 0         5       10        15        20       25

       18            9.55
       19           9.635
                                                                            Section
       20            9.66


                                                                                                     7
Jawad Chowdhury- 7641617


Voltage Distribution (pk-pk) for Short Circuit at lowest resonant Frequency

            Voltage-
            Short Circuit
 Section    (V)
        0            1.826
        1            1.814
        2            1.792
        3             1.76
        4            1.718
        5            1.666
        6            1.605                                 Short Circuit Voltage Distribution
        7            1.534                             2
                                 Voltage pk-pk (V)


        8            1.455                           1.8
        9            1.367                           1.6
       10            1.271                           1.4
       11            1.171                           1.2
       12            1.067                             1
                                                     0.8
       13            0.955
                                                     0.6
       14            0.826
                                                     0.4
       15            0.696                           0.2
       16            0.561                             0
       17            0.427                                 0      5       10      15           20       25
       18            0.292
       19            0.151
                                                                           Section
       20            0.021


Value for    for Frequency Domain Measurement

The termination setting was set to variable resistance (load) and the resistance was adjusted so that
the voltage distribution across each section was the same. The value measured was:


                                                                                                    8
Jawad Chowdhury- 7641617


Other Resonant Frequencies

The termination setting was set once again to open circuit setting and we then used the oscilloscope
to see the other resonant frequencies by varying the frequency. From our experiment we saw that it
was quite difficult to see the value all the time as the wave was so small and also the equipment we
used was not sensitive enough to be able to increase the frequency by a small amount once you
reached a high number therefore you are unable to see all the values. However we noticed there
was a pattern and the resonant frequency was linear so the same value increased each time would
give a line that was resonant.

                                      Resonant Frequencies (kHz)
                                                 44.3
                                                 69.0
                                                 98.1
                                                126.5
                                                145.9
                                                172.9


The resonant Frequencies occur at each interval of approximately 27 kHz.

Data Analysis and Discussion-

Part1:

Explanation of waveforms:

1) In part 1 for our First waveform we set the termination condition to open circuit and connected a
signal at the input and had a connection at the output to see the output wave compared to the
input. Once we saw the output wave we modified the value of till we had an output wave that
matched the input so that it had no reflections.

The output wave starts after 20µs as that is the time taken to go from input to output.

The value of     remained the same through out the rest of the measurements in part 1.

2) For our second condition the termination setting remained as open circuit. However we
disconnected the channel from the output and connected it to the true input to see the true input
wave form. We see that there is no reflection at the true input. The reason for this can be explained
using the equation for the reflection co-efficient:


When the circuit is set to the open circuit setting the value for     is very large, ideally the value for
    will be infinite, and the value for is very small, negligible, therefore the value for the reflection
co-efficient            so when the signal is multiplied by the reflection co-efficient when the signal
returns to the input we see that the true input signal is almost identical to the input with no
reflection. We also see that the true input wave starts after 40µs as that is the time taken for the
reflection to come back to the input.

                                                                                                         9
Jawad Chowdhury- 7641617


3) For our third condition the termination setting is set to short circuit setting. We see that the true
input is a reflection of the input. This can also be explained using the equation for the reflection co-
efficient.

While in short circuit setting the value for      is very small, ideally 0, and therefore making the value
for          = -1. So as the value for the reflection co-efficient           the wave we see at the true
input will be multiplied by the value and therefore give us a wave that is a reflection of the input at
the true input. That is why we see a reflection.

Also the reflection wave at the true input begins after 40µs as that is the time it takes for the
reflected wave to come back to the input.

Explanation why

In part 1 when we took measurements of the source resistance we saw that it was not the same
value as the load resistance . The values we got were not the same as there is impedance in the
oscilloscope and in the wires which caused the values not to be the same. Also the reflections
caused by the load resistance are visible on the input signal; where as the reflections caused by the
source resistance are visible on the output signal. This means we can’t match them identically and
therefore there would be a difference between the output and input causing the values of
            not to be the same. However the values were not far off each other.

Part 2-

Short circuit like behaviour at resonance-

When the line is resonant the inductance and capacitance are equal so they cancel each other out
causing the circuit to behave as if it was short circuit.

Comparison between resistance values taken in parts 1 and 2

The value we measured for                in part 1 is very close to the value for measured in part 2,
but not exact. The value would not be exact because of impedance in the circuit and other losses but
the value from part 2 is very close to the values from part 1.

Part1:                   Part2:


All the values are quite similar to each other.

Analysis of the length of line

Already in the report I have analysed the length of line by calculating the length of the line in the
time domain and the length of line in the frequency domain.

In the time domain we calculated the length to be 6000m and in the frequency domain we
calculated it to be 5373m.

                                                                                                        10
Jawad Chowdhury- 7641617


We can also use another method to calculate the transit time of the line and also its length. We can
do this by using the propagation velocity. We previously in the report calculated the propagation
velocity to be                        . We also know that there are 21 sections on the artificial line
that we used, so we can use both these values to calculate the transit time:


So the value we have calculated for the transit time           . Using this value we can calculate
the maximum length of the real transmission line the apparatus we used simulated:

                                                                                            m

So the maximum length of line of the real transmission line this apparatus represents is 6450m. This
value is similar to the values calculated in the frequency and time domain.

Why at resonant frequency amplitude of the input goes down to almost zero?

At resonant frequency the amplitude of the input almost goes down to zero as the impedance of the
line is the same and the reflected wave cancels out the input making it almost zero as the reflected
wave has the same magnitude and phase as the forward wave.

Relationship between Resonant Frequencies

The values we got for the resonant frequencies showed a pattern, in the table under other resonant
frequencies, where it increased every 27 kHz approximately. The lowest resonant frequency we
measured was 13.96 kHz. So as the values increased at every 27kHz we saw that the relationship
between the resonant frequencies was that:


So if you follow this pattern you can calculate every resonant frequency of the line.

Conclusion-

After performing this experiment and completing this report I believe this artificial line experiment is
a very helpful and useful experiment in understanding transmission lines in the way they work and
the fundamental concepts about them. This experiment is very important in understanding
transmission lines as it allows you to have a practical experience with them as well as seeing and
being able to understand the different functions and why transmission lines are so important in our
everyday life. Also by performing this experiment it gave me good understanding of transmission
lines and why they work in the way they do.

This experiment shows how the different functions of a transmission line works in open circuit, short
circuit and variable resistance termination setting. Also how the transmission line can work in the
time domain and the frequency domain. It also shows the effects of resonance on the line and how
the line has different resonant frequencies. Furthermore it allowed us to see the different ways we
can determine the length of the line and also how to calculate the propagation velocity. We were
able to see how the equations we have learnt are practically used.


                                                                                                     11
Jawad Chowdhury- 7641617


In conclusion I believe the artificial line experiment is a very good experiment and is fundamental in
being able to understand and to see how a transmission line actually works. Being able to see how it
works is what makes the experiment so useful and helpful in the understanding of transmission
lines.

Reference-

Lab Manual


                                                                                                    12

Artificial line laboratory 7641617

  • 1.
    Jawad Chowdhury- 7641617 Artificial Line Laboratory Objectives: The aim of this experiment was to be able to study the behaviour of a transmission line, with sinusoidal and step signal input under different terminating conditions. Also to analyse the output waves produced by the transmission line and to study there reflections, reflective co-efficient and the effects of the different termination conditions. By studying these different behaviours we should be able to determine the characteristic impedance and the length of the artificial transmission line with step input signal, using the time domain measurement technique based on the reflection concept, and with a sinusoidal excitation signal. Background Theory: General Information- The artificial line that was used in the lab consists of a number of sections and was used to simulate a length of power line spanning approximately 6000 meters. The sections were built up with inductive elements twisted around ferrite rings to provide an inductance of 300µH and capacitors of approximately 3500pF. Artificial transmission lines are discrete lumped circuit elements designed to represent real transmission lines. If it was possible to have an infinite number of circuit elements within our artificial line then we would be able to give a perfectly accurate simulation of a long transmission line, however this is not possible so we only have a finite number of sections with our artificial line and this allows us to only represent a transmission line below a high frequency limit. For our resonant condition of the artificial line is such that the reflected wave exactly opposes the applied input waveform. Also the lowest frequency for resonance is when the line length is one quarter of the wave length. Reflection Co-efficient- : Reflection Co-efficient, : Load Resistance, : Characteristic Impedance The reflection co-efficient is a very important concept for transmission lines. Termination Conditions- For (short circuit) For (open circuit) For (Match- load resistance is same as characteristic impedance) Impedance match is the proper termination if we don’t want any reflections. 1
  • 2.
    Jawad Chowdhury- 7641617 CharacteristicImpedance- Using KVL and KCL for a small section of the line and having the limit we arrive at ‘Telegraphers equations’: When the equations are linked together we derived the wave equation: The wave equation shows that the currents and voltages on the transmission line satisfy the one dimensional wave equation. Therefore since current satisfies the wave equation: And current and voltage are related by equation (1), so for the general function this gives: And since the forward waves are independent of the reverse waves we have: Where √ Within a constant we have: √ is equal to the Characteristic impedance of the line. 2
  • 3.
    Jawad Chowdhury- 7641617 Lengthof Line- Time Domain: In the time domain to calculate the length of line = speed of light x wave time from input to output Length = ( m Frequency Domain: To calculate the length of line we first have to find out the wave time by using the equation: So by using this equation we get the time as: Now that we know the time we can calculate the length of the line: Length of line = m Propagation Velocity- We know that √ for the velocity of wave propagation. So we can calculate the velocity as we know : √ Knowing this we can calculate the transit time of the transmission line. 3
  • 4.
    Jawad Chowdhury- 7641617 ExperimentalProcedure- Equipment: Agilent oscilloscope, Adjustable Frequency Signal generator, artificial line apparatus, Digital Multi-Meter (DMM) Part 1- Time Domain Measurement: (a) We set the switches on the artificial line apparatus so that it produces a full element line. We set the line termination to the open circuit setting and connected the oscilloscope to the end of the line so we could monitor the output. The source potentiometers were then adjusted so that the output waveform matched the input meaning there was no reflection. We then determined the time taken for the step input signal to travel from input to output and sketched the wave forms and estimated the time taken for reflections to travel back to the input. (b) Next with the load still on the open circuit setting and the source potentiometers adjusted so as to remove any reflections of the output wave we disconnected the output and connected one channel of the oscilloscope at the first element of the transition line. We then drew the wave forms at the signal input and at the true input. Then we switched the setting of the load to short circuit setting and drew the waveforms. (c) The input signal was disconnected and the source potentiometers were measured using the DMM. (d) The input signal was then reconnected and the termination setting was set to variable resistance (load) and we modified the load resistance till we found the value of termination resistance which gave the minimum reflection at the input. The resistance was then measured with the DMM and recorded. Part 2- Frequency Domain Measurement: (a) The adjustable frequency signal generator was connected up to the input and the oscilloscope was also connected in parallel. The signal generator was set to an input signal of 5V pk-pk with 0V d.c. offset. (b) Then the termination setting of the line was set to open circuit setting and we modified the frequency to find the lowest frequency at which the line is resonant. Once this value was found the DMM was used to plot the voltage distribution (pk-pk) along the line by measuring the voltage at each signal point along the line. (c) We then switched the termination setting to short circuit and measured the voltage distribution along the line without changing the frequency already set. (d) The termination setting was changed to the variable resistance and the resistance was adjusted so that the voltage distribution at each point along the line was as uniform as possible. By doing this the variable load resistance should be the same as the characteristic impedance of the line. This value was then measured by the DMM and recorded. (e) Finally we switched the setting back to the open circuit setting and recorded as many resonant frequencies as we could. 4
  • 5.
    Jawad Chowdhury- 7641617 Results- Part 1- Time Domain Measurement Time events: The time taken for the input step signal to go from input to output was . So the time taken for the reflection to come back to the input is equal to: Wave Forms: 1) Open Circuit setting- No Reflections Each interval Signal Voltage Start of Start of output input signal signal Time taken for signal to 1) Input travel from input to signal output. 2) Output Time taken for reflections signal to travel back to the input From our pictures we see that the time taken for the wave to travel from input to output in 1) is approximately 20µs and this would mean that the time for the reflection to return to input should equal where our reflective wave takes approximately 40µs to return to the input. 2) Signal input and the true input: Start of Start of true input signal input signal Input signal True input signal 40µs Step Time for Reflected wave Input to comes back- 40µs When the termination setting is set to open circuit and the reflective wave comes back after 40µs the true input is the same as the signal input as 5
  • 6.
    Jawad Chowdhury- 7641617 3) Signal Input and True Input- Short Circuit: Start of Start of true input signal input signal Time taken for input signal to be reflected and return 40µs back to input With the termination condition set to short circuit we see that the signal input wave is shown as the reflection at the true input when the wave returns to input after 40µs as when short circuit setting . – In the time domain in part 1 of our experiment we measured the source potentiometer using the DMM to get the resistance, we then set the termination setting to variable resistance (load) and we then changed the value of the termination resistance until we got minimum reflection at the input. Once we got this we took the measurement of the resistance using the DMM. 6
  • 7.
    Jawad Chowdhury- 7641617 Part2- Frequency Domain Measurement- Resonant Frequency- We set the termination setting to open circuit setting and then modified the frequency till we found the lowest value at which the line is resonant. Lowest Resonant Frequency- 13.96 kHz Voltage Distribution (pk-pk) for open circuit at lowest resonant Frequency Voltage- Open Circuit Section (V) 0 0.073 1 0.791 2 1.533 3 2.277 4 3.01 5 3.718 Open Circuit Voltage Distribution 6 4.41 12 7 5.086 Voltage pk-pk (V) 8 5.724 10 9 6.327 10 6.895 8 11 7.415 6 12 7.907 13 8.34 4 14 8.691 2 15 8.983 16 9.226 0 17 9.414 0 5 10 15 20 25 18 9.55 19 9.635 Section 20 9.66 7
  • 8.
    Jawad Chowdhury- 7641617 VoltageDistribution (pk-pk) for Short Circuit at lowest resonant Frequency Voltage- Short Circuit Section (V) 0 1.826 1 1.814 2 1.792 3 1.76 4 1.718 5 1.666 6 1.605 Short Circuit Voltage Distribution 7 1.534 2 Voltage pk-pk (V) 8 1.455 1.8 9 1.367 1.6 10 1.271 1.4 11 1.171 1.2 12 1.067 1 0.8 13 0.955 0.6 14 0.826 0.4 15 0.696 0.2 16 0.561 0 17 0.427 0 5 10 15 20 25 18 0.292 19 0.151 Section 20 0.021 Value for for Frequency Domain Measurement The termination setting was set to variable resistance (load) and the resistance was adjusted so that the voltage distribution across each section was the same. The value measured was: 8
  • 9.
    Jawad Chowdhury- 7641617 OtherResonant Frequencies The termination setting was set once again to open circuit setting and we then used the oscilloscope to see the other resonant frequencies by varying the frequency. From our experiment we saw that it was quite difficult to see the value all the time as the wave was so small and also the equipment we used was not sensitive enough to be able to increase the frequency by a small amount once you reached a high number therefore you are unable to see all the values. However we noticed there was a pattern and the resonant frequency was linear so the same value increased each time would give a line that was resonant. Resonant Frequencies (kHz) 44.3 69.0 98.1 126.5 145.9 172.9 The resonant Frequencies occur at each interval of approximately 27 kHz. Data Analysis and Discussion- Part1: Explanation of waveforms: 1) In part 1 for our First waveform we set the termination condition to open circuit and connected a signal at the input and had a connection at the output to see the output wave compared to the input. Once we saw the output wave we modified the value of till we had an output wave that matched the input so that it had no reflections. The output wave starts after 20µs as that is the time taken to go from input to output. The value of remained the same through out the rest of the measurements in part 1. 2) For our second condition the termination setting remained as open circuit. However we disconnected the channel from the output and connected it to the true input to see the true input wave form. We see that there is no reflection at the true input. The reason for this can be explained using the equation for the reflection co-efficient: When the circuit is set to the open circuit setting the value for is very large, ideally the value for will be infinite, and the value for is very small, negligible, therefore the value for the reflection co-efficient so when the signal is multiplied by the reflection co-efficient when the signal returns to the input we see that the true input signal is almost identical to the input with no reflection. We also see that the true input wave starts after 40µs as that is the time taken for the reflection to come back to the input. 9
  • 10.
    Jawad Chowdhury- 7641617 3)For our third condition the termination setting is set to short circuit setting. We see that the true input is a reflection of the input. This can also be explained using the equation for the reflection co- efficient. While in short circuit setting the value for is very small, ideally 0, and therefore making the value for = -1. So as the value for the reflection co-efficient the wave we see at the true input will be multiplied by the value and therefore give us a wave that is a reflection of the input at the true input. That is why we see a reflection. Also the reflection wave at the true input begins after 40µs as that is the time it takes for the reflected wave to come back to the input. Explanation why In part 1 when we took measurements of the source resistance we saw that it was not the same value as the load resistance . The values we got were not the same as there is impedance in the oscilloscope and in the wires which caused the values not to be the same. Also the reflections caused by the load resistance are visible on the input signal; where as the reflections caused by the source resistance are visible on the output signal. This means we can’t match them identically and therefore there would be a difference between the output and input causing the values of not to be the same. However the values were not far off each other. Part 2- Short circuit like behaviour at resonance- When the line is resonant the inductance and capacitance are equal so they cancel each other out causing the circuit to behave as if it was short circuit. Comparison between resistance values taken in parts 1 and 2 The value we measured for in part 1 is very close to the value for measured in part 2, but not exact. The value would not be exact because of impedance in the circuit and other losses but the value from part 2 is very close to the values from part 1. Part1: Part2: All the values are quite similar to each other. Analysis of the length of line Already in the report I have analysed the length of line by calculating the length of the line in the time domain and the length of line in the frequency domain. In the time domain we calculated the length to be 6000m and in the frequency domain we calculated it to be 5373m. 10
  • 11.
    Jawad Chowdhury- 7641617 Wecan also use another method to calculate the transit time of the line and also its length. We can do this by using the propagation velocity. We previously in the report calculated the propagation velocity to be . We also know that there are 21 sections on the artificial line that we used, so we can use both these values to calculate the transit time: So the value we have calculated for the transit time . Using this value we can calculate the maximum length of the real transmission line the apparatus we used simulated: m So the maximum length of line of the real transmission line this apparatus represents is 6450m. This value is similar to the values calculated in the frequency and time domain. Why at resonant frequency amplitude of the input goes down to almost zero? At resonant frequency the amplitude of the input almost goes down to zero as the impedance of the line is the same and the reflected wave cancels out the input making it almost zero as the reflected wave has the same magnitude and phase as the forward wave. Relationship between Resonant Frequencies The values we got for the resonant frequencies showed a pattern, in the table under other resonant frequencies, where it increased every 27 kHz approximately. The lowest resonant frequency we measured was 13.96 kHz. So as the values increased at every 27kHz we saw that the relationship between the resonant frequencies was that: So if you follow this pattern you can calculate every resonant frequency of the line. Conclusion- After performing this experiment and completing this report I believe this artificial line experiment is a very helpful and useful experiment in understanding transmission lines in the way they work and the fundamental concepts about them. This experiment is very important in understanding transmission lines as it allows you to have a practical experience with them as well as seeing and being able to understand the different functions and why transmission lines are so important in our everyday life. Also by performing this experiment it gave me good understanding of transmission lines and why they work in the way they do. This experiment shows how the different functions of a transmission line works in open circuit, short circuit and variable resistance termination setting. Also how the transmission line can work in the time domain and the frequency domain. It also shows the effects of resonance on the line and how the line has different resonant frequencies. Furthermore it allowed us to see the different ways we can determine the length of the line and also how to calculate the propagation velocity. We were able to see how the equations we have learnt are practically used. 11
  • 12.
    Jawad Chowdhury- 7641617 Inconclusion I believe the artificial line experiment is a very good experiment and is fundamental in being able to understand and to see how a transmission line actually works. Being able to see how it works is what makes the experiment so useful and helpful in the understanding of transmission lines. Reference- Lab Manual 12