Download to read offline


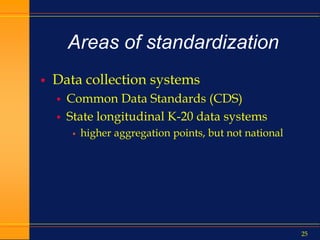
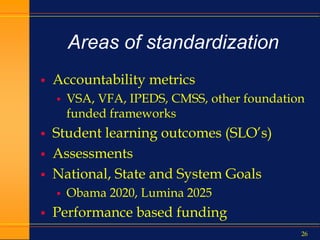


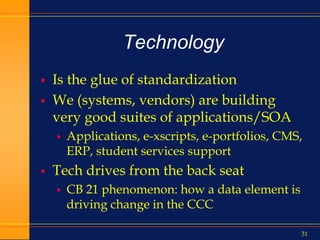
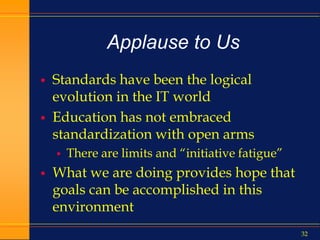

This document summarizes how technology and the internet have changed over the past 10 years. It discusses the rise of Google and social media, how e-business has evolved, and the growth of online education. It also outlines how standardization in areas like data collection, accountability metrics, and common course numbering can help improve student outcomes at state higher education systems. Technology is enabling greater standardization, and while challenging for education, it provides opportunities if implemented carefully with student needs in mind.


