Download to read offline
![What students think they gain?
I think I am more openly critical
(in the positive sense)
Day to day when I have my book I have very different
approach from recording my notes for example
[in my new job], there will reports and
planning to be drawn and I think that this will
be an aspect of my job where I can say yes
the OU study and discipline I’ve received
from the OU has actually contributed to that.
I observe things better, work into deeper and
work on the whole picture rather than narrow.
I think more logically and more ‘why did that
happen, why did that happen’, there is more
questioning, instead of just to accept things.
I am much better at time management, I am much more
organised now and planning things in advance.
now I say, ‘you know what, I can do that in future’.
I feel more confident and I am happier
because I am doing something I have always
wanted to be doing and something that
interests me
I think I can go confidently to
speak what I learned. But
even to a job that isn’t directly
related to this subject area. I
could talk about my
experiences, my time
management, team working,
computer skills as I feel much
more confident, I can say,
‘actually I have done this’.
Which was one of the
reasons I wanted to a degree.](https://image.slidesharecdn.com/bigdata-bartrjekaterinar-openuniversity-180326095115/75/Are-assessment-scores-good-proxies-of-estimating-learning-gains-3-2048.jpg)
![Do grades matter?
How well do your grades represent your progress?
probably in the same way that many other people when
they look at their own assignment results and exam results
…. I feel that I am doing fairly well but I’d always like to
improve myself to my results.
I get quite upset when I get around 70s
… because I am putting so much effort I want my grades to reflect it.
They usually go up. But it is Marginal. 5 marks across all the TMAs
that’s the variance, it just varies very slightly
Even if it is 1-2 marks I say what did I do differently and
I go back to tutor to see what did I do differently. What
happened, what caused it?
Well there are questions with the text books, exercises. So
if I get correct answer, I know I am doing fine. When I say
correct answer that’s not the end product that’s the whole
answer check through it
“I suppose you could say… the skills you learn, like group work, presenting and being able to talk to people…
I would say the main way that you think about [achievement], it’s just the grade because… that’s what is going
on your CV… and affect what job you get. … I’d say the skills you learn as well as becoming an all-rounded person
are quite important as well”.](https://image.slidesharecdn.com/bigdata-bartrjekaterinar-openuniversity-180326095115/75/Are-assessment-scores-good-proxies-of-estimating-learning-gains-4-2048.jpg)
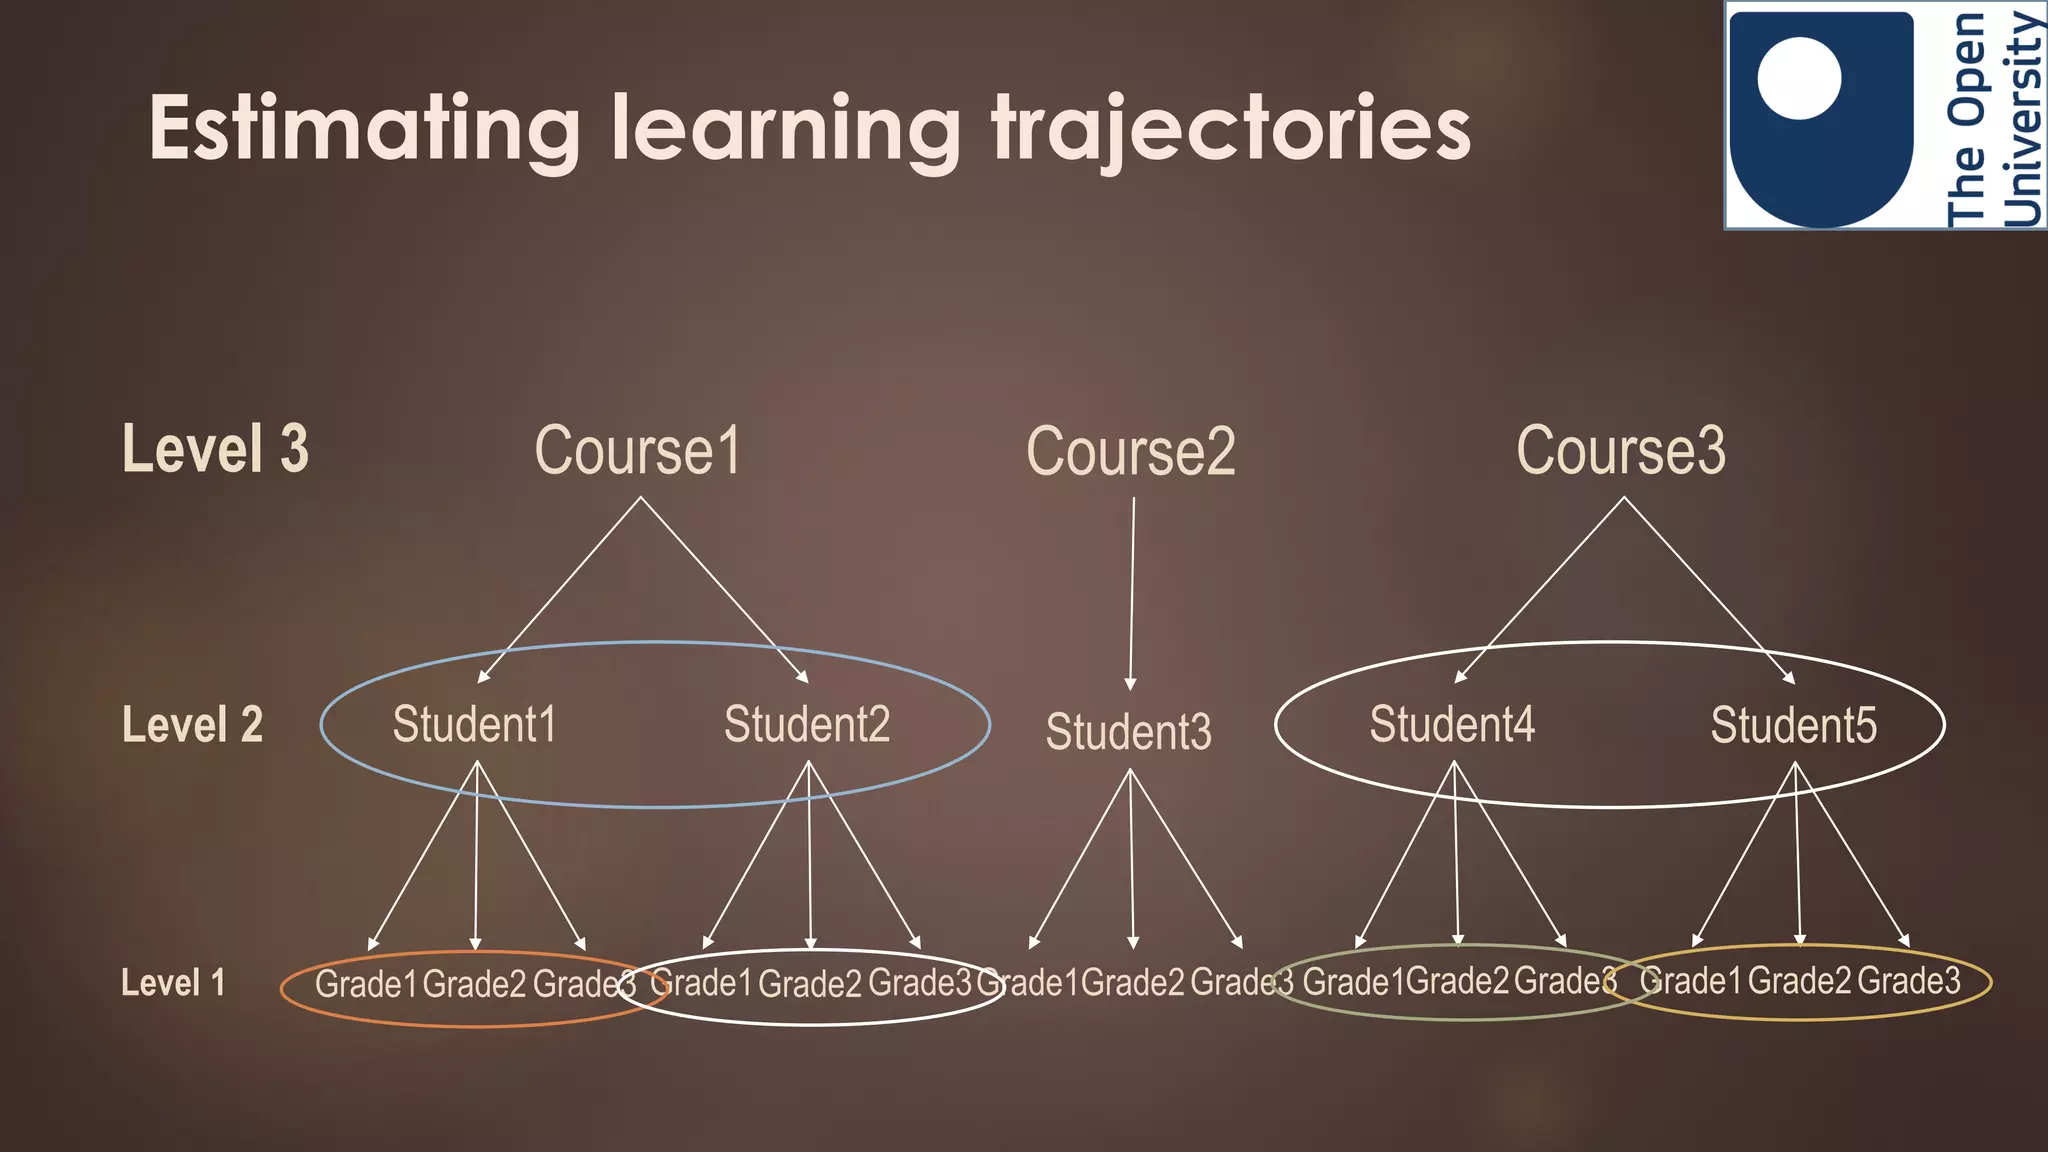

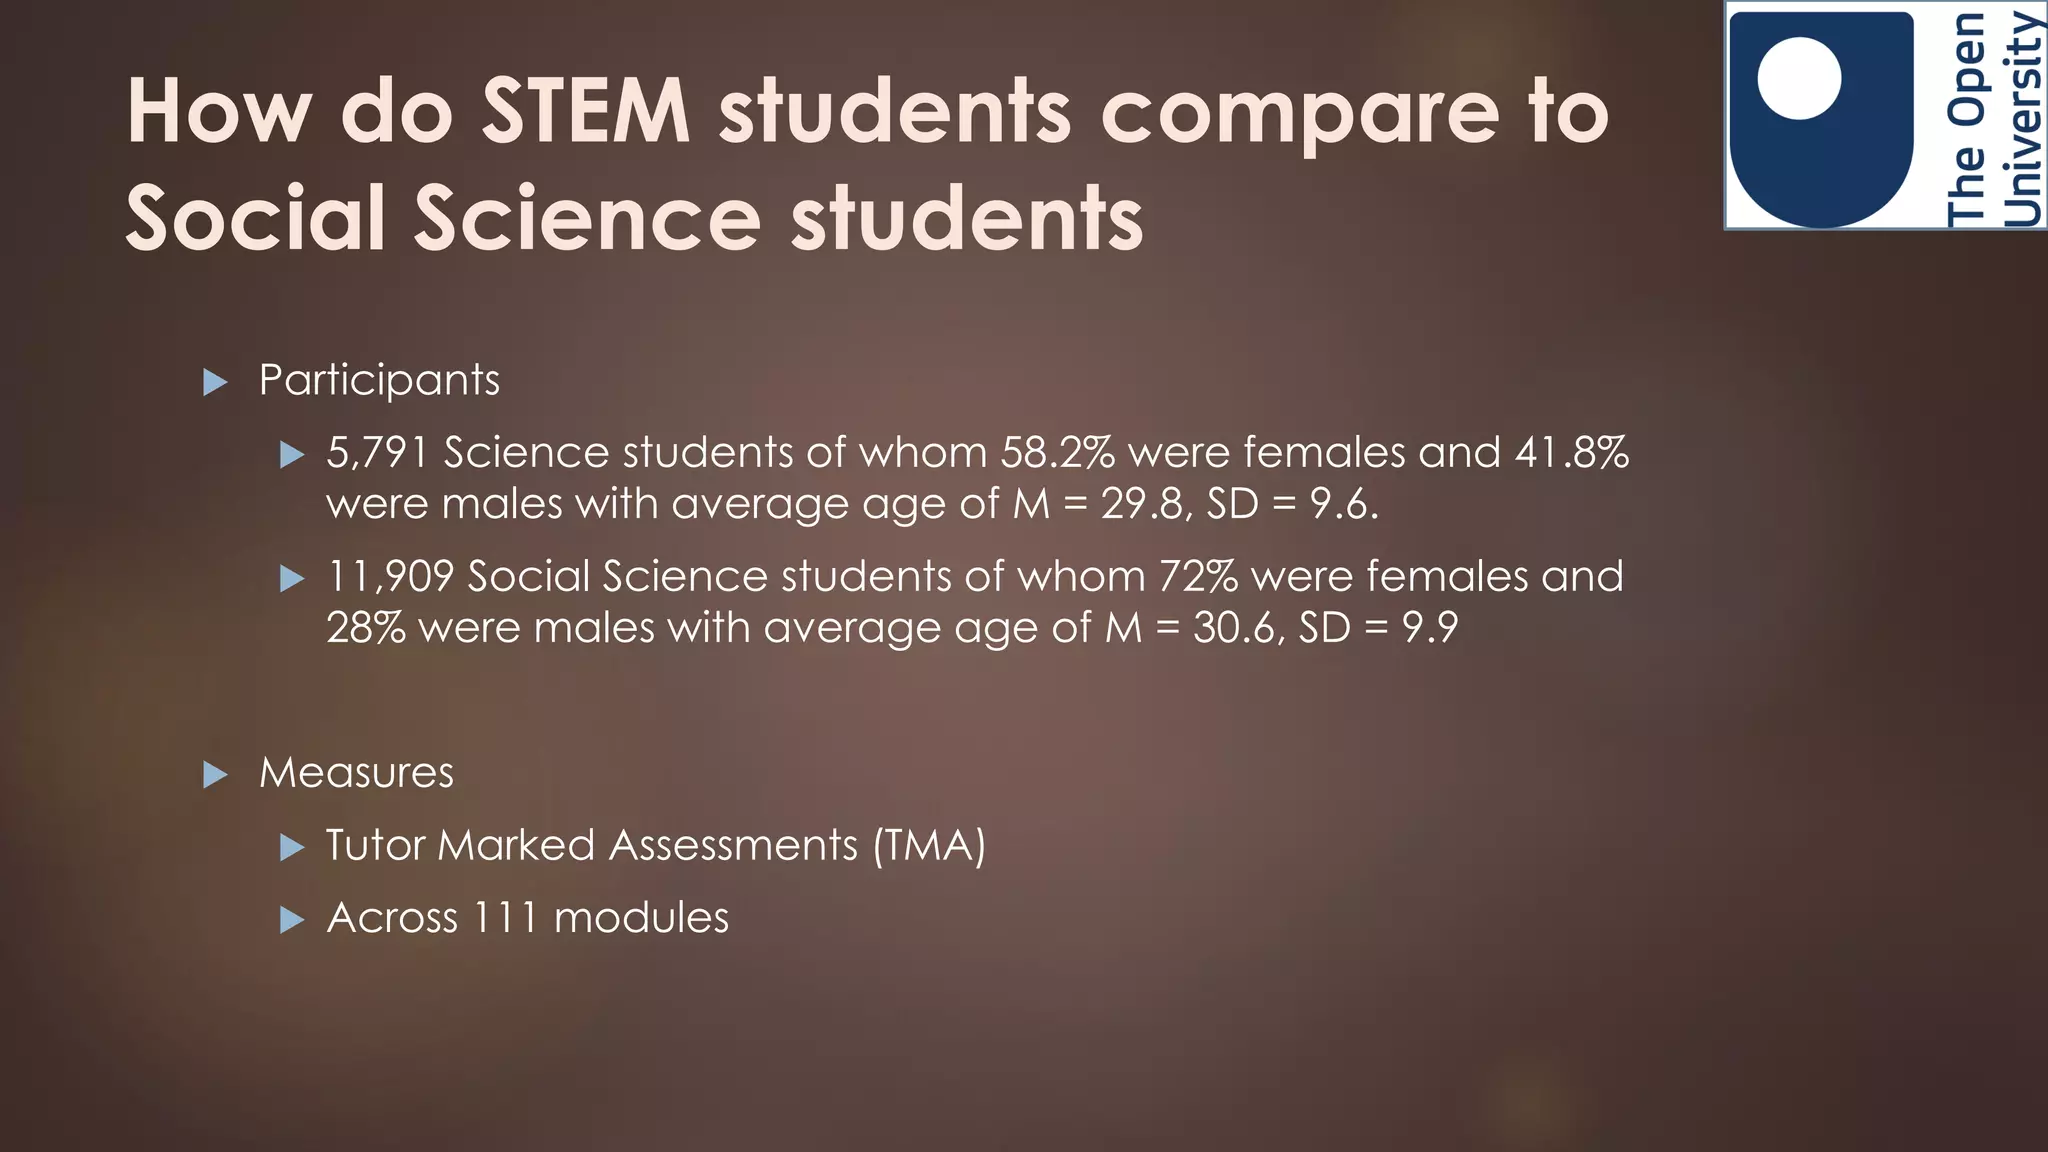
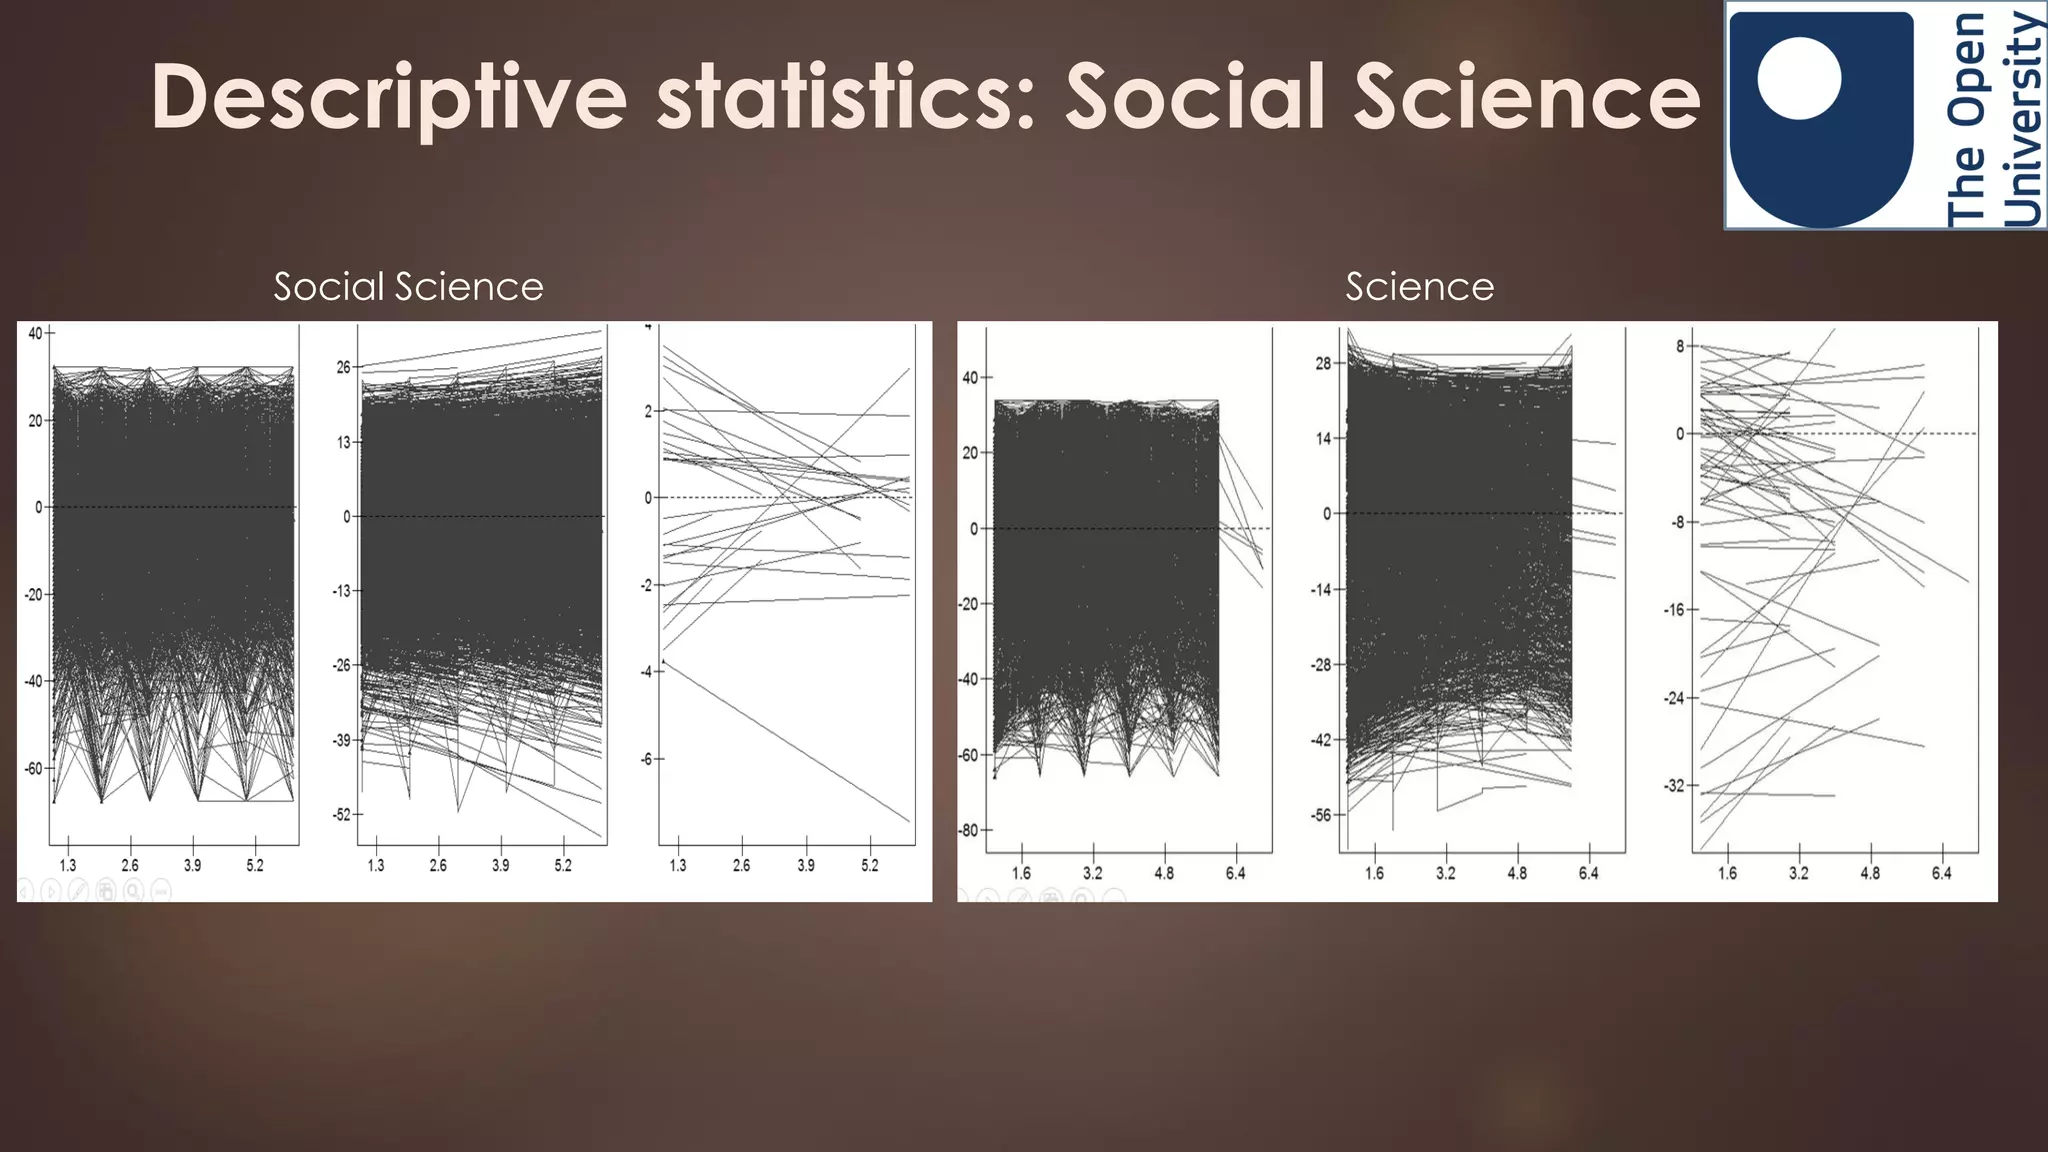
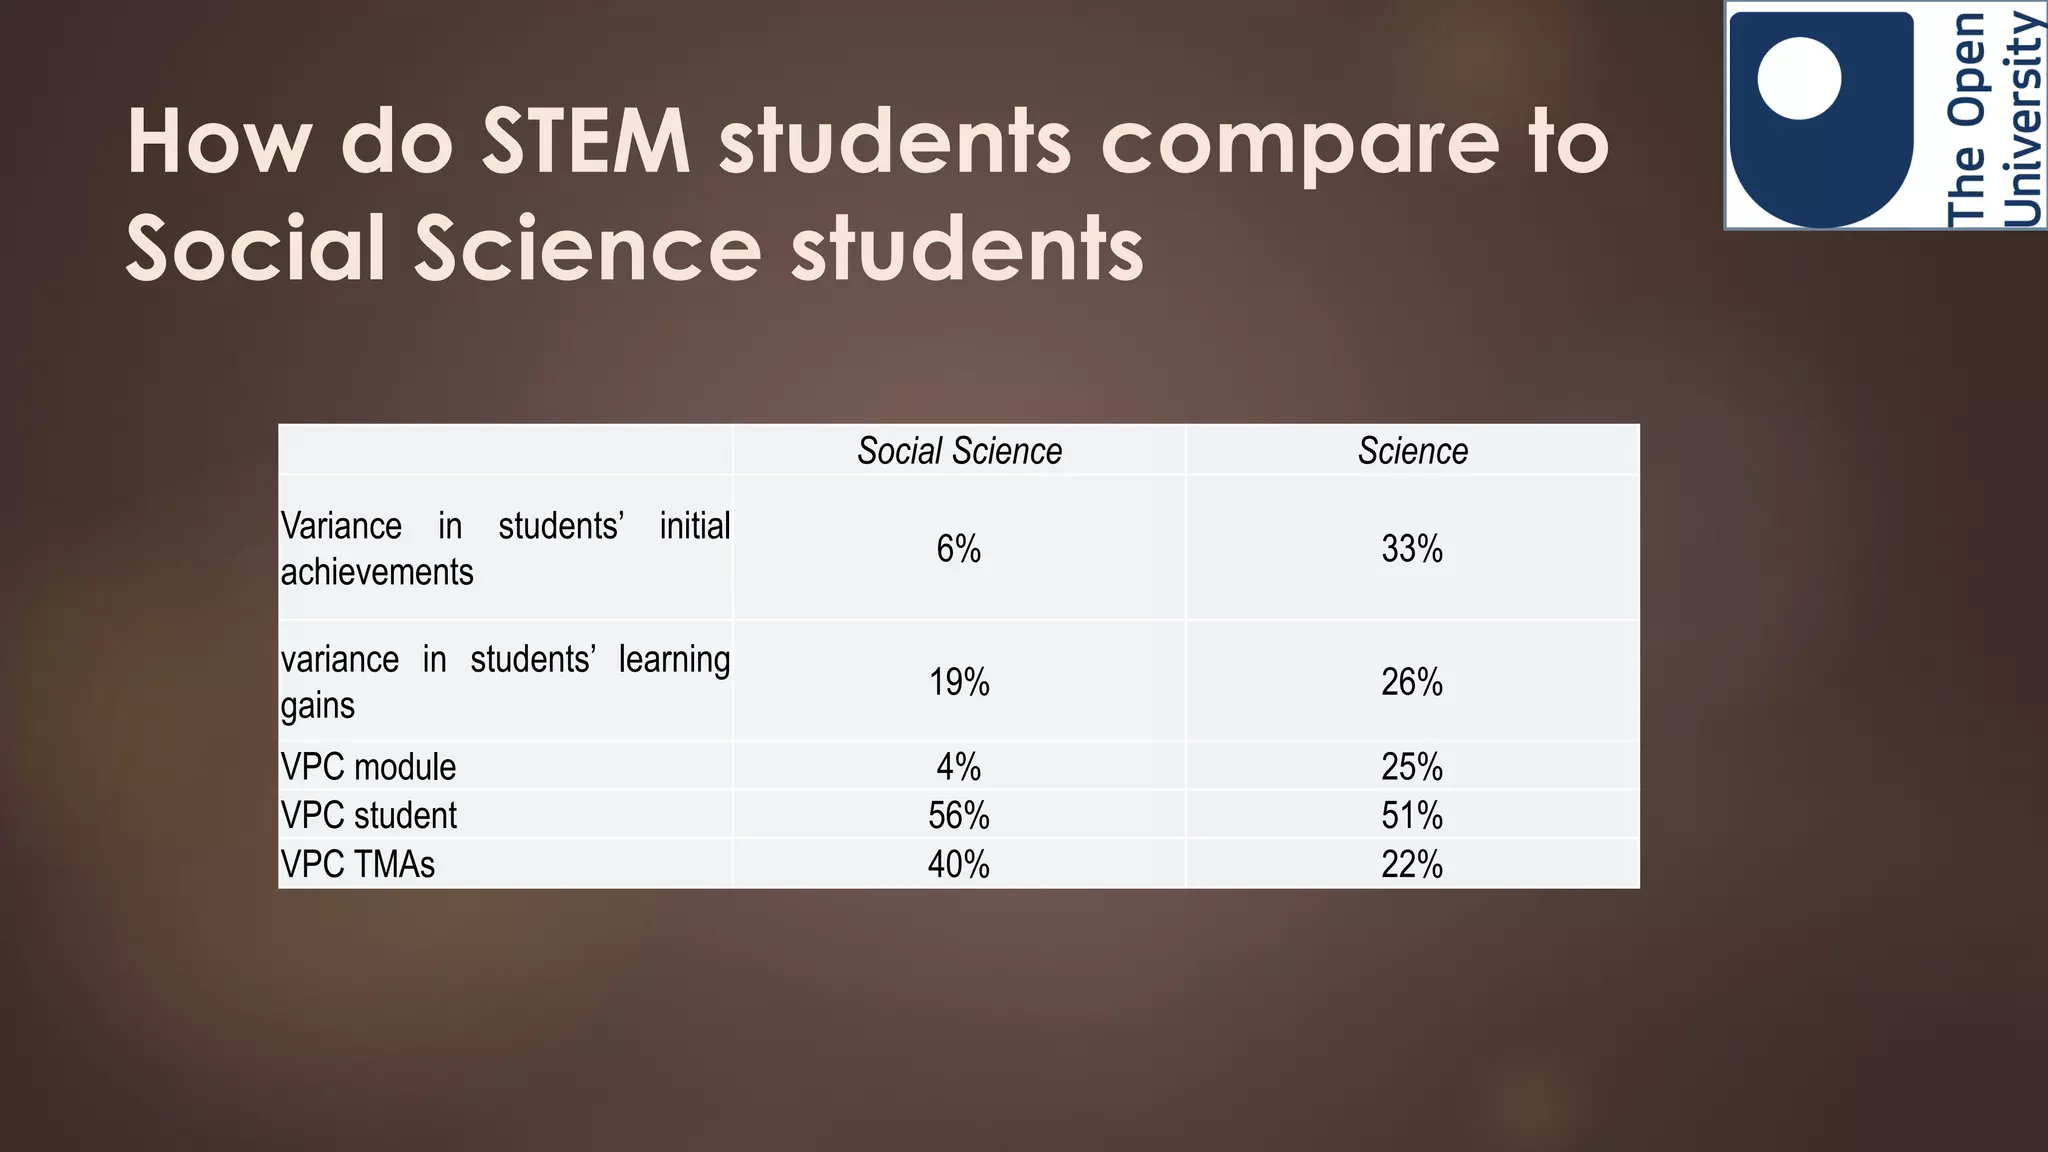
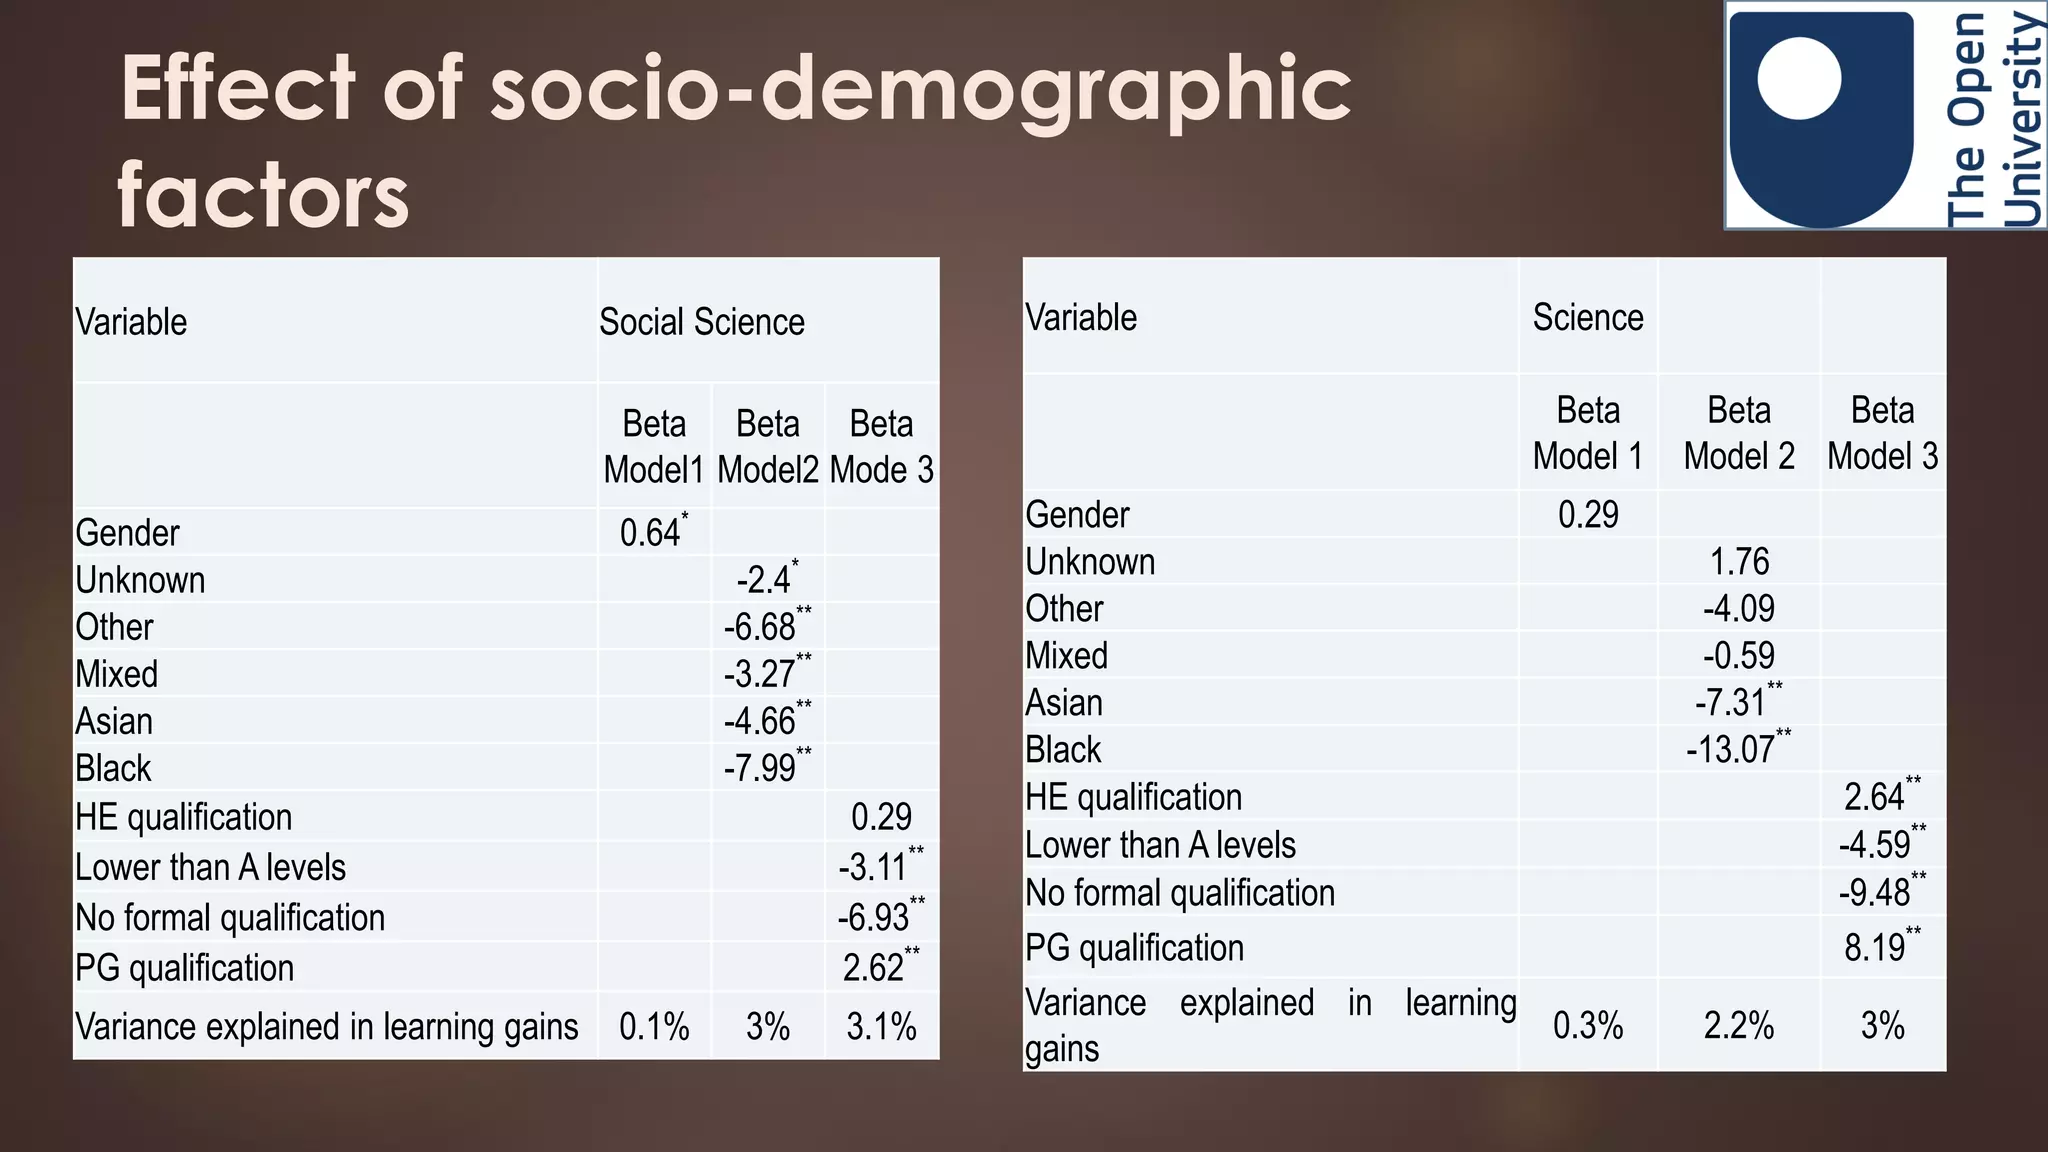
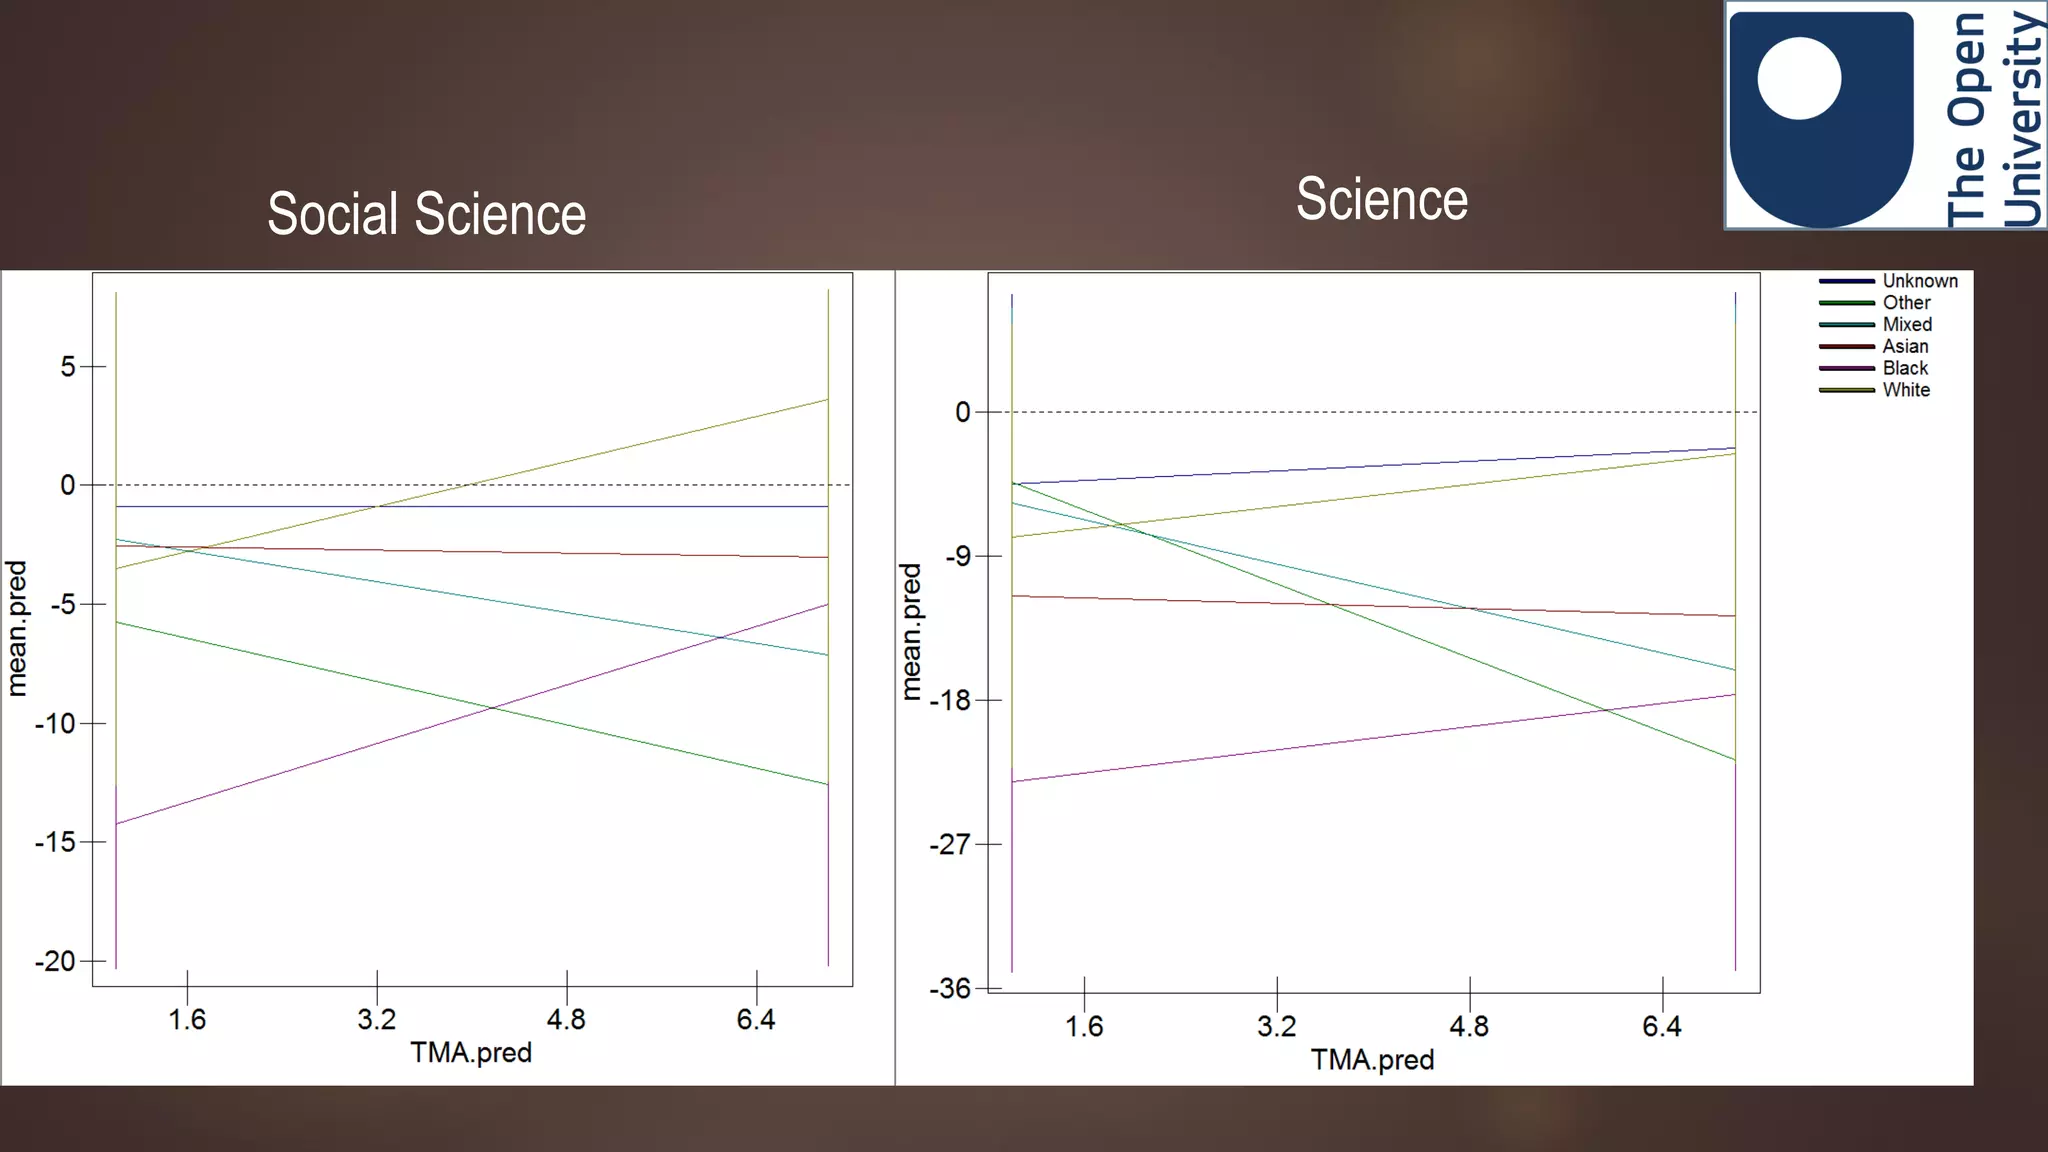
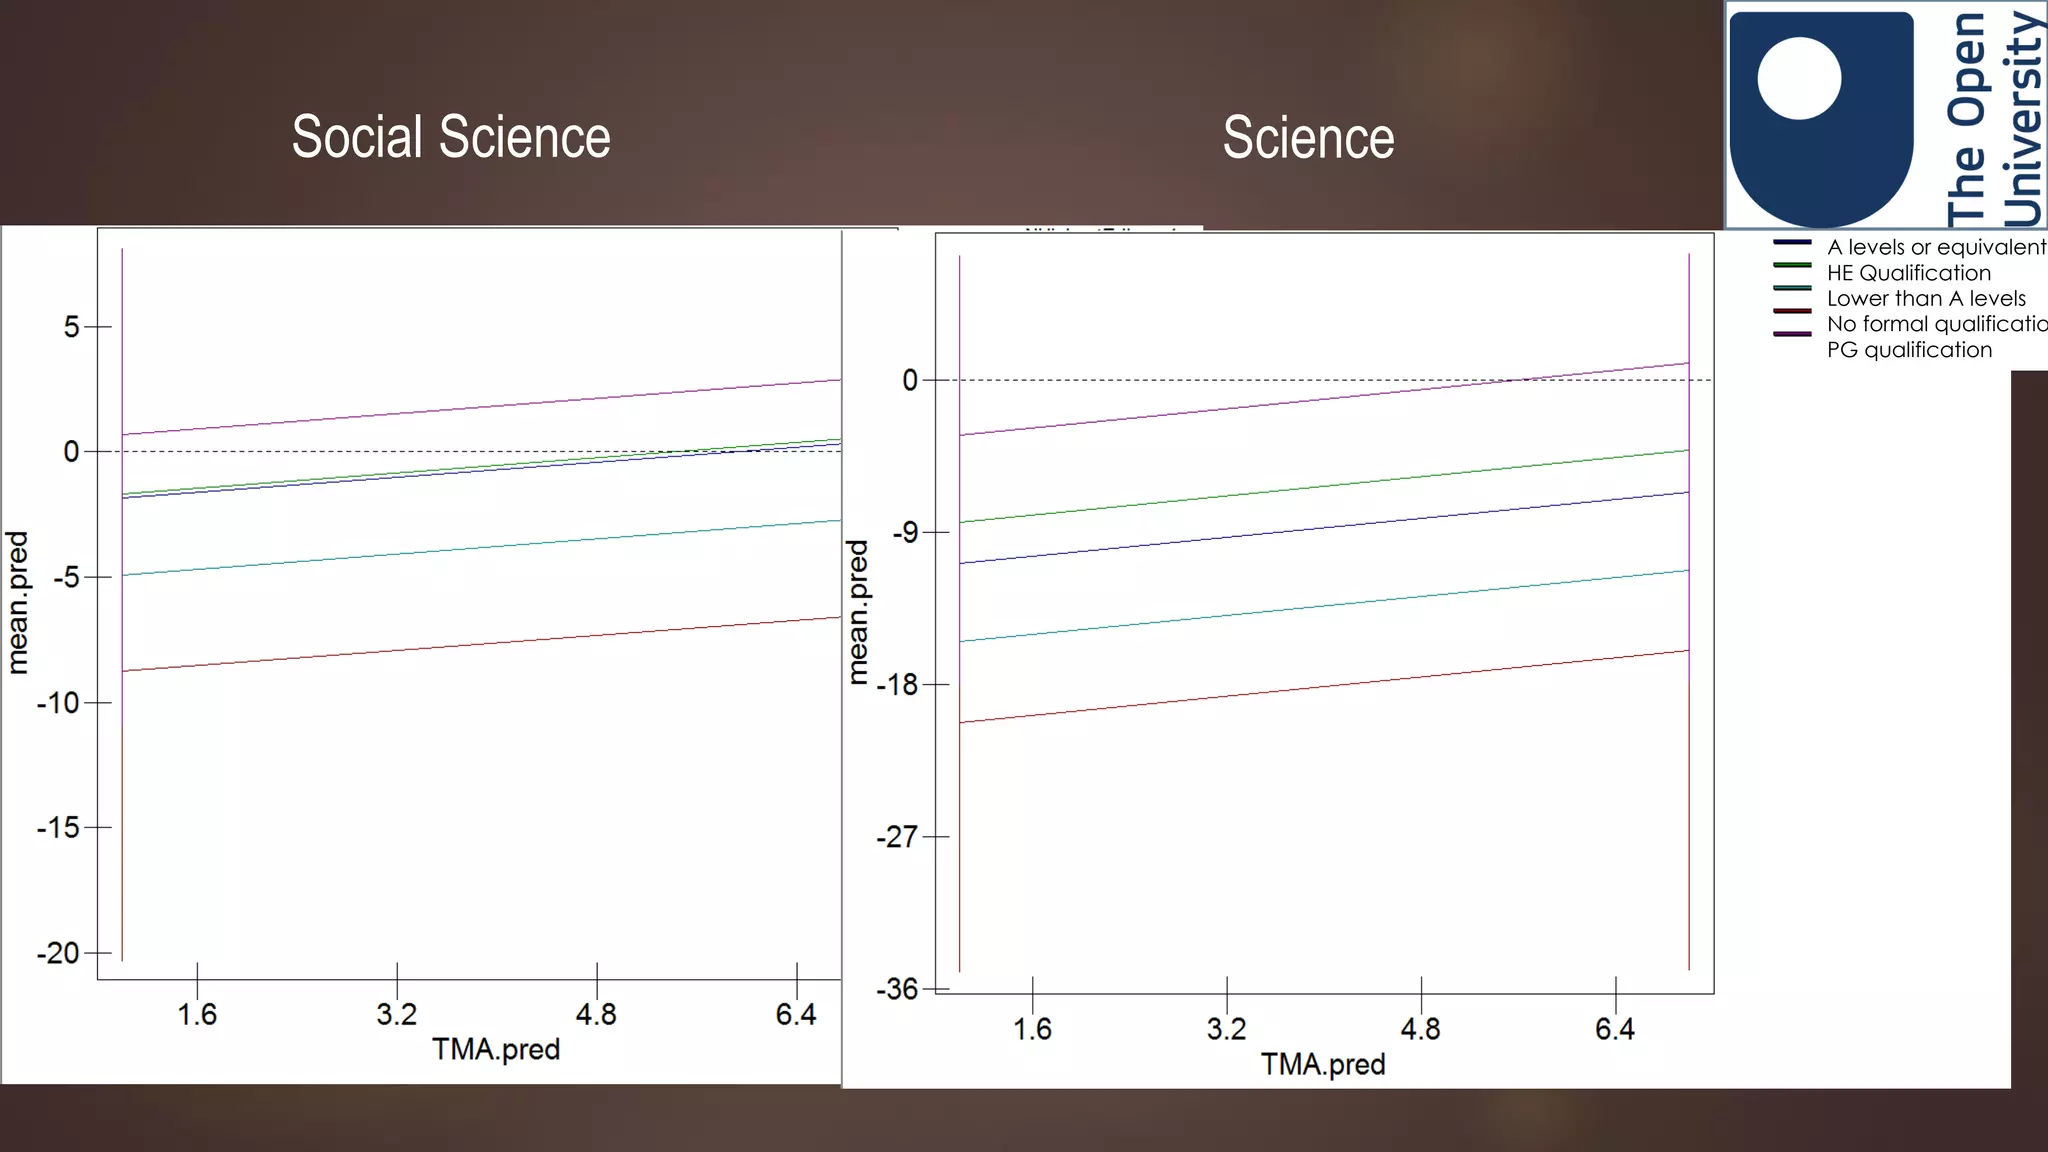
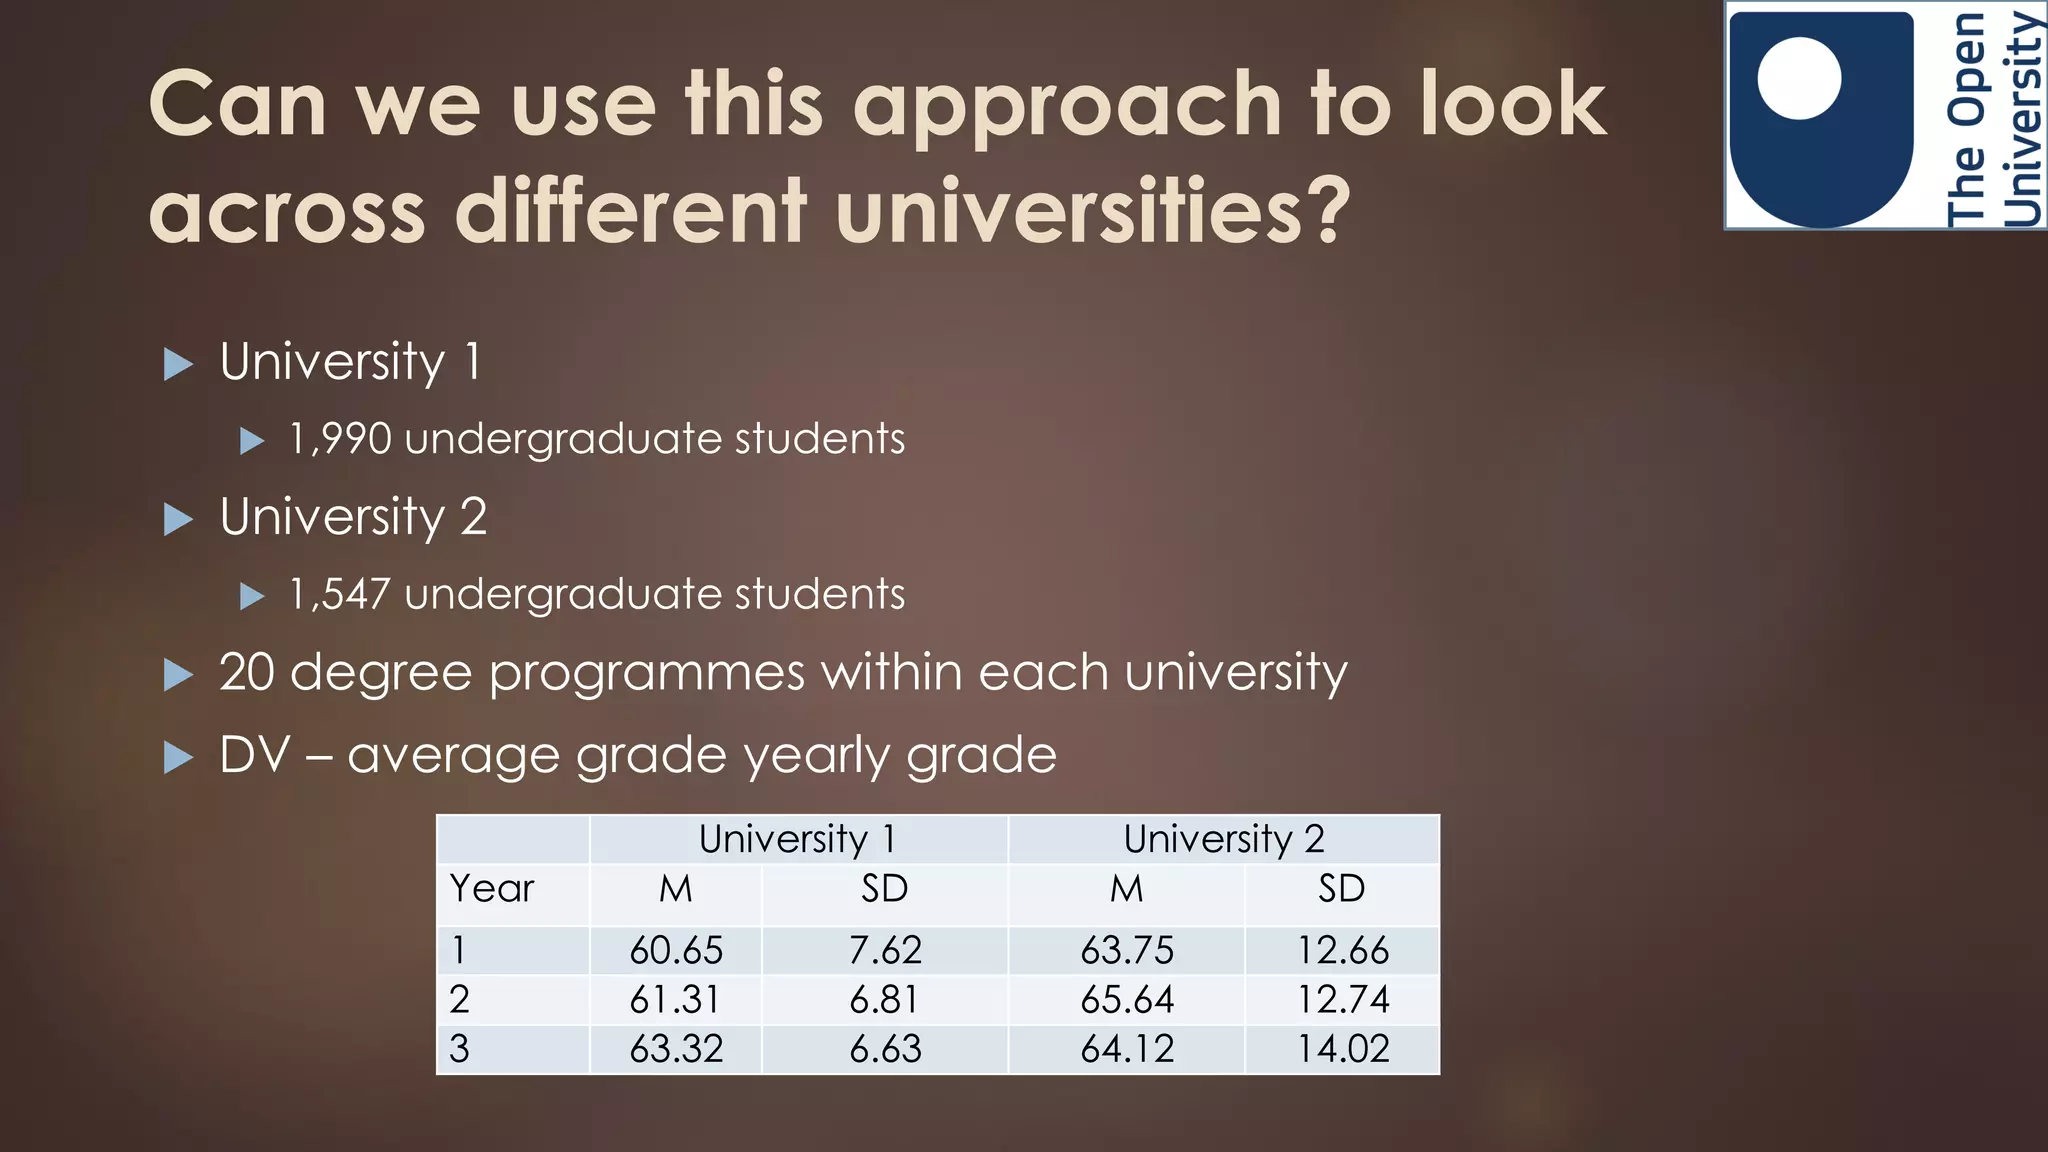


This study examined learning gains among humanities and science students using assessment scores from a large sample of over 17,000 students. The researchers found that science students showed more variance in initial achievement and learning gains compared to social science students. Socio-demographic factors like gender, ethnicity and prior education explained more variance in learning gains for science students. The study also compared learning gains across universities, finding substantial differences at the departmental level, suggesting that aggregate estimates can be misleading. Multilevel modeling provided a more accurate method for estimating learning gains compared to simple linear models.


