Download to read offline


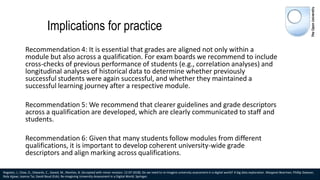


The document discusses myths related to student behavior and learning outcomes at the Open University, presenting data on various misconceptions about student engagement, satisfaction, and learning gains. It highlights the impact of confirmation bias and stresses the importance of evidence-based practices in educating students about module pathways and assessment designs. Recommendations include improving communication regarding module alignment and grading consistency across qualifications to enhance the learning experience.


