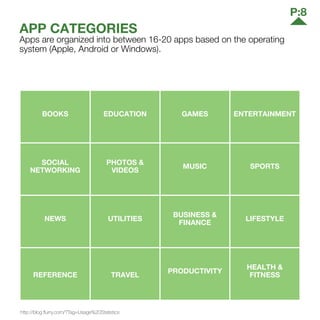
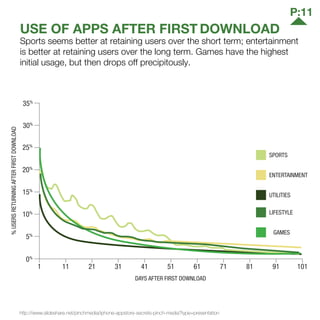
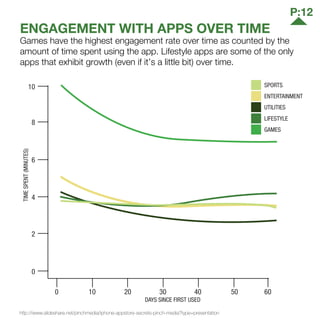
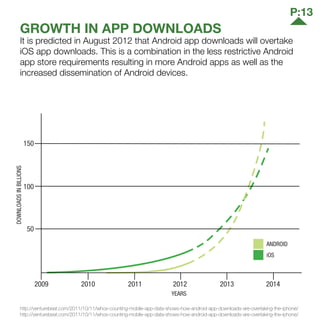
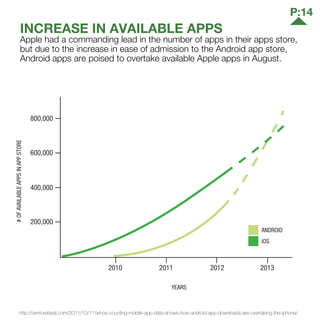
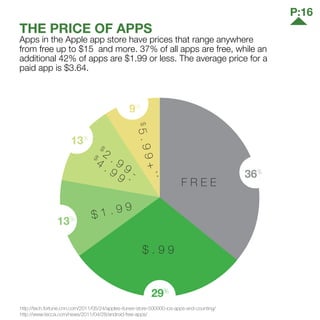
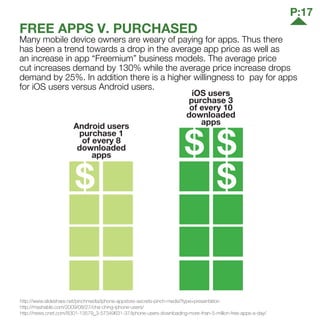
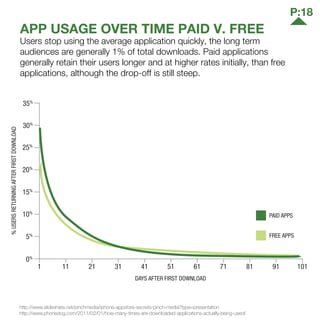
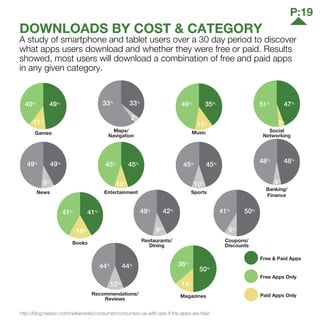
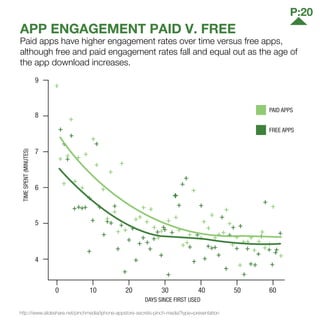
WHAT ARE APPS?
Apps are small computer programs built specifically for mobile
devices. There are apps for almost any situation available and can cost
anywhere from free to $100 or more, however most cost a dollar or
two. Most apps are downloaded from the Apple App store or Android
Play Marketplace. Apps functions generally can fall into one of 3
categories: Content Creation, Content Consumption and Games, with
some overlap.
APPS.Last Updated: 7/23/2012
P:2
TABLE OF CONTENTS
INTRODUCTION TO APPS
	4 — How people are using their phone
	 5 — App downloader demographics
	 6 — Operating system app preferences
KINDS OF APPS
	 8 — App categories
	 9 — App categories popularity
	 10 — Most populous app categories
	 11 — Use of apps after first download by category
	12 — Engagement with apps over time by category
	 13 — Growth in app downloads by operating system
	 14 — Increase in available apps by operating system store
APPS AND PRICE
	 16 — The price of apps
	 17 —	Free apps v. purchased apps
	 18 — App usage over time paid v. free
	 19 — Downloads by cost and category
	20 — App engagement paid v. free
OTHER STATS
	 22 — App development: a gamble
	 23 —	App development: platform
	 24 — Cost per loyal user
	 25 — Windows apps
INTRO
TO
APPS	
P:3
SOME BASIC INFORMATION ABOUT
APPLICATIONS FOR MOBILE DEVICES.
HOW PEOPLE USE THEIR PHONES
Towards the end of 2011, Nielsen performed a survey of smartphone
owners to how they actually used their phones. The results showed that
53% of phone time is spent using Apps.
1%
Camera
2%
Music/Video
4%
Maps/Location
5%
Email/IM 5%
Social Networking
6%
Phone
10%
Browser
14%
Texting
53%
Apps
P:4
GENDER
APP DOWNLOADER DEMOGRAPHICS
57%
MALE
43%
FEMALE
41%
< $50,000
37%
$75,000
15%
$50,000-
$74,999
INCOME
47%
18-29
39%
30-49
14%
50+
AGE
25%
HIGH
SCHOOL
GRAD
38%
COLLEGE
GRAD
29%
SOME
COLLEGE
8%<HIGHSCHOOL
EDUCATION
http://blog.nielsen.com/nielsenwire/consumer/consumers-ok-with-ads-if-the-apps-are-free/
http://www.slideshare.net/PewInternet/the-state-ofmobileamericanfais
P:5
OPERATING SYSTEM APP PREFERENCE
Mobile users have somewhere between 10 and 300 apps on their
devices. The average Android device user has about 22 apps on
their devices (in addition to the pre loaded ones) while Android users
specifically have an average of 33 apps on theirs devices.
ALL PHONES
AVERAGE
ANDROID iOS
http://mobithinking.com/mobile-marketing-tools/latest-mobile-stats#mobile-app-stores
http://blog.nielsen.com/nielsenwire/mediauniverse/
P:6
KINDS
OF
APPS
P:7
INFORMATION ABOUT THE DIFFERENT
CATEGORIES OF APPS AND USERS’
PREFERENCES FOR DIFFERENT KINDS
OF APPS.
BOOKS EDUCATION GAMES ENTERTAINMENT
SOCIAL
NETWORKING
PHOTOS &
VIDEOS
MUSIC SPORTS
NEWS UTILITIES
BUSINESS &
FINANCE
LIFESTYLE
REFERENCE TRAVEL
PRODUCTIVITY
HEALTH &
FITNESS
APP CATEGORIES
Apps are organized into between 16-20 apps based on the operating
system (Apple, Android or Windows).
http://blog.flurry.com/?Tag=Usage%20Statistics
P:8
BOOKS
23%
of user downloads
EDUCATION
18%
of user downloads
GAMES
68%
of user downloads
ENTERTAINMENT
31%
of user downloads
SOCIAL
NETWORKING
45%
of user downloads
PHOTOS &
VIDEOS
25%
of user downloads
MUSIC
45%
of user downloads
SPORTS
31%
of user downloads
NEWS
33%
of user downloads
UTILITIES
16%
of user downloads
BUSINESS &
FINANCE
30%
of user downloads
LIFESTYLE
23%
of user downloads
REFERENCE
16%
of user downloads
TRAVEL
15%
of user downloads
PRODUCTIVITY
31%
of user downloads
HEALTH &
FITNESS
25%
of user downloads
APP CATEGORIES POPULARITY
Some app categories are more popular than others. Games are the most
popular app category followed by Social Networking and Music apps.
Travel, Reference, Utilities and Education have the lowest percentage of
downloaders.
http://androinica.com/2010/09/the-average-android-user-has-25-apps-and-loves-games-android-market-has-80000-apps/
http://blog.flurry.com/?Tag=Usage%20Statistics
P:9
1 0 0%
8 0%
6 0%
4 0%
2 0%
0%
2008 2009 2010 2012
Other
44%
43%44%
51%
14%17%
14%
10%
8%
8%
7%
3%
11%11%
13%
24%
8%
15%14%17%
7%7%5%
4%
Books
Education
Entertainment
Games
Lifestyle
MOST POPULOUS APP CATEGORIES
The 5 most popular app categories in terms of apps in existence
are Books, Education, Entertainment, Games and Lifestyle which
collectively make up 56% of apps available in app stores. The
other 13 or so app categories variously make up the remaining
44% of apps.
http://tech.fortune.cnn.com/2011/05/24/apples-itunes-store-500000-ios-apps-and-counting/
P:10
USE OF APPS AFTER FIRST DOWNLOAD
Sports seems better at retaining users over the short term; entertainment
is better at retaining users over the long term. Games have the highest
initial usage, but then drops off precipitously.
35%
30%
25%
20%
15%
10%
5%
0%
1 11 21 31
DAYS AFTER FIRST DOWNLOAD
41 51 61 71 81 91 101
%USERSRETURNINGAFTERFIRSTDOWNLOAD
http://www.slideshare.net/pinchmedia/iphone-appstore-secrets-pinch-media?type=presentation
LIFESTYLE
ENTERTAINMENT
SPORTS
GAMES
UTILITIES
P:11
LIFESTYLE
ENTERTAINMENT
SPORTS
GAMES
UTILITIES
10
8
6
4
2
0
0 10 20 30 40 50 60
ENGAGEMENT WITH APPS OVER TIME
Games have the highest engagement rate over time as counted by the
amount of time spent using the app. Lifestyle apps are some of the only
apps that exhibit growth (even if it’s a little bit) over time.
http://www.slideshare.net/pinchmedia/iphone-appstore-secrets-pinch-media?type=presentation
DAYS SINCE FIRST USED
TIMESPENT(MINUTES)
P:12
YEARS
DOWNLOADSINBILLIONS
GROWTH IN APP DOWNLOADS
It is predicted in August 2012 that Android app downloads will overtake
iOS app downloads. This is a combination in the less restrictive Android
app store requirements resulting in more Android apps as well as the
increased dissemination of Android devices.
50
100
150
2009 2010 2011 2012 2013 2014
iOS
ANDROID
http://venturebeat.com/2011/10/11/whos-counting-mobile-app-data-shows-how-android-app-downloads-are-overtaking-the-iphone/
P:13
INCREASE IN AVAILABLE APPS
Apple had a commanding lead in the number of apps in their apps store,
but due to the increase in ease of admission to the Android app store,
Android apps are poised to overtake available Apple apps in August.
http://venturebeat.com/2011/10/11/whos-counting-mobile-app-data-shows-how-android-app-downloads-are-overtaking-the-iphone/
iOS
ANDROID
2010
800,000
600,000
400,000
200,000
2011 2012 2013
YEARS
#OFAVAILABLEAPPSINAPPSTORE
P:14
APPS
AND
PRICE
P:15
DATA ABOUT HOW PRICE AFFECTS APP
DOWNLOAD AND ENGAGEMENT RATES.
F R E E
$ . 9 9
$ 1 . 9 9
$
2 . 9 9 -
$
4 . 9 9 *
$5.99+
**
36%
29%
13%
13%
9%
THE PRICE OF APPS
Apps in the Apple app store have prices that range anywhere
from free up to $15 and more. 37% of all apps are free, while an
additional 42% of apps are $1.99 or less. The average price for a
paid app is $3.64.
http://tech.fortune.cnn.com/2011/05/24/apples-itunes-store-500000-ios-apps-and-counting/
http://www.tecca.com/news/2011/04/28/android-free-apps/
P:16
FREE APPS V. PURCHASED
Many mobile device owners are weary of paying for apps. Thus there
has been a trend towards a drop in the average app price as well as
an increase in app “Freemium” business models. The average price
cut increases demand by 130% while the average price increase drops
demand by 25%. In addition there is a higher willingness to pay for apps
for iOS users versus Android users.
http://www.slideshare.net/pinchmedia/iphone-appstore-secrets-pinch-media?type=presentation
http://mashable.com/2009/08/27/cha-ching-iphone-users/
http://news.cnet.com/8301-13579_3-57349631-37/iphone-users-downloading-more-than-5-million-free-apps-a-day/
Android users
purchase 1
of every 8
downloaded
apps
iOS users
purchase 3
of every 10
downloaded
apps
P:17
APP USAGE OVER TIME PAID V. FREE
Users stop using the average application quickly, the long term
audiences are generally 1% of total downloads. Paid applications
generally retain their users longer and at higher rates initially, than free
applications, although the drop-off is still steep.
35%
30%
25%
20%
15%
10%
5%
0%
1 11 21 31
DAYS AFTER FIRST DOWNLOAD
PAID APPS
FREE APPS
41 51 61 71 81 91 101
%USERSRETURNINGAFTERFIRSTDOWNLOAD
http://www.slideshare.net/pinchmedia/iphone-appstore-secrets-pinch-media?type=presentation
http://www.phonedog.com/2011/02/01/how-many-times-are-downloaded-applications-actually-being-used/
P:18
Books Restaurants/
Dining
Coupons/
Discounts
Games Maps/
Navigation
Music Social
Networking
News Entertainment Sports
Banking/
Finance
MagazinesRecommendations/
Reviews
DOWNLOADS BY COST & CATEGORY
A study of smartphone and tablet users over a 30 day period to discover
what apps users download and whether they were free or paid. Results
showed, most users will download a combination of free and paid apps
in any given category.
Free & Paid Apps
Free Apps Only
Paid Apps Only
http://blog.nielsen.com/nielsenwire/consumer/consumers-ok-with-ads-if-the-apps-are-free/
50%44%
45%
45%
50%
42%
49%
41%
41%
49%
40%
11%
18%
16%
2%
33%
33%
51%
48%
48%
47%
35%
49%
2%
4%
9%
9%
49%
49%
41%
9%
12%
10%
10%
44%
45%
45%
36%
14%
P:19
APP ENGAGEMENT PAID V. FREE
Paid apps have higher engagement rates over time versus free apps,
although free and paid engagement rates fall and equal out as the age of
the app download increases.
http://www.slideshare.net/pinchmedia/iphone-appstore-secrets-pinch-media?type=presentation
TIMESPENT(MINUTES)
DAYS SINCE FIRST USED
9
8
7
6
5
4
0 10 20 30 40 50 60
PAID APPS
FREE APPS
P:20
OTHER
STATS
P:21
FURTHER INFORMATION ABOUT APP
DEVELOPMENT STRATEGIES, THE
WINDOWS PHONE APP ENVIRONMENT
AND MARKETING COSTS.
APP DEVELOPMENT: A GAMBLE
There have been over 10 billion apps sold in app stores today with as
much as $250 million being spent in app stores every month. However,
these huge numbers have attracted another growing number: the
number of app publishers and the number of apps they are creating,
namely 500,00 apps available for iOS and another 300,000 available for
Android. For these reasons most developers choose a portfolio method
for their app development: Developing multiple apps with hopes that at
least one will payoff and offset the apps that weren’t as successful.
AVERAGE NUMBER
OF APPS PER
DEVELOPER
AVERAGE
REVENUE
PER
APP
http://www.fastcompany.com/1792313/striking-it-rich-in-the-app-store-for-developers-its-more-casino-than-gold-mine
http://techcrunch.com/2011/12/18/app-ocalypse/
P:22
2,345
Both
95,870
iOS
Developers
33,430
Android
Developers
APP DEVELOPMENT: PLATFORM
Another question that many app developers have to question is what
platform to develop their apps for. Most developers, because they are
smaller decide to pick one or the other. A few develop for both platforms,
and even then it is not all of their apps.
http://blog.appstorehq.com/post/760323632/ios-vs-android-over-1-000-developers-including-some
http://mashable.com/2010/07/02/ios-android-developer-stats/
iOS
ANDROID
12
136
22
4
27
CAPCOM MOBILE
LargeDeveloper
MobilePlatformDevelopment
GAMELOFT AMAZON
P:23
COST PER LOYAL USER
The average cost to acquire a loyal user through proactive marketing has
fluctuated from a little over a dollar to just under two dollars. A user is
considered loyal if they open an app three times or more.
http://www.fiksu.com/resources/fiksu-indexes#competitive-index
$
1.30
$
1.31
$
1.14
$
1.81
$
1.43
$
1.47
$
1.64
$
1.54
$
0.00
$
0.50
$
1.00
$
1.50
$
2.00
MAY 2012FEB 2012JAN 2012DEC 2011NOV 2011OCT 2011SEP 2011AUG 2011
P:24
WINDOWS APPS
The Windows phone 7 platform and its app store are still relatively new
to the marketplace and has had relatively good growth (it launched with
9,000 apps and today has around 9,000, however it hasn’t reached
anywhere near the heights of the iOS or Android app stores, and most of
the available apps are free, generating little revenue for developers.
http://windowsteamblog.com/windows_phone/b/wpdev/archive/2011/03/30/a-year-later-the-windows-phone-7-numbers
http://wp7applist.com/en-US/stats/
Free
Paid
90,000
81,000
72,000
63,000
54,000
45,000
36,000
27,000
18,000
9,000
0
Trial
Oct Nov Mar Apr MayFebJanDec
WINDOWS
PHONES
SHIPPED
AVAILABLEAPPS
MONTH
P:25

Apps White Papers

  • 1.
    WHAT ARE APPS? Appsare small computer programs built specifically for mobile devices. There are apps for almost any situation available and can cost anywhere from free to $100 or more, however most cost a dollar or two. Most apps are downloaded from the Apple App store or Android Play Marketplace. Apps functions generally can fall into one of 3 categories: Content Creation, Content Consumption and Games, with some overlap. APPS.Last Updated: 7/23/2012
  • 2.
    P:2 TABLE OF CONTENTS INTRODUCTIONTO APPS 4 — How people are using their phone 5 — App downloader demographics 6 — Operating system app preferences KINDS OF APPS 8 — App categories 9 — App categories popularity 10 — Most populous app categories 11 — Use of apps after first download by category 12 — Engagement with apps over time by category 13 — Growth in app downloads by operating system 14 — Increase in available apps by operating system store APPS AND PRICE 16 — The price of apps 17 — Free apps v. purchased apps 18 — App usage over time paid v. free 19 — Downloads by cost and category 20 — App engagement paid v. free OTHER STATS 22 — App development: a gamble 23 — App development: platform 24 — Cost per loyal user 25 — Windows apps
  • 3.
    INTRO TO APPS P:3 SOME BASIC INFORMATIONABOUT APPLICATIONS FOR MOBILE DEVICES.
  • 4.
    HOW PEOPLE USETHEIR PHONES Towards the end of 2011, Nielsen performed a survey of smartphone owners to how they actually used their phones. The results showed that 53% of phone time is spent using Apps. 1% Camera 2% Music/Video 4% Maps/Location 5% Email/IM 5% Social Networking 6% Phone 10% Browser 14% Texting 53% Apps P:4
  • 5.
    GENDER APP DOWNLOADER DEMOGRAPHICS 57% MALE 43% FEMALE 41% <$50,000 37% $75,000 15% $50,000- $74,999 INCOME 47% 18-29 39% 30-49 14% 50+ AGE 25% HIGH SCHOOL GRAD 38% COLLEGE GRAD 29% SOME COLLEGE 8%<HIGHSCHOOL EDUCATION http://blog.nielsen.com/nielsenwire/consumer/consumers-ok-with-ads-if-the-apps-are-free/ http://www.slideshare.net/PewInternet/the-state-ofmobileamericanfais P:5
  • 6.
    OPERATING SYSTEM APPPREFERENCE Mobile users have somewhere between 10 and 300 apps on their devices. The average Android device user has about 22 apps on their devices (in addition to the pre loaded ones) while Android users specifically have an average of 33 apps on theirs devices. ALL PHONES AVERAGE ANDROID iOS http://mobithinking.com/mobile-marketing-tools/latest-mobile-stats#mobile-app-stores http://blog.nielsen.com/nielsenwire/mediauniverse/ P:6
  • 7.
    KINDS OF APPS P:7 INFORMATION ABOUT THEDIFFERENT CATEGORIES OF APPS AND USERS’ PREFERENCES FOR DIFFERENT KINDS OF APPS.
  • 8.
    BOOKS EDUCATION GAMESENTERTAINMENT SOCIAL NETWORKING PHOTOS & VIDEOS MUSIC SPORTS NEWS UTILITIES BUSINESS & FINANCE LIFESTYLE REFERENCE TRAVEL PRODUCTIVITY HEALTH & FITNESS APP CATEGORIES Apps are organized into between 16-20 apps based on the operating system (Apple, Android or Windows). http://blog.flurry.com/?Tag=Usage%20Statistics P:8
  • 9.
    BOOKS 23% of user downloads EDUCATION 18% ofuser downloads GAMES 68% of user downloads ENTERTAINMENT 31% of user downloads SOCIAL NETWORKING 45% of user downloads PHOTOS & VIDEOS 25% of user downloads MUSIC 45% of user downloads SPORTS 31% of user downloads NEWS 33% of user downloads UTILITIES 16% of user downloads BUSINESS & FINANCE 30% of user downloads LIFESTYLE 23% of user downloads REFERENCE 16% of user downloads TRAVEL 15% of user downloads PRODUCTIVITY 31% of user downloads HEALTH & FITNESS 25% of user downloads APP CATEGORIES POPULARITY Some app categories are more popular than others. Games are the most popular app category followed by Social Networking and Music apps. Travel, Reference, Utilities and Education have the lowest percentage of downloaders. http://androinica.com/2010/09/the-average-android-user-has-25-apps-and-loves-games-android-market-has-80000-apps/ http://blog.flurry.com/?Tag=Usage%20Statistics P:9
  • 10.
    1 0 0% 80% 6 0% 4 0% 2 0% 0% 2008 2009 2010 2012 Other 44% 43%44% 51% 14%17% 14% 10% 8% 8% 7% 3% 11%11% 13% 24% 8% 15%14%17% 7%7%5% 4% Books Education Entertainment Games Lifestyle MOST POPULOUS APP CATEGORIES The 5 most popular app categories in terms of apps in existence are Books, Education, Entertainment, Games and Lifestyle which collectively make up 56% of apps available in app stores. The other 13 or so app categories variously make up the remaining 44% of apps. http://tech.fortune.cnn.com/2011/05/24/apples-itunes-store-500000-ios-apps-and-counting/ P:10
  • 11.
    USE OF APPSAFTER FIRST DOWNLOAD Sports seems better at retaining users over the short term; entertainment is better at retaining users over the long term. Games have the highest initial usage, but then drops off precipitously. 35% 30% 25% 20% 15% 10% 5% 0% 1 11 21 31 DAYS AFTER FIRST DOWNLOAD 41 51 61 71 81 91 101 %USERSRETURNINGAFTERFIRSTDOWNLOAD http://www.slideshare.net/pinchmedia/iphone-appstore-secrets-pinch-media?type=presentation LIFESTYLE ENTERTAINMENT SPORTS GAMES UTILITIES P:11
  • 12.
    LIFESTYLE ENTERTAINMENT SPORTS GAMES UTILITIES 10 8 6 4 2 0 0 10 2030 40 50 60 ENGAGEMENT WITH APPS OVER TIME Games have the highest engagement rate over time as counted by the amount of time spent using the app. Lifestyle apps are some of the only apps that exhibit growth (even if it’s a little bit) over time. http://www.slideshare.net/pinchmedia/iphone-appstore-secrets-pinch-media?type=presentation DAYS SINCE FIRST USED TIMESPENT(MINUTES) P:12
  • 13.
    YEARS DOWNLOADSINBILLIONS GROWTH IN APPDOWNLOADS It is predicted in August 2012 that Android app downloads will overtake iOS app downloads. This is a combination in the less restrictive Android app store requirements resulting in more Android apps as well as the increased dissemination of Android devices. 50 100 150 2009 2010 2011 2012 2013 2014 iOS ANDROID http://venturebeat.com/2011/10/11/whos-counting-mobile-app-data-shows-how-android-app-downloads-are-overtaking-the-iphone/ http://venturebeat.com/2011/10/11/whos-counting-mobile-app-data-shows-how-android-app-downloads-are-overtaking-the-iphone/ P:13
  • 14.
    INCREASE IN AVAILABLEAPPS Apple had a commanding lead in the number of apps in their apps store, but due to the increase in ease of admission to the Android app store, Android apps are poised to overtake available Apple apps in August. http://venturebeat.com/2011/10/11/whos-counting-mobile-app-data-shows-how-android-app-downloads-are-overtaking-the-iphone/ iOS ANDROID 2010 800,000 600,000 400,000 200,000 2011 2012 2013 YEARS #OFAVAILABLEAPPSINAPPSTORE P:14
  • 15.
    APPS AND PRICE P:15 DATA ABOUT HOWPRICE AFFECTS APP DOWNLOAD AND ENGAGEMENT RATES.
  • 16.
    F R EE $ . 9 9 $ 1 . 9 9 $ 2 . 9 9 - $ 4 . 9 9 * $5.99+ ** 36% 29% 13% 13% 9% THE PRICE OF APPS Apps in the Apple app store have prices that range anywhere from free up to $15 and more. 37% of all apps are free, while an additional 42% of apps are $1.99 or less. The average price for a paid app is $3.64. http://tech.fortune.cnn.com/2011/05/24/apples-itunes-store-500000-ios-apps-and-counting/ http://www.tecca.com/news/2011/04/28/android-free-apps/ P:16
  • 17.
    FREE APPS V.PURCHASED Many mobile device owners are weary of paying for apps. Thus there has been a trend towards a drop in the average app price as well as an increase in app “Freemium” business models. The average price cut increases demand by 130% while the average price increase drops demand by 25%. In addition there is a higher willingness to pay for apps for iOS users versus Android users. http://www.slideshare.net/pinchmedia/iphone-appstore-secrets-pinch-media?type=presentation http://mashable.com/2009/08/27/cha-ching-iphone-users/ http://news.cnet.com/8301-13579_3-57349631-37/iphone-users-downloading-more-than-5-million-free-apps-a-day/ Android users purchase 1 of every 8 downloaded apps iOS users purchase 3 of every 10 downloaded apps P:17
  • 18.
    APP USAGE OVERTIME PAID V. FREE Users stop using the average application quickly, the long term audiences are generally 1% of total downloads. Paid applications generally retain their users longer and at higher rates initially, than free applications, although the drop-off is still steep. 35% 30% 25% 20% 15% 10% 5% 0% 1 11 21 31 DAYS AFTER FIRST DOWNLOAD PAID APPS FREE APPS 41 51 61 71 81 91 101 %USERSRETURNINGAFTERFIRSTDOWNLOAD http://www.slideshare.net/pinchmedia/iphone-appstore-secrets-pinch-media?type=presentation http://www.phonedog.com/2011/02/01/how-many-times-are-downloaded-applications-actually-being-used/ P:18
  • 19.
    Books Restaurants/ Dining Coupons/ Discounts Games Maps/ Navigation MusicSocial Networking News Entertainment Sports Banking/ Finance MagazinesRecommendations/ Reviews DOWNLOADS BY COST & CATEGORY A study of smartphone and tablet users over a 30 day period to discover what apps users download and whether they were free or paid. Results showed, most users will download a combination of free and paid apps in any given category. Free & Paid Apps Free Apps Only Paid Apps Only http://blog.nielsen.com/nielsenwire/consumer/consumers-ok-with-ads-if-the-apps-are-free/ 50%44% 45% 45% 50% 42% 49% 41% 41% 49% 40% 11% 18% 16% 2% 33% 33% 51% 48% 48% 47% 35% 49% 2% 4% 9% 9% 49% 49% 41% 9% 12% 10% 10% 44% 45% 45% 36% 14% P:19
  • 20.
    APP ENGAGEMENT PAIDV. FREE Paid apps have higher engagement rates over time versus free apps, although free and paid engagement rates fall and equal out as the age of the app download increases. http://www.slideshare.net/pinchmedia/iphone-appstore-secrets-pinch-media?type=presentation TIMESPENT(MINUTES) DAYS SINCE FIRST USED 9 8 7 6 5 4 0 10 20 30 40 50 60 PAID APPS FREE APPS P:20
  • 21.
    OTHER STATS P:21 FURTHER INFORMATION ABOUTAPP DEVELOPMENT STRATEGIES, THE WINDOWS PHONE APP ENVIRONMENT AND MARKETING COSTS.
  • 22.
    APP DEVELOPMENT: AGAMBLE There have been over 10 billion apps sold in app stores today with as much as $250 million being spent in app stores every month. However, these huge numbers have attracted another growing number: the number of app publishers and the number of apps they are creating, namely 500,00 apps available for iOS and another 300,000 available for Android. For these reasons most developers choose a portfolio method for their app development: Developing multiple apps with hopes that at least one will payoff and offset the apps that weren’t as successful. AVERAGE NUMBER OF APPS PER DEVELOPER AVERAGE REVENUE PER APP http://www.fastcompany.com/1792313/striking-it-rich-in-the-app-store-for-developers-its-more-casino-than-gold-mine http://techcrunch.com/2011/12/18/app-ocalypse/ P:22
  • 23.
    2,345 Both 95,870 iOS Developers 33,430 Android Developers APP DEVELOPMENT: PLATFORM Anotherquestion that many app developers have to question is what platform to develop their apps for. Most developers, because they are smaller decide to pick one or the other. A few develop for both platforms, and even then it is not all of their apps. http://blog.appstorehq.com/post/760323632/ios-vs-android-over-1-000-developers-including-some http://mashable.com/2010/07/02/ios-android-developer-stats/ iOS ANDROID 12 136 22 4 27 CAPCOM MOBILE LargeDeveloper MobilePlatformDevelopment GAMELOFT AMAZON P:23
  • 24.
    COST PER LOYALUSER The average cost to acquire a loyal user through proactive marketing has fluctuated from a little over a dollar to just under two dollars. A user is considered loyal if they open an app three times or more. http://www.fiksu.com/resources/fiksu-indexes#competitive-index $ 1.30 $ 1.31 $ 1.14 $ 1.81 $ 1.43 $ 1.47 $ 1.64 $ 1.54 $ 0.00 $ 0.50 $ 1.00 $ 1.50 $ 2.00 MAY 2012FEB 2012JAN 2012DEC 2011NOV 2011OCT 2011SEP 2011AUG 2011 P:24
  • 25.
    WINDOWS APPS The Windowsphone 7 platform and its app store are still relatively new to the marketplace and has had relatively good growth (it launched with 9,000 apps and today has around 9,000, however it hasn’t reached anywhere near the heights of the iOS or Android app stores, and most of the available apps are free, generating little revenue for developers. http://windowsteamblog.com/windows_phone/b/wpdev/archive/2011/03/30/a-year-later-the-windows-phone-7-numbers http://wp7applist.com/en-US/stats/ Free Paid 90,000 81,000 72,000 63,000 54,000 45,000 36,000 27,000 18,000 9,000 0 Trial Oct Nov Mar Apr MayFebJanDec WINDOWS PHONES SHIPPED AVAILABLEAPPS MONTH P:25