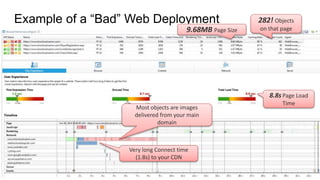
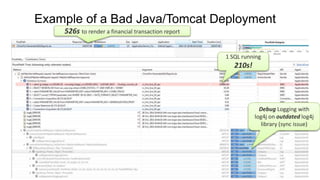
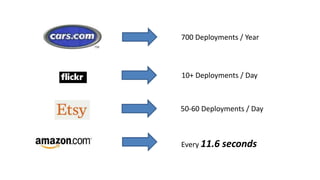
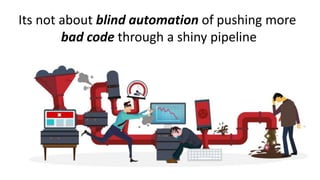
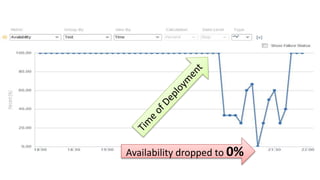
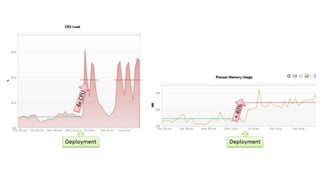
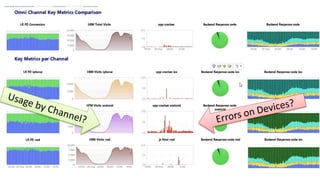
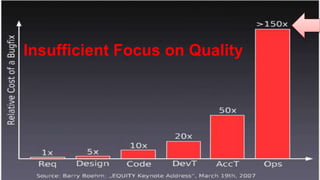
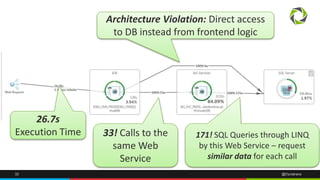
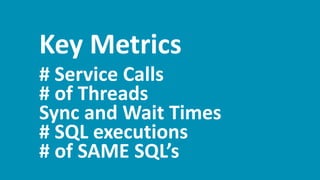
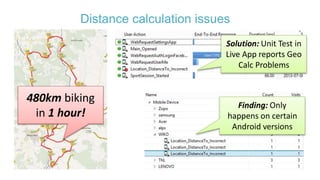
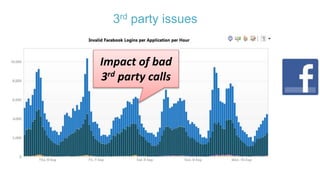
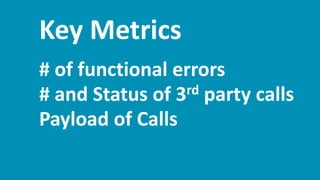
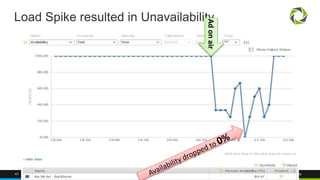
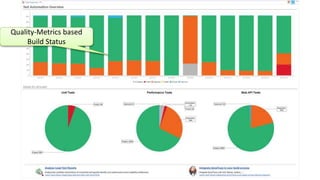
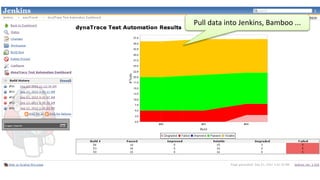
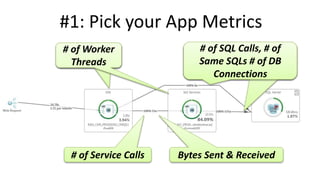
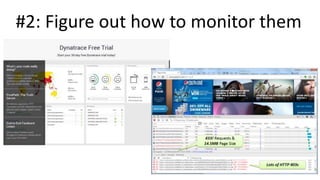
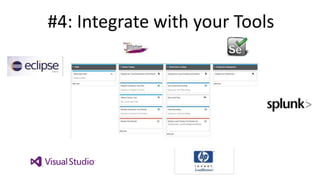
1 @Dynatrace
Application Quality Metrics for your Pipeline
Andreas (Andi) Grabner - @grabnerandi
Shift-Left Quality
Example of a “Bad” Web Deployment 282! Objects
on that page9.68MB Page Size
8.8s Page Load
Time
Most objects are images
delivered from your main
domain
Very long Connect time
(1.8s) to your CDN
Example of a Bad Java/Tomcat Deployment
526s to render a financial transaction report
1 SQL running
210s!
Debug Logging with
log4j on outdated log4j
library (sync issue)
700 Deployments / Year
50-60 Deployments / Day
10+ Deployments / Day
Every 11.6 seconds
Challenges
Fail
Faster!?
Its not about blind automation of pushing more
bad code through a shiny pipeline
Metrics
based
Decision
Availability dropped to 0%
Technical Debt!
80%
$60B
Insufficient Focus on Quality
The “War Room”
Facebook – December 2012
20%
80%
I
learning from
others
4 use cases
 WHY did it happen?
 HOW to avoid it!
 METRICS to guide you.
26 @Dynatrace
27 @Dynatrace
#1
don't push
without a plan
28 @Dynatrace
Mobile Landing Page of Super Bowl Ad
434 Resources in total on that page:
230 JPEGs, 75 PNGs, 50 GIFs, …
Total size of ~
20MB
29 @Dynatrace
Key Metrics
# Resources
Size of Resources
Page Size
30 @Dynatrace
31 @Dynatrace
#2
There is no easy
"Migration" to
Micro(Services)
32 @Dynatrace
26.7s
Execution Time 33! Calls to the
same Web
Service
171! SQL Queries through LINQ
by this Web Service – request
similar data for each call
Architecture Violation: Direct access
to DB instead from frontend logic
33 @Dynatrace
Key Metrics
# Service Calls
# of Threads
Sync and Wait Times
# SQL executions
# of SAME SQL’s
34 @Dynatrace
35 @Dynatrace
#3
don't ASSUME you
know the environment
Distance calculation issues
480km biking
in 1 hour!
Solution: Unit Test in
Live App reports Geo
Calc Problems
Finding: Only
happens on certain
Android versions
3rd party issues
Impact of bad
3rd party calls
38 @Dynatrace
Key Metrics
# of functional errors
# and Status of 3rd party calls
Payload of Calls
40 @Dynatrace
#4
Thinking Big?
Then Start Small!
41 @Dynatrace
Load Spike resulted in Unavailability
Adonair
42 @Dynatrace
Alternative: “GoDaddy goes DevOps”
1h before
SuperBowl KickOff
1h after
Game ended
43 @Dynatrace
Key Metrics
# Domains
Total Size of Content
44 @Dynatrace
What have we
learned so far?
45 @Dynatrace
1. # Resources
2. Size of Resources
3. Page Size
4. # Functional Errors
5. 3rd Party calls
6. # SQL Executions
7. # of SAME SQLs
Metric
Based
Decisions
Are Cool
We want to get from here …
To here!
Use these application metrics as additional
Quality Gates
Extend your Continuous Integration
12 0 120ms
3 1 68ms
Build 20 testPurchase OK
testSearch OK
Build 17 testPurchase OK
testSearch OK
Build 18 testPurchase FAILED
testSearch OK
Build 19 testPurchase OK
testSearch OK
Build # Test Case Status # SQL # Excep CPU
12 0 120ms
3 1 68ms
12 5 60ms
3 1 68ms
75 0 230ms
3 1 68ms
Test & Monitoring Framework Results Architectural Data
We identified a regresesion
Problem solved
Exceptions probably reason for
failed tests
Problem fixed but now we have an
architectural regression
Problem fixed but now we have an
architectural regressionNow we have the functional and
architectural confidence
Let’s look behind the scenes
#1: Analyzing each Test
#2: Metrics for each Test
#3: Detecting Regression
based on Measure
Quality-Metrics based
Build Status
Pull data into Jenkins, Bamboo ...
Recap!
#1: Pick your App Metrics
# of Service Calls Bytes Sent & Received
# of Worker
Threads
# of Worker
Threads
# of SQL Calls, # of
Same SQLs # of DB
Connections
# of SQL Calls, # of
Same SQLs # of DB
Connections
#2: Figure out how to monitor them
#3: Automate it into your Pipeline
#4: Integrate with your Tools
Draw better Unicorns 
60 @Dynatrace
Questions and/or Demo
Slides: slideshare.net/grabnerandi
Get Tools: bit.ly/dttrial
YouTube Tutorials: bit.ly/dttutorials
Contact Me: agrabner@dynatrace.com
Follow Me: @grabnerandi
Read More: blog.dynatrace.com
61 @Dynatrace
Andreas Grabner
Dynatrace Developer Advocate
@grabnerandi
http://blog.dynatrace.com

Application Quality Gates in Continuous Delivery: Deliver Better Software Faster!

Editor's Notes

  • #2 Get Dynatrace Free Trial at http://bit.ly/dttrial Video Tutorials on YouTube Channel: http://bit.ly/dttutorials Online Webinars every other week: http://bit.ly/onlineperfclinic Share Your PurePath with me: http://bit.ly/sharepurepath
  • #3 This is a deployment that shouldnt make it to production. Two metrics from WPO (Web Performance Optimization) that should have been seen in dev & test before releasing this to prod
  • #4 Another deployment that didnt go that well. Bad SQL when specifying a too long timerange for that report, DEBUG logging turned on and an outdated buggy log4j library!
  • #5 Who can we avoid this? Lets just do it like the „Unicorns“ in that space – such as Etsy, Google or Facebook?
  • #6 Several companies changed their way they develop and deploy software over the years. Here are some examples (numbers from 2011 – 2014) Cars: from 2 deployments to 700 Flicks: 10+ per Day Etsy: lets every new employee on their first day of employment make a code change and push it through the pipeline in production: THAT’S the right approach towards required culture change Amazon: every 11.6s Remember: these are very small changes – which is also a key goal of continuous delivery. The smaller the change the easier it is to deploy, the less risk it has, the easier it is to test and the easier is it to take it out in case it has a problem.
  • #7 The problem is though – when you blindly copy what you read you may end up with a very ugly copy of a Unicorn. Its not about copying everything or thinking that you have to release as frequently as the Unicorns. It is about changing and adapting a lot of their best practices but doing it in a way that makes sense to you. For you it might be enough to release once a month or once week.
  • #9 So – our goal is to deploy new features faster to get it in front of our paying end users or employees
  • #10 For many companies that tried this it may also meant that they fail faster
  • #11 Your app that you are responsible for crashes …
  • #12 The Fifa World Cup App one week before the worldcup. Crashed for the majority of Android users when refreshing the news section of the app caused by a memory leak introduced by an outdated library they used
  • #14 I love metrics – and I think we should make decisions on deployments based on key metrics. But also monitor deployments in production to learn whether the deployment was really good
  • #15 Synthetic Availability Monitoring -> Clearly something went wrong
  • #16 Even if the deployment seemed good because all features work and response time is the same as before. If your resource consumption goes up like this the deployment is NOT GOOD. As you are now paying a lot of money for that extra compute power
  • #17 Got a marketing campaign? If you roll it out do it smart: Start with a small number – monitor user behavior – fix errors if there are any before rolling out the rest of the campaign
  • #18 A lot of people dont look at these metrics and just add new code on an ever growing big pile of technical debt
  • #19 Based on a recent study: 80% of Dev Team overall is spent in Bugfixing instead of building new cool features $60B annual costs of bad software instead of investing it in new cool features to spearhead competition
  • #20 Yes – we are focusing on quality TOO LATE
  • #21 When its too late we end up here
  • #22 We need to leave that status quo. And there are two numbers that tell us that it is not as hard to do as it may seem
  • #23 Based on my experience 80% of the problems are only caused by 20% problem patterns. And focusing on 20% of potential problems that take away 80% of the pain is a very good starting point
  • #24 Sounds super nice on paper – so – how do we get there?
  • #29 Marketing had a great idea: 20x20 grid showing the last 400 selfie uploads. Implementation was pushed through quick resulting in an overloaded page that causes both performance and usability issue on the mobile device as well as on the servers and CDNs
  • #33 This was a monolithic app for searching sports club websites. The executed sample search brought 33 sports club. Before this app was „migrated“ to Microservices everything was in a single monolith taking about 1s to execute. After the „migration“ to (micro)services the same call takes 26.7s including 33 calls to the new microservice and 171 roundtrips to the database
  • #37 Pushing the unit test to the mobile device to test for GPS specific calcuation issues. Then identifying which devices have a GPS calculation bug!
  • #38 Monitoring impact of 3rd party APIs such as Facebook
  • #42 Overloaded Kia website brings it down during superbowl
  • #43 Kia is doing something different: they have a special „bare minimum static optimized“ website for the spike period -> thats smart
  • #46 So – we have seen a lot of metrics. The goal now is that you start with one metric. Pick a single metric and take it back to your engineering team (Dev, Test, Ops and Business). Sit down and agree on what this metric means for everyone, how to measure it and also how to report it Also remember that for most of these use cases discussed and metrics derived from it we only need a single user test. Even though we can identify performance, scalability and architectural issues – in most cases we don’t need a load test. Single user tests or unit tests are good enough
  • #50 Here is how we do this. In addition to looking at functional and unit test results which only tell us how functionality is we also look into these backed metrics for every test. With that we can immediately identify whether code changes result in any performance, scalability or architectural regressions. Knowing this allows us to stop that build early
  • #51 This is how this can look like in a real life example. Analyzing Key Performance, Scalability and Architectural Metrics for every single test
  • #59 So – our goal is to deploy new features faster to get it in front of our paying end users or employees