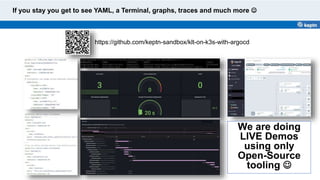
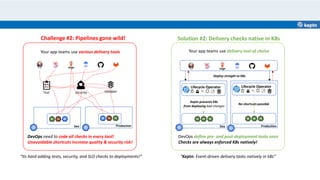
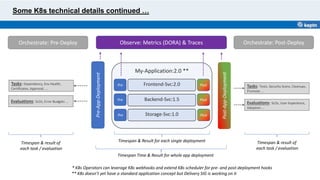
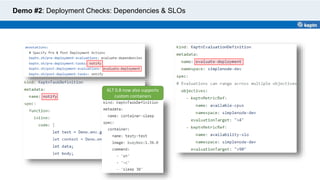
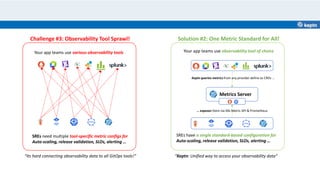
Download to read offline

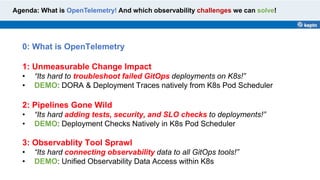
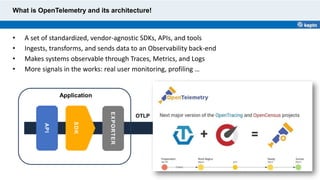
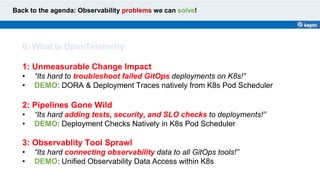
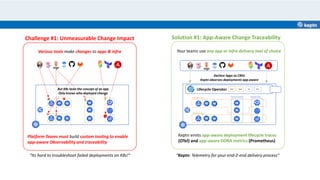
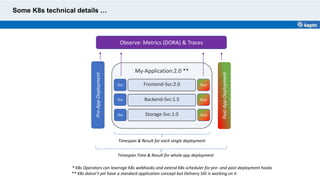
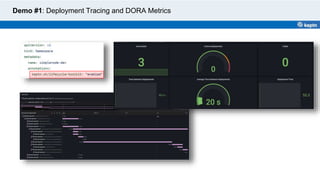


The document discusses the use of OpenTelemetry for improving GitOps workflows in Kubernetes, addressing challenges like unmeasurable change impact, chaotic pipelines, and observability tool sprawl. It highlights how Keptn can provide app-aware change traceability, enforce delivery checks natively in Kubernetes, and unify observability data access. The goal is to enhance the deployment process through event-driven delivery tasks and standardized observability metrics.