Download as PDF, PPTX


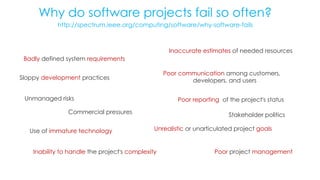


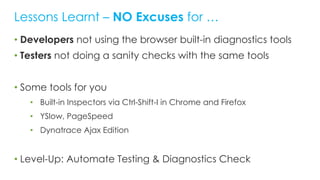


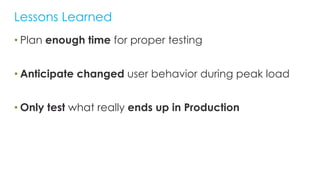


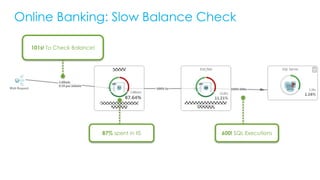
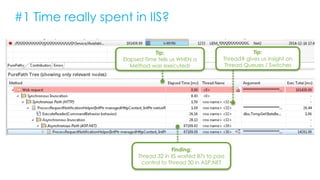
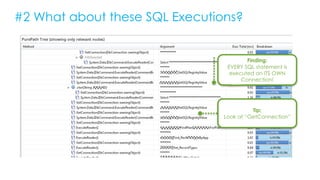


The document discusses various metrics and practices to improve software application reliability, highlighting common reasons for project failures such as unrealistic goals and poor communication. It emphasizes the importance of proper testing, resource management, and utilizing performance diagnostics to avoid issues like slow load times and inefficient database queries. Additionally, it suggests applying the 80/20 rule towards optimizing frontend and backend components in software development.