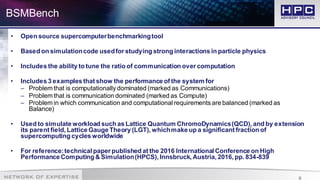
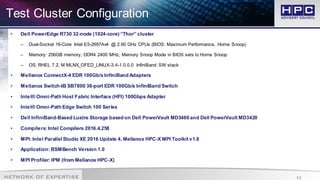
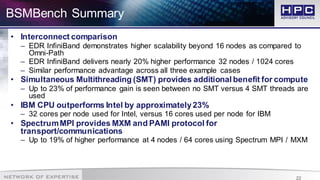
Best Practices: Application Profiling at
the HPCAC High Performance Center
Pak Lui
2
• Nekbone
• NEMO
• NWChem
• Octopus
• OpenAtom
• OpenFOAM
• OpenMX
• OptiStruct
• PAM-CRASH / VPS
• PARATEC
• Pretty Fast Analysis
• PFLOTRAN
• Quantum ESPRESSO
• RADIOSS
• HPCC
• HPCG
• HYCOM
• ICON
• Lattice QCD
• LAMMPS
• LS-DYNA
• miniFE
• MILC
• MSC Nastran
• MR Bayes
• MM5
• MPQC
• NAMD
157 Applications Best Practices Published
• Abaqus
• ABySS
• AcuSolve
• Amber
• AMG
• AMR
• ANSYS CFX
• ANSYS Fluent
• ANSYS Mechanical
• BQCD
• BSMBench
• CAM-SE
• CCSM 4.0
• CESM
• COSMO
• CP2K
• CPMD
• Dacapo
• Desmond
• DL-POLY
• Eclipse
• FLOW-3D
• GADGET-2
• Graph500
• GROMACS
• Himeno
• HIT3D
• HOOMD-blue
For more information, visit: http://www.hpcadvisorycouncil.com/best_practices.php
• RFD tNavigator
• SNAP
• SPECFEM3D
• STAR-CCM+
• STAR-CD
• VASP
• WRF
3
35 Applications Installation Best Practices Published
• Adaptive Mesh Refinement (AMR)
• Amber (for GPU/CUDA)
• Amber (for CPU)
• ANSYS Fluent 15.0.7
• ANSYS Fluent 17.1
• BQCD
• CASTEP 16.1
• CESM
• CP2K
• CPMD
• DL-POLY 4
• ESI PAM-CRASH 2015.1
• ESI PAM-CRASH / VPS 2013.1
• GADGET-2
• GROMACS 5.1.2
• GROMACS 4.5.4
• GROMACS 5.0.4 (GPU/CUDA)
• Himeno
• HOOMD Blue
• LAMMPS
• LAMMPS-KOKKOS
• LS-DYNA
• MrBayes
• NAMD
For more information, visit: http://www.hpcadvisorycouncil.com/subgroups_hpc_works.php
• NEMO
• NWChem
• Octopus
• OpenFOAM
• OpenMX
• PyFR
• Quantum ESPRESSO 4.1.2
• Quantum ESPRESSO 5.1.1
• Quantum ESPRESSO 5.3.0
• WRF 3.2.1
• WRF 3.8
4
HPC Advisory Council HPC Center
Dell™ Pow erEdge™
R730 GPU
36-node cluster
HPE Cluster Platform
3000SL
16-node cluster
HPE ProLiant SL230s
Gen8
4-node cluster
Dell™ Pow erEdge™ M610
38-node cluster
Dell™ Pow erEdge™ C6100
4-node cluster
IBM POWER8
8-node cluster
Dell™ Pow erEdge™
R720xd/R720 32-node GPU
cluster
Dell Pow erVault MD3420
Dell Pow erVault MD3460
InfiniBand
Storage
(Lustre)
HPE Apollo 6000
10-node cluster
4-node GPU cluster 4-node GPU cluster
Dell™ Pow erEdge™
R815 11-node cluster
Dell™ Pow erEdge™
C6145 6-node cluster
5
Agenda
• Overview of HPC Applications Performance
• Way to Inspect, Profile, Optimize HPC Applications
– CPU, memory, file I/O, network
• System Configurationsand Tuning
• Case Studies, PerformanceComparisons, Optimizations and Highlights
• Conclusions
6
HPC Application Performance Overview
• To achieve scalability performance on HPC applications
– Involves understandingof the workload by performing profile analysis
• Tune for the most time spent (either CPU, Network, IO, etc)
– Underlying implicit requirement: Each node to perform similarly
• Run CPU/memory /network tests or cluster checker to identify bad node(s)
– Comparing behaviors of using different HW components
• Which pinpoint bottlenecks in different areas of the HPC cluster
• A selection of HPC applications will be shown
– To demonstrate method of profiling and analysis
– To determine the bottleneck in SW/HW
– To determine the effectivenessof tuning to improve on performance
7
Ways To Inspect and Profile Applications
• Computation (CPU/Accelerators)
– Tools: gprof, top, htop, perf top, pstack, Visual Profiler, etc
– Tests and Benchmarks: HPL, STREAM
• File I/O
– Bandwidth and Block Size: iostat, collectl, darshan, etc
– Characterization Tools and Benchmarks: iozone, ior, etc
• Network Interconnect and MPI communications
– Tools and Profilers: perfquery, MPI profilers (IPM, TAU, etc)
– Characterization Tools and Benchmarks:
– Latency and Bandwidth: OSU benchmarks, IMB
8
Note
• The followingresearch was performed under the HPC Advisory Council activities
– Compute resource - HPC Advisory Council Cluster Center
• The followingwas done to provide best practices
– BSMBench performance overview
– UnderstandingBSMBench communication patterns
– Ways to increase BSMBench productivity
• For more info please refer to
– https://gitlab.com/edbennett/BSMBench
9
BSMBench
• Open source supercomputerbenchmarkingtool
• Based on simulationcode usedfor studying strong interactions in particle physics
• Includes the ability to tune the ratio of communication over computation
• Includes 3 examples that show the performance of the system for
– Problem that is computationally dominated (marked as Communications)
– Problem that is communication dominated (marked as Compute)
– Problem in which communication and computational requirements are balanced (marked as
Balance)
• Used to simulate workload such as Lattice Quantum ChromoDynamics(QCD), and by extension
its parent field, Lattice Gauge Theory (LGT), whichmake up a significant fraction of
supercomputing cycles worldwide
• For reference:technical paper published at the 2016 International Conference on High
Performance Computing & Simulation(HPCS), Innsbruck, Austria, 2016, pp. 834-839
10
Objectives
• The presented research was done to provide best practices
– BSMBench performance benchmarking
• MPI Library performance comparison
• Interconnect performance comparison
• Compilers comparison
• Optimization tuning
• The presented results will demonstrate
– The scalability of the compute environment/application
– Considerations for higher productivity and efficiency
11
Test Cluster Configuration
• Dell PowerEdge R730 32-node (1024-core) “Thor” cluster
– Dual-Socket 16-Core Intel E5-2697Av4 @ 2.60 GHz CPUs (BIOS: Maximum Performance, Home Snoop)
– Memory: 256GB memory, DDR4 2400 MHz, Memory Snoop Mode in BIOS sets to Home Snoop
– OS: RHEL 7.2, M MLNX_OFED_LINUX-3.4-1.0.0.0 InfiniBand SW stack
• Mellanox ConnectX-4 EDR 100Gb/s InfiniBand Adapters
• Mellanox Switch-IB SB7800 36-port EDR 100Gb/s InfiniBand Switch
• Intel® Omni-Path Host Fabric Interface (HFI) 100Gbps Adapter
• Intel® Omni-Path Edge Switch 100 Series
• Dell InfiniBand-Based Lustre Storage based on Dell PowerVault MD3460 and Dell PowerVault MD3420
• Compilers: Intel Compilers 2016.4.258
• MPI: Intel ParallelStudio XE 2016 Update 4, Mellanox HPC-X MPI Toolkit v1.8
• Application: BSMBench Version 1.0
• MPI Profiler: IPM (from Mellanox HPC-X)
12
BSMBench Profiling – % of MPI Calls
• Major MPI calls (as % of wall time):
– Balance: MPI_Barrier (26%), MPI_Allreduce (6%), MPI_Waitall (5%), MPI_Isend (4%)
– Communications: MPI_Barrier (14%), MPI_Allreduce (5%), MPI_Waitall (5%), MPI_Isend
(2%)
– Compute: MPI_Barrier (14%), MPI_Allreduce (5%), MPI_Waitall (5%), MPI_Isend (1%)
ComputeBalance
32 Nodes / 1024 Processes
Communications
13
BSMBench Profiling – MPI Message Size Distribution
• Similar communication pattern seen acrossall 3 examples:
– Balance: MPI_Barrier: 0-byte, 22% wall, MPI_Allreduce: 8-byte, 5% wall
– Communications: MPI_Barrier: 0-byte, 26% wall, MPI_Allreduce: 8-byte, 5% wall
– Compute: MPI_Barrier: 0-byte, 13% wall, MPI_Allreduce: 8-byte, 5% wall
ComputeBalance Communications
32 Nodes / 1024 Processes
14
BSMBench Profiling – Time Spent in MPI
• The different communications across the MPI processes is mostly balance
– Does not appear to be any significant load imbalances in the communication layer
ComputeBalance Communications
32 Nodes / 1024 Processes
15
BSMBench Performance – Interconnects
• EDR InfiniBand delivers better scalability for BSMBench
– Similar performance between EDR InfiniBand and Omni-Path up to 8 nodes
– Close to 20% performance advantage for InfiniBand at 32 nodes
– Similar performance difference across the three differentexamples
32 MPI Processes / NodeHigher is better
20%
16
BSMBench Performance – MPI Libraries
• Comparison between two commercial available MPI libraries
• Intel MPI and HPC-X delivers similar performance
– HPC-X demonstrates 5% advantage at 32 nodes
32 MPI Processes / NodeHigher is better
17
Test Cluster Configuration
• IBM OperPOWER 8-node “Telesto” cluster
• IBM Power System S822LC (8335-GTA)
– IBM: Dual-Socket 10-Core @ 3.491 GHz CPUs, Memory: 256GB memory, DDR3 PC3-14900 MHz
• Wistron OpenPOWER servers
– Wistron: Dual-Socket 8-Core @ 3.867 GHz CPUs. Memory: 224GB memory, DDR3 PC3-14900 MHz
• OS: RHEL 7.2, MLNX_OFED_LINUX-3.4-1.0.0.0 InfiniBand SW stack
• Mellanox ConnectX-4 EDR 100Gb/s InfiniBand Adapters
• Mellanox Switch-IB SB7800 36-port EDR 100Gb/s InfiniBand Switch
• Compilers: GNU compilers 4.8.5, IBM XL Compilers 13.1.3
• MPI: Open MPI 2.0.2, IBM Spectrum MPI 10.1.0.2
• Application: BSMBench Version 1.0
18
BSMBench Performance – SMT
• Simultaneous Multithreading (SMT) allows additional hardware threads for compute
• Additional performance gain is seen with SMT enabled
– Up to 23% of performance gain is seen between no SMT versus 4 SMT threads are used
Higher is better
19
BSMBench Performance – MPI Libraries
• Spectrum MPI with MXM support delivers higher performance
– Spectrum MPI provides MXM and PAMI protocolfor transport/communications
– Up to 19% of higher performance at 4 nodes / 64 cores using Spectrum MPI / MXM
32 MPI Processes / NodeHigher is better
19%
20
BSMBench Performance – CPU Architecture
• IBM architecture demonstrates better performance compared to Intel architecture
– Performance gain on a single node is ~23% for Comms and Balance
– Additional gains are seen when more SMT hardware threads are used
– 32 cores per node used for Intel, versus 16 cores used per node for IBM
Higher is better
21
BSMBench Summary
• Benchmark for BSM Lattice Physics
– Utilizes both compute and network communications
• MPI Profiling
– Most MPI time is spent on MPI collective operations and non-blocking
communications
• Heavy use of MPI collective operations (MPI_Allreduce, MPI_Barrier)
– Similarcommunication patterns seen across all three examples
• Balance: MPI_Barrier: 0-byte, 22% wall, MPI_Allreduce: 8-byte, 5% wall
• Comms: MPI_Barrier: 0-byte, 26% wall, MPI_Allreduce: 8-byte, 5% wall
• Compute: MPI_Barrier: 0-byte, 13% wall, MPI_Allreduce: 8-byte, 5% wall
Fast network communication is important for scalability
22
BSMBench Summary
• Interconnect comparison
– EDR InfiniBand demonstrates higher scalability beyond 16 nodes as compared to
Omni-Path
– EDR InfiniBand delivers nearly 20% higher performance 32 nodes / 1024 cores
– Similar performance advantage across all three example cases
• Simultaneous Multithreading (SMT) provides additional benefit for compute
– Up to 23% of performance gain is seen between no SMT versus 4 SMT threads are
used
• IBM CPU outperforms Intel by approximately23%
– 32 cores per node used for Intel, versus 16 cores used per node for IBM
• SpectrumMPI provides MXM and PAMI protocol for
transport/communications
– Up to 19% of higher performance at 4 nodes / 64 cores using Spectrum MPI / MXM
All trademarks are property of their respective owners. All information is provided “As-Is” without any kind of warranty. The HPC Advisory Council makes no representation to the accuracy and completeness of the information
contained herein. HPC Advisory Council undertakes no duty and assumes no obligation to update or correct any information presented herein
Thank You

Application Profiling at the HPCAC High Performance Center

  • 1.
    Best Practices: ApplicationProfiling at the HPCAC High Performance Center Pak Lui
  • 2.
    2 • Nekbone • NEMO •NWChem • Octopus • OpenAtom • OpenFOAM • OpenMX • OptiStruct • PAM-CRASH / VPS • PARATEC • Pretty Fast Analysis • PFLOTRAN • Quantum ESPRESSO • RADIOSS • HPCC • HPCG • HYCOM • ICON • Lattice QCD • LAMMPS • LS-DYNA • miniFE • MILC • MSC Nastran • MR Bayes • MM5 • MPQC • NAMD 157 Applications Best Practices Published • Abaqus • ABySS • AcuSolve • Amber • AMG • AMR • ANSYS CFX • ANSYS Fluent • ANSYS Mechanical • BQCD • BSMBench • CAM-SE • CCSM 4.0 • CESM • COSMO • CP2K • CPMD • Dacapo • Desmond • DL-POLY • Eclipse • FLOW-3D • GADGET-2 • Graph500 • GROMACS • Himeno • HIT3D • HOOMD-blue For more information, visit: http://www.hpcadvisorycouncil.com/best_practices.php • RFD tNavigator • SNAP • SPECFEM3D • STAR-CCM+ • STAR-CD • VASP • WRF
  • 3.
    3 35 Applications InstallationBest Practices Published • Adaptive Mesh Refinement (AMR) • Amber (for GPU/CUDA) • Amber (for CPU) • ANSYS Fluent 15.0.7 • ANSYS Fluent 17.1 • BQCD • CASTEP 16.1 • CESM • CP2K • CPMD • DL-POLY 4 • ESI PAM-CRASH 2015.1 • ESI PAM-CRASH / VPS 2013.1 • GADGET-2 • GROMACS 5.1.2 • GROMACS 4.5.4 • GROMACS 5.0.4 (GPU/CUDA) • Himeno • HOOMD Blue • LAMMPS • LAMMPS-KOKKOS • LS-DYNA • MrBayes • NAMD For more information, visit: http://www.hpcadvisorycouncil.com/subgroups_hpc_works.php • NEMO • NWChem • Octopus • OpenFOAM • OpenMX • PyFR • Quantum ESPRESSO 4.1.2 • Quantum ESPRESSO 5.1.1 • Quantum ESPRESSO 5.3.0 • WRF 3.2.1 • WRF 3.8
  • 4.
    4 HPC Advisory CouncilHPC Center Dell™ Pow erEdge™ R730 GPU 36-node cluster HPE Cluster Platform 3000SL 16-node cluster HPE ProLiant SL230s Gen8 4-node cluster Dell™ Pow erEdge™ M610 38-node cluster Dell™ Pow erEdge™ C6100 4-node cluster IBM POWER8 8-node cluster Dell™ Pow erEdge™ R720xd/R720 32-node GPU cluster Dell Pow erVault MD3420 Dell Pow erVault MD3460 InfiniBand Storage (Lustre) HPE Apollo 6000 10-node cluster 4-node GPU cluster 4-node GPU cluster Dell™ Pow erEdge™ R815 11-node cluster Dell™ Pow erEdge™ C6145 6-node cluster
  • 5.
    5 Agenda • Overview ofHPC Applications Performance • Way to Inspect, Profile, Optimize HPC Applications – CPU, memory, file I/O, network • System Configurationsand Tuning • Case Studies, PerformanceComparisons, Optimizations and Highlights • Conclusions
  • 6.
    6 HPC Application PerformanceOverview • To achieve scalability performance on HPC applications – Involves understandingof the workload by performing profile analysis • Tune for the most time spent (either CPU, Network, IO, etc) – Underlying implicit requirement: Each node to perform similarly • Run CPU/memory /network tests or cluster checker to identify bad node(s) – Comparing behaviors of using different HW components • Which pinpoint bottlenecks in different areas of the HPC cluster • A selection of HPC applications will be shown – To demonstrate method of profiling and analysis – To determine the bottleneck in SW/HW – To determine the effectivenessof tuning to improve on performance
  • 7.
    7 Ways To Inspectand Profile Applications • Computation (CPU/Accelerators) – Tools: gprof, top, htop, perf top, pstack, Visual Profiler, etc – Tests and Benchmarks: HPL, STREAM • File I/O – Bandwidth and Block Size: iostat, collectl, darshan, etc – Characterization Tools and Benchmarks: iozone, ior, etc • Network Interconnect and MPI communications – Tools and Profilers: perfquery, MPI profilers (IPM, TAU, etc) – Characterization Tools and Benchmarks: – Latency and Bandwidth: OSU benchmarks, IMB
  • 8.
    8 Note • The followingresearchwas performed under the HPC Advisory Council activities – Compute resource - HPC Advisory Council Cluster Center • The followingwas done to provide best practices – BSMBench performance overview – UnderstandingBSMBench communication patterns – Ways to increase BSMBench productivity • For more info please refer to – https://gitlab.com/edbennett/BSMBench
  • 9.
    9 BSMBench • Open sourcesupercomputerbenchmarkingtool • Based on simulationcode usedfor studying strong interactions in particle physics • Includes the ability to tune the ratio of communication over computation • Includes 3 examples that show the performance of the system for – Problem that is computationally dominated (marked as Communications) – Problem that is communication dominated (marked as Compute) – Problem in which communication and computational requirements are balanced (marked as Balance) • Used to simulate workload such as Lattice Quantum ChromoDynamics(QCD), and by extension its parent field, Lattice Gauge Theory (LGT), whichmake up a significant fraction of supercomputing cycles worldwide • For reference:technical paper published at the 2016 International Conference on High Performance Computing & Simulation(HPCS), Innsbruck, Austria, 2016, pp. 834-839
  • 10.
    10 Objectives • The presentedresearch was done to provide best practices – BSMBench performance benchmarking • MPI Library performance comparison • Interconnect performance comparison • Compilers comparison • Optimization tuning • The presented results will demonstrate – The scalability of the compute environment/application – Considerations for higher productivity and efficiency
  • 11.
    11 Test Cluster Configuration •Dell PowerEdge R730 32-node (1024-core) “Thor” cluster – Dual-Socket 16-Core Intel E5-2697Av4 @ 2.60 GHz CPUs (BIOS: Maximum Performance, Home Snoop) – Memory: 256GB memory, DDR4 2400 MHz, Memory Snoop Mode in BIOS sets to Home Snoop – OS: RHEL 7.2, M MLNX_OFED_LINUX-3.4-1.0.0.0 InfiniBand SW stack • Mellanox ConnectX-4 EDR 100Gb/s InfiniBand Adapters • Mellanox Switch-IB SB7800 36-port EDR 100Gb/s InfiniBand Switch • Intel® Omni-Path Host Fabric Interface (HFI) 100Gbps Adapter • Intel® Omni-Path Edge Switch 100 Series • Dell InfiniBand-Based Lustre Storage based on Dell PowerVault MD3460 and Dell PowerVault MD3420 • Compilers: Intel Compilers 2016.4.258 • MPI: Intel ParallelStudio XE 2016 Update 4, Mellanox HPC-X MPI Toolkit v1.8 • Application: BSMBench Version 1.0 • MPI Profiler: IPM (from Mellanox HPC-X)
  • 12.
    12 BSMBench Profiling –% of MPI Calls • Major MPI calls (as % of wall time): – Balance: MPI_Barrier (26%), MPI_Allreduce (6%), MPI_Waitall (5%), MPI_Isend (4%) – Communications: MPI_Barrier (14%), MPI_Allreduce (5%), MPI_Waitall (5%), MPI_Isend (2%) – Compute: MPI_Barrier (14%), MPI_Allreduce (5%), MPI_Waitall (5%), MPI_Isend (1%) ComputeBalance 32 Nodes / 1024 Processes Communications
  • 13.
    13 BSMBench Profiling –MPI Message Size Distribution • Similar communication pattern seen acrossall 3 examples: – Balance: MPI_Barrier: 0-byte, 22% wall, MPI_Allreduce: 8-byte, 5% wall – Communications: MPI_Barrier: 0-byte, 26% wall, MPI_Allreduce: 8-byte, 5% wall – Compute: MPI_Barrier: 0-byte, 13% wall, MPI_Allreduce: 8-byte, 5% wall ComputeBalance Communications 32 Nodes / 1024 Processes
  • 14.
    14 BSMBench Profiling –Time Spent in MPI • The different communications across the MPI processes is mostly balance – Does not appear to be any significant load imbalances in the communication layer ComputeBalance Communications 32 Nodes / 1024 Processes
  • 15.
    15 BSMBench Performance –Interconnects • EDR InfiniBand delivers better scalability for BSMBench – Similar performance between EDR InfiniBand and Omni-Path up to 8 nodes – Close to 20% performance advantage for InfiniBand at 32 nodes – Similar performance difference across the three differentexamples 32 MPI Processes / NodeHigher is better 20%
  • 16.
    16 BSMBench Performance –MPI Libraries • Comparison between two commercial available MPI libraries • Intel MPI and HPC-X delivers similar performance – HPC-X demonstrates 5% advantage at 32 nodes 32 MPI Processes / NodeHigher is better
  • 17.
    17 Test Cluster Configuration •IBM OperPOWER 8-node “Telesto” cluster • IBM Power System S822LC (8335-GTA) – IBM: Dual-Socket 10-Core @ 3.491 GHz CPUs, Memory: 256GB memory, DDR3 PC3-14900 MHz • Wistron OpenPOWER servers – Wistron: Dual-Socket 8-Core @ 3.867 GHz CPUs. Memory: 224GB memory, DDR3 PC3-14900 MHz • OS: RHEL 7.2, MLNX_OFED_LINUX-3.4-1.0.0.0 InfiniBand SW stack • Mellanox ConnectX-4 EDR 100Gb/s InfiniBand Adapters • Mellanox Switch-IB SB7800 36-port EDR 100Gb/s InfiniBand Switch • Compilers: GNU compilers 4.8.5, IBM XL Compilers 13.1.3 • MPI: Open MPI 2.0.2, IBM Spectrum MPI 10.1.0.2 • Application: BSMBench Version 1.0
  • 18.
    18 BSMBench Performance –SMT • Simultaneous Multithreading (SMT) allows additional hardware threads for compute • Additional performance gain is seen with SMT enabled – Up to 23% of performance gain is seen between no SMT versus 4 SMT threads are used Higher is better
  • 19.
    19 BSMBench Performance –MPI Libraries • Spectrum MPI with MXM support delivers higher performance – Spectrum MPI provides MXM and PAMI protocolfor transport/communications – Up to 19% of higher performance at 4 nodes / 64 cores using Spectrum MPI / MXM 32 MPI Processes / NodeHigher is better 19%
  • 20.
    20 BSMBench Performance –CPU Architecture • IBM architecture demonstrates better performance compared to Intel architecture – Performance gain on a single node is ~23% for Comms and Balance – Additional gains are seen when more SMT hardware threads are used – 32 cores per node used for Intel, versus 16 cores used per node for IBM Higher is better
  • 21.
    21 BSMBench Summary • Benchmarkfor BSM Lattice Physics – Utilizes both compute and network communications • MPI Profiling – Most MPI time is spent on MPI collective operations and non-blocking communications • Heavy use of MPI collective operations (MPI_Allreduce, MPI_Barrier) – Similarcommunication patterns seen across all three examples • Balance: MPI_Barrier: 0-byte, 22% wall, MPI_Allreduce: 8-byte, 5% wall • Comms: MPI_Barrier: 0-byte, 26% wall, MPI_Allreduce: 8-byte, 5% wall • Compute: MPI_Barrier: 0-byte, 13% wall, MPI_Allreduce: 8-byte, 5% wall Fast network communication is important for scalability
  • 22.
    22 BSMBench Summary • Interconnectcomparison – EDR InfiniBand demonstrates higher scalability beyond 16 nodes as compared to Omni-Path – EDR InfiniBand delivers nearly 20% higher performance 32 nodes / 1024 cores – Similar performance advantage across all three example cases • Simultaneous Multithreading (SMT) provides additional benefit for compute – Up to 23% of performance gain is seen between no SMT versus 4 SMT threads are used • IBM CPU outperforms Intel by approximately23% – 32 cores per node used for Intel, versus 16 cores used per node for IBM • SpectrumMPI provides MXM and PAMI protocol for transport/communications – Up to 19% of higher performance at 4 nodes / 64 cores using Spectrum MPI / MXM
  • 23.
    All trademarks areproperty of their respective owners. All information is provided “As-Is” without any kind of warranty. The HPC Advisory Council makes no representation to the accuracy and completeness of the information contained herein. HPC Advisory Council undertakes no duty and assumes no obligation to update or correct any information presented herein Thank You