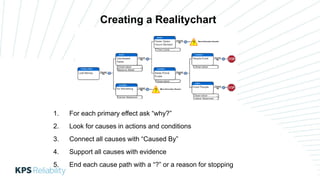
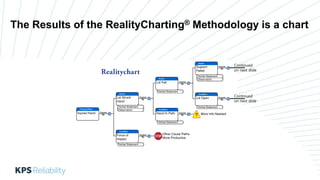
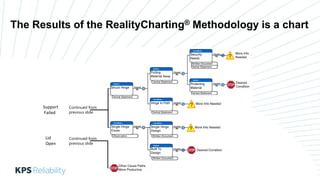
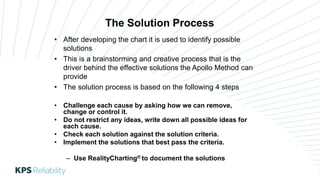
Apollo Process Introduction
Provided by Kevin Stewart
Our success in any endeavor
is directly dependent on
our ability to solve problems
Premise
• Root Cause Analysis is any structured process used to understand the
causes of past events for the purpose of preventing recurrence. The results
of this process must produce clear and concise documentation of all items
listed below:
What is Root Cause Analysis
• Define the problem including significance
• Clearly delineate the known causal relationships with a graphical representation
• Clearly establish all causal relationships between the root causes and the defined
problem as being necessary and sufficient
• Provide evidence to support each cause
• Identify and implement effective solutions
• Track and validate the effectiveness of the solutions
Why Do an RCA?
• Two Basic Reasons
– Solve a problem to prevent recurrence to save dollars or eliminate an unwanted
consequence
– Investigate a problem to identify systemic underlying issues that if identified and
eliminated will save an organization, time, money or consequences
• Things like low frequency high dollar items that on the surface may not seem
like candidates
• High consequence items (death, injury, safety)
Case Application # of
RCA’s
in study
Average $$
Value
returned/RCA
$ Cost of
analysis &
solutions
Payback
Period
1 Operations
Improvement
65 $75,000/yr $1,500 1 week
2 Maintenance
Improvement
30 $17,000/yr $1,800 5 weeks
3 Product Defect 1 $1.3 Billion $40 Million 1-1/2 weeks
What Is The Value of RCA?
• An example -
• One attendee took the class at $1595
• Was required to do a project using the skill she learned
• One Day after the class got a small group (3 – 5) together
• Spent 4 hours analyzing
• Found simple solution costing $1000 and implemented within the week
• Total cost to fix problem = $1,595 (class) + $1,000 (solution) + $1,600 (time cost)
• Cost savings = $400,000
• Simple ROI = $400,000 / $4,195 = 95.0 or 9500%!
The Value In Terms of ROI (Return on Investment)
Effective Problem Solving
Problem
Cause & Effect
Relationships
Solutions
Ineffective problem
solvers, often jump right
from the problem, to the
solution, without
considering the true
causes of the issue. Effective problem
solvers, know they must
identify the causes of an
issue to come up with
truly effective solutions
The RealityCharting® Process
1. Define the Problem
2. Create a Realitychart
a. Determine the causal relationships
b. Provide a graphical representation
c. Support causes with evidence
d. Determine if causes are sufficient and necessary
3. Identify Effective Solutions
4. Implement and Track Solutions
Step
Problem
Cause & Effect
Relationships
Solutions
Define the Problem
• To many times people skip this step
• If you don’t define what your fixing – everybody will generate their own problem
1. Cause and Effect are the same thing
2. Each Effect has at least two causes in the form of Actions & Conditions
3. Cause and Effects are part of an infinite continuum of causes
4. An Effect exists only if its causes exist in the same space and time frame
Four Cause and Effect Principles
• The above principles are used to guide practitioners to identify the unique set of
causes that underlie each problem
• Most of the work is spent identifying the causes for each effect and then putting
them together into a graphical representation of the problem
1. For each primary effect ask “why?”
2. Look for causes in actions and conditions
3. Connect all causes with “Caused By”
4. Support all causes with evidence
5. End each cause path with a “?” or a reason for stopping
Creating a Realitychart
The Results of the RealityCharting® Methodology is a chart
Continued
on next slide
Continued
on next slide
Continued from
previous slide
Continued from
previous slide
Support
Failed
Lid
Open
The Results of the RealityCharting® Methodology is a chart
The Solution Process
• Challenge each cause by asking how we can remove,
change or control it.
• Do not restrict any ideas, write down all possible ideas for
each cause.
• Check each solution against the solution criteria.
• Implement the solutions that best pass the criteria.
– Use RealityCharting® to document the solutions
• After developing the chart it is used to identify possible
solutions
• This is a brainstorming and creative process that is the
driver behind the effective solutions the Apollo Method can
provide
• The solution process is based on the following 4 steps
Document the Results
• A Report format is built right into the software and captures most of the information
automatically
• A copy of the report and the diagram is all you need to communicate the results of
the investigation
• Everything can be printed in PDF format so everyone in the organization can view
The Report
Includes all pertinent
information that is
already in the software to
save time:
• General investigation
info
• Problem definition
• Report summary
• Solutions (includes
person and due date)
• Team members
• Notes
Apollo Introduction

Apollo Introduction

  • 1.
  • 2.
    Our success inany endeavor is directly dependent on our ability to solve problems Premise
  • 3.
    • Root CauseAnalysis is any structured process used to understand the causes of past events for the purpose of preventing recurrence. The results of this process must produce clear and concise documentation of all items listed below: What is Root Cause Analysis • Define the problem including significance • Clearly delineate the known causal relationships with a graphical representation • Clearly establish all causal relationships between the root causes and the defined problem as being necessary and sufficient • Provide evidence to support each cause • Identify and implement effective solutions • Track and validate the effectiveness of the solutions
  • 4.
    Why Do anRCA? • Two Basic Reasons – Solve a problem to prevent recurrence to save dollars or eliminate an unwanted consequence – Investigate a problem to identify systemic underlying issues that if identified and eliminated will save an organization, time, money or consequences • Things like low frequency high dollar items that on the surface may not seem like candidates • High consequence items (death, injury, safety)
  • 5.
    Case Application #of RCA’s in study Average $$ Value returned/RCA $ Cost of analysis & solutions Payback Period 1 Operations Improvement 65 $75,000/yr $1,500 1 week 2 Maintenance Improvement 30 $17,000/yr $1,800 5 weeks 3 Product Defect 1 $1.3 Billion $40 Million 1-1/2 weeks What Is The Value of RCA?
  • 6.
    • An example- • One attendee took the class at $1595 • Was required to do a project using the skill she learned • One Day after the class got a small group (3 – 5) together • Spent 4 hours analyzing • Found simple solution costing $1000 and implemented within the week • Total cost to fix problem = $1,595 (class) + $1,000 (solution) + $1,600 (time cost) • Cost savings = $400,000 • Simple ROI = $400,000 / $4,195 = 95.0 or 9500%! The Value In Terms of ROI (Return on Investment)
  • 7.
    Effective Problem Solving Problem Cause& Effect Relationships Solutions Ineffective problem solvers, often jump right from the problem, to the solution, without considering the true causes of the issue. Effective problem solvers, know they must identify the causes of an issue to come up with truly effective solutions
  • 8.
    The RealityCharting® Process 1.Define the Problem 2. Create a Realitychart a. Determine the causal relationships b. Provide a graphical representation c. Support causes with evidence d. Determine if causes are sufficient and necessary 3. Identify Effective Solutions 4. Implement and Track Solutions Step Problem Cause & Effect Relationships Solutions
  • 9.
    Define the Problem •To many times people skip this step • If you don’t define what your fixing – everybody will generate their own problem
  • 10.
    1. Cause andEffect are the same thing 2. Each Effect has at least two causes in the form of Actions & Conditions 3. Cause and Effects are part of an infinite continuum of causes 4. An Effect exists only if its causes exist in the same space and time frame Four Cause and Effect Principles • The above principles are used to guide practitioners to identify the unique set of causes that underlie each problem • Most of the work is spent identifying the causes for each effect and then putting them together into a graphical representation of the problem
  • 11.
    1. For eachprimary effect ask “why?” 2. Look for causes in actions and conditions 3. Connect all causes with “Caused By” 4. Support all causes with evidence 5. End each cause path with a “?” or a reason for stopping Creating a Realitychart
  • 12.
    The Results ofthe RealityCharting® Methodology is a chart Continued on next slide Continued on next slide
  • 13.
    Continued from previous slide Continuedfrom previous slide Support Failed Lid Open The Results of the RealityCharting® Methodology is a chart
  • 14.
    The Solution Process •Challenge each cause by asking how we can remove, change or control it. • Do not restrict any ideas, write down all possible ideas for each cause. • Check each solution against the solution criteria. • Implement the solutions that best pass the criteria. – Use RealityCharting® to document the solutions • After developing the chart it is used to identify possible solutions • This is a brainstorming and creative process that is the driver behind the effective solutions the Apollo Method can provide • The solution process is based on the following 4 steps
  • 15.
    Document the Results •A Report format is built right into the software and captures most of the information automatically • A copy of the report and the diagram is all you need to communicate the results of the investigation • Everything can be printed in PDF format so everyone in the organization can view
  • 16.
    The Report Includes allpertinent information that is already in the software to save time: • General investigation info • Problem definition • Report summary • Solutions (includes person and due date) • Team members • Notes