Download to read offline

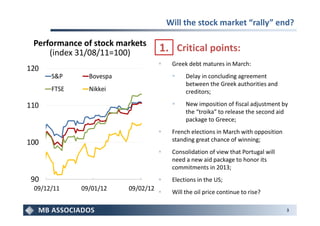
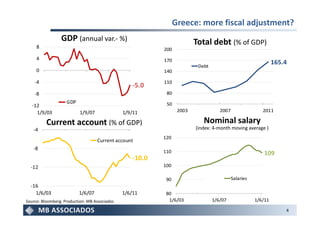

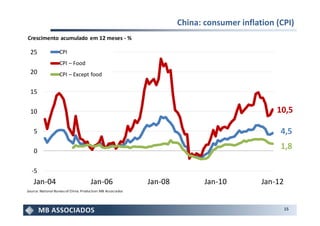


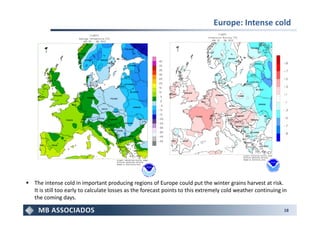
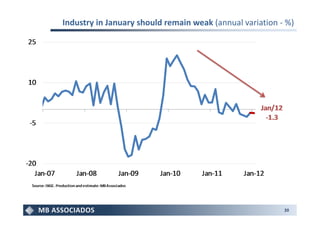
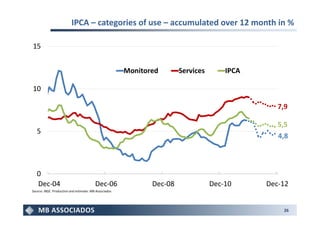
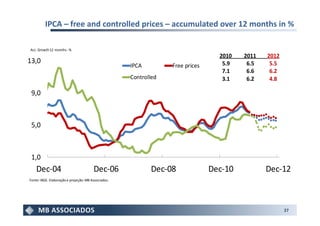
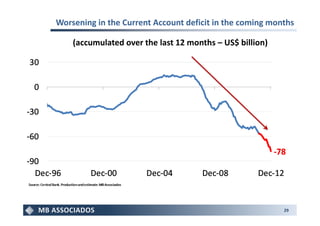
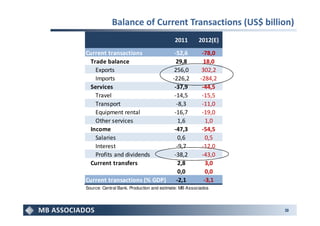

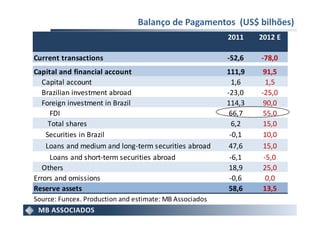

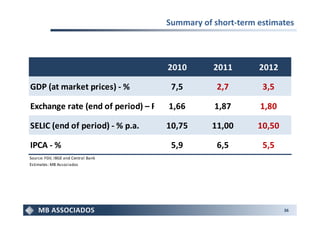


The document provides an international and domestic macroeconomic outlook. Key points internationally include concerns over Greek debt maturing in March and potential impacts on stock markets. Domestically, industry figures in January are expected to remain weak year-over-year. Recent inflation estimates show a slowing trend towards the 5.5% target for 2012. The current account deficit is expected to widen further in coming months.


