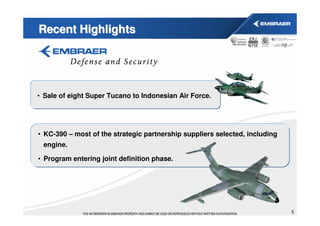
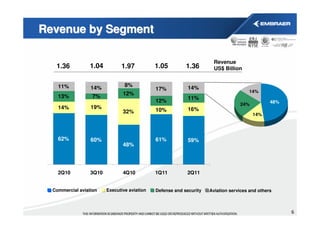
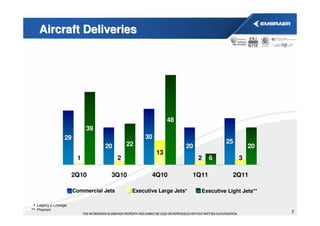
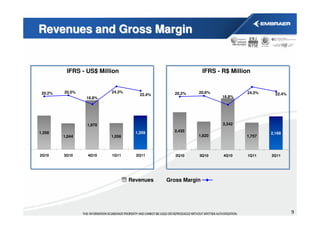
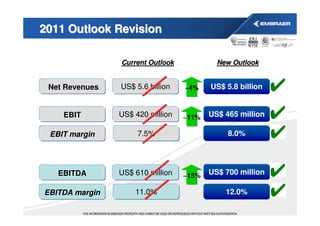
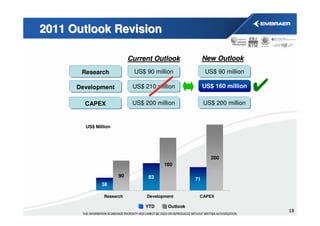
SECOND QUARTER 2011 RESULTS


                July 29th, 2011
Forward Looking Statement

This presentation includes forward-looking statements or statements about events or
circumstances which have not occurred. We have based these forward-looking statements
largely on our current expectations and projections about future events and financial trends
affecting our business and our future financial performance. These forward-looking
statements are subject to risks, uncertainties and assumptions, including, among other things:
general economic, political and business conditions, both in Brazil and in our market. The
words “believes,” “may,” “will,” “estimates,” “continues,” “anticipates,” “intends,” “expects” and
similar words are intended to identify forward-looking statements. We undertake no
obligations to update publicly or revise any forward-looking statements because of new
information, future events or other factors. In light of these risks and uncertainties, the
forward-looking events and circumstances discussed in this presentation might not occur. Our
actual results could differ substantially from those anticipated in our forward-looking
statements.


                                                                                                     2
Recent Highlights


• Market demand – at Paris Air Show four new deals annouced:

Sriwijaya (Indonesia), Kenya Airways, GECAS (U.S.) and Air Lease (U.S.).


• 1H11: delivery of 45 jets and sale of 62 E-Jets, reaching 1,003 firm orders
 and 742 deliveries.

• 42 additional aircraft pending final documentation, totaling 104 in 1H11.


  • Continuous customer base expansion – three new
   airlines added: People’s Viennaline (Austria),
   Air Astana (Kazakhstan) and Bulgaria Air.

                                                                                3
Recent Highlights


• Strategic cooperation agreement with China’s Minsheng Financial Leasing
 for up to 20 executive jets.


               • EBACE – first signs of recovery with a couple of orders:

               Comlux The Aviation Group – three Legacy 650;

               Portugal’s Ricon Group (Everjets) – one Phenom 300.


• Delivery of the 200th Phenom to Swift Aviation Group.


                                                                            4
Recent Highlights


• Sale of eight Super Tucano to Indonesian Air Force.


• KC-390 – most of the strategic partnership suppliers selected, including
 engine.

• Program entering joint definition phase.


                                                                             5
Revenue by Segment

                                                                       Revenue
   1.36          1.04          1.97           1.05         1.36        US$ Billion


    11%                          8%
                  14%                         17%           14%
                                                                                      14%
                                12%
    13%            7%                                       11%
                                              12%                                               48%
                                                                                  24%
    14%           19%                                       16%
                                32%           10%
                                                                                        14%


    62%           60%                         61%           59%
                                48%


    2Q10          3Q10          4Q10          1Q11         2Q11


  Commercial aviation    Executive aviation   Defense and security   Aviation services and others


                                                                                                      6
Aircraft Deliveries


                                                            48
                           39
                 29                               30
                                            22                                  25
                                 20                              20                      20
                                                       13
                       1                2                             2     6        3

                      2Q10         3Q10             4Q10             1Q11          2Q11

                      Commercial Jets        Executive Large Jets*     Executive Light Jets**

 * Legacy e Lineage
** Phenom                                                                                       7
Firm Order Backlog

US$ Billion


                              3.8
                     3.0                  3.2       3.0
              2.8                                             2.9     2.8


                     18.8    20.9
              14.8                    16.6          15.6     16.0     15.8


              2006   2007    2008     2009          2010   1Q2011 2Q2011

                     Firm Order Backlog         Backlog/Revenue (Years)


                                                                             8
Revenues and Gross Margin


          IFRS - US$ Million                                IFRS - R$ Million


 20.2%   20.5%           24.3%                 20.2%    20.6%              24.3%
                                     22.4%                                           22.4%
                 16.8%                                             16.8%


                 1,970                                             3,342

1,358                              1,359       2,435
                                                                                   2,169
         1,044           1,056                          1,820              1,757


2Q10     3Q10    4Q10    1Q11      2Q11         2Q10    3Q10       4Q10     1Q11   2Q11


                                 Revenues    Gross Margin


                                                                                             9
SG&A Expenses


        IFRS - US$ Million                          IFRS - R$ Million
                                                           282             277
                              173         256      247             252
               167
143                    151                                 103
       142                                                                 103
               61              64         88                        95
                                                   92
49                      57
       53


                              109         168              179             174
94             106      94                         155              157
       89


2Q10   3Q10    4Q10    1Q11   2Q11        2Q10     3Q10    4Q10     1Q11   2Q11


                        G&A Expenses   Selling Expenses


                                                                                  10
Income from Operations


         IFRS - US$ Million                            IFRS - R$ Million

 9.0%           6.7%    8.9%     7.8%      9.0%               6.7%     8.9%     7.8%
        6.4%
                                                      6.4%


                132                        219                225
122
                               106                                            169
                         94                                            157
         66                                           116


2Q10    3Q10    4Q10    1Q11   2Q11        2Q10       3Q10    4Q10    1Q11    2Q11


                                 EBIT   EBIT Margin


                                                                                       11
EBITDA


         IFRS - US$ Million                           IFRS - R$ Million

12.2%   12.5%           14.8%                12.2%   12.5%           14.8%
                                  11.3%                                       11.5%
                10.0%                                        10.0%


                 197                                         335
166                                          298
                         156     153                                  260    250
        131                                          227


2Q10    3Q10    4Q10    1Q11    2Q11         2Q10    3Q10    4Q10    1Q11    2Q11


                                EBITDA    EBITDA Margin


                                                                                      12
Net Income


         IFRS - US$ Million                                IFRS - R$ Million


                        10,0%                                              9.9%
                                                          12.1%
        12,1%                                                                      7.1%
                                                                  6.2%
                6,2%                 7,1%
4,2%
                                                4.2%


                                                          220     208
        126     123                                                        174
                        105         96                                            154
                                                102
  57


 2Q10   3Q10    4Q10    1Q11       2Q11         2Q10      3Q10    4Q10     1Q11   2Q11


                                Net Income   Net Margin


                                                                                          13
Inventories / Free Cash Flow


                Inventories                            Free Cash Flow


                                              220
                                                            193


        2,708                         2,697
                              2,561
2,371
                   2,198                                                    (38)
                                                     (66)
                                                                    (126)


2Q10    3Q10        4Q10      1Q11    2Q11    2Q10   3Q10   4Q10    1Q11    2Q11


                                                                                   14
Indebtedness Profile / Net Cash


           Indebtedness Maturity                                   Net Cash

           6%        5%       10%      13%
22%
                     6.3
            6.1
5.8                           5.7
                                           5.0
                    95%       90%                                     692
           94%                         87%       652        618
                                                                               505
78%                                                                                     406


2Q10       3Q10     4Q10      1Q11     2Q11      2Q10       3Q10      4Q10    1Q11      2Q11


        Long-term         Short-term
        Loans Average Maturity (Years)


       Total Debt 2Q11: US$ 1.72 Billion                Total Cash 2Q11: US$ 2.13 Billion

                                                                                               15
2011 OUTLOOK REVISION
2011 Outlook Revision

                Current Outlook            New Outlook


 Net Revenues   US$ 5.6 billion   ~4%    US$ 5.8 billion


    EBIT        US$ 420 million   ~11%   US$ 465 million

 EBIT margin         7.5%                     8.0%


   EBITDA       US$ 610 million   ~15%   US$ 700 million

EBITDA margin       11.0%                    12.0%
2011 Outlook Revision

                           Current Outlook              New Outlook
       Research             US$ 90 million              US$ 90 million

      Development           US$ 210 million             US$ 160 million

        CAPEX               US$ 200 million             US$ 200 million


        US$ Million


                                                          200
                                        160

                      90         83                71
               38

                Research         Development        CAPEX

                                YTD      Outlook
                                                                          18
19

Embraer 2Q11 Results Final

  • 1.
    SECOND QUARTER 2011RESULTS July 29th, 2011
  • 2.
    Forward Looking Statement Thispresentation includes forward-looking statements or statements about events or circumstances which have not occurred. We have based these forward-looking statements largely on our current expectations and projections about future events and financial trends affecting our business and our future financial performance. These forward-looking statements are subject to risks, uncertainties and assumptions, including, among other things: general economic, political and business conditions, both in Brazil and in our market. The words “believes,” “may,” “will,” “estimates,” “continues,” “anticipates,” “intends,” “expects” and similar words are intended to identify forward-looking statements. We undertake no obligations to update publicly or revise any forward-looking statements because of new information, future events or other factors. In light of these risks and uncertainties, the forward-looking events and circumstances discussed in this presentation might not occur. Our actual results could differ substantially from those anticipated in our forward-looking statements. 2
  • 3.
    Recent Highlights • Marketdemand – at Paris Air Show four new deals annouced: Sriwijaya (Indonesia), Kenya Airways, GECAS (U.S.) and Air Lease (U.S.). • 1H11: delivery of 45 jets and sale of 62 E-Jets, reaching 1,003 firm orders and 742 deliveries. • 42 additional aircraft pending final documentation, totaling 104 in 1H11. • Continuous customer base expansion – three new airlines added: People’s Viennaline (Austria), Air Astana (Kazakhstan) and Bulgaria Air. 3
  • 4.
    Recent Highlights • Strategiccooperation agreement with China’s Minsheng Financial Leasing for up to 20 executive jets. • EBACE – first signs of recovery with a couple of orders: Comlux The Aviation Group – three Legacy 650; Portugal’s Ricon Group (Everjets) – one Phenom 300. • Delivery of the 200th Phenom to Swift Aviation Group. 4
  • 5.
    Recent Highlights • Saleof eight Super Tucano to Indonesian Air Force. • KC-390 – most of the strategic partnership suppliers selected, including engine. • Program entering joint definition phase. 5
  • 6.
    Revenue by Segment Revenue 1.36 1.04 1.97 1.05 1.36 US$ Billion 11% 8% 14% 17% 14% 14% 12% 13% 7% 11% 12% 48% 24% 14% 19% 16% 32% 10% 14% 62% 60% 61% 59% 48% 2Q10 3Q10 4Q10 1Q11 2Q11 Commercial aviation Executive aviation Defense and security Aviation services and others 6
  • 7.
    Aircraft Deliveries 48 39 29 30 22 25 20 20 20 13 1 2 2 6 3 2Q10 3Q10 4Q10 1Q11 2Q11 Commercial Jets Executive Large Jets* Executive Light Jets** * Legacy e Lineage ** Phenom 7
  • 8.
    Firm Order Backlog US$Billion 3.8 3.0 3.2 3.0 2.8 2.9 2.8 18.8 20.9 14.8 16.6 15.6 16.0 15.8 2006 2007 2008 2009 2010 1Q2011 2Q2011 Firm Order Backlog Backlog/Revenue (Years) 8
  • 9.
    Revenues and GrossMargin IFRS - US$ Million IFRS - R$ Million 20.2% 20.5% 24.3% 20.2% 20.6% 24.3% 22.4% 22.4% 16.8% 16.8% 1,970 3,342 1,358 1,359 2,435 2,169 1,044 1,056 1,820 1,757 2Q10 3Q10 4Q10 1Q11 2Q11 2Q10 3Q10 4Q10 1Q11 2Q11 Revenues Gross Margin 9
  • 10.
    SG&A Expenses IFRS - US$ Million IFRS - R$ Million 282 277 173 256 247 252 167 143 151 103 142 103 61 64 88 95 92 49 57 53 109 168 179 174 94 106 94 155 157 89 2Q10 3Q10 4Q10 1Q11 2Q11 2Q10 3Q10 4Q10 1Q11 2Q11 G&A Expenses Selling Expenses 10
  • 11.
    Income from Operations IFRS - US$ Million IFRS - R$ Million 9.0% 6.7% 8.9% 7.8% 9.0% 6.7% 8.9% 7.8% 6.4% 6.4% 132 219 225 122 106 169 94 157 66 116 2Q10 3Q10 4Q10 1Q11 2Q11 2Q10 3Q10 4Q10 1Q11 2Q11 EBIT EBIT Margin 11
  • 12.
    EBITDA IFRS - US$ Million IFRS - R$ Million 12.2% 12.5% 14.8% 12.2% 12.5% 14.8% 11.3% 11.5% 10.0% 10.0% 197 335 166 298 156 153 260 250 131 227 2Q10 3Q10 4Q10 1Q11 2Q11 2Q10 3Q10 4Q10 1Q11 2Q11 EBITDA EBITDA Margin 12
  • 13.
    Net Income IFRS - US$ Million IFRS - R$ Million 10,0% 9.9% 12.1% 12,1% 7.1% 6.2% 6,2% 7,1% 4,2% 4.2% 220 208 126 123 174 105 96 154 102 57 2Q10 3Q10 4Q10 1Q11 2Q11 2Q10 3Q10 4Q10 1Q11 2Q11 Net Income Net Margin 13
  • 14.
    Inventories / FreeCash Flow Inventories Free Cash Flow 220 193 2,708 2,697 2,561 2,371 2,198 (38) (66) (126) 2Q10 3Q10 4Q10 1Q11 2Q11 2Q10 3Q10 4Q10 1Q11 2Q11 14
  • 15.
    Indebtedness Profile /Net Cash Indebtedness Maturity Net Cash 6% 5% 10% 13% 22% 6.3 6.1 5.8 5.7 5.0 95% 90% 692 94% 87% 652 618 505 78% 406 2Q10 3Q10 4Q10 1Q11 2Q11 2Q10 3Q10 4Q10 1Q11 2Q11 Long-term Short-term Loans Average Maturity (Years) Total Debt 2Q11: US$ 1.72 Billion Total Cash 2Q11: US$ 2.13 Billion 15
  • 16.
  • 17.
    2011 Outlook Revision Current Outlook New Outlook Net Revenues US$ 5.6 billion ~4% US$ 5.8 billion EBIT US$ 420 million ~11% US$ 465 million EBIT margin 7.5% 8.0% EBITDA US$ 610 million ~15% US$ 700 million EBITDA margin 11.0% 12.0%
  • 18.
    2011 Outlook Revision Current Outlook New Outlook Research US$ 90 million US$ 90 million Development US$ 210 million US$ 160 million CAPEX US$ 200 million US$ 200 million US$ Million 200 160 90 83 71 38 Research Development CAPEX YTD Outlook 18
  • 19.