Download to read offline

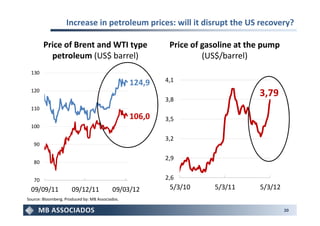
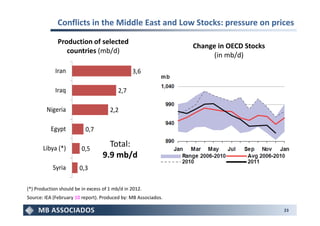


The document provides an overview of the macroeconomic scenario and includes the following key points: 1. The European authorities' strategy is to postpone any potential collapse of the Eurozone while the financial system and global economy can better absorb the costs. 2. The US economy continues positive growth, which could allow the Fed to postpone further quantitative easing. 3. Conflicts in the Middle East and low oil stockpiles are putting pressure on rising oil prices, which could disrupt the US recovery.


