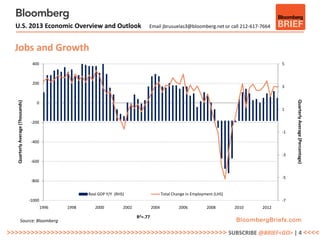
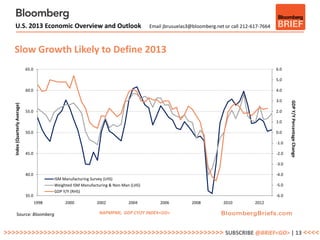
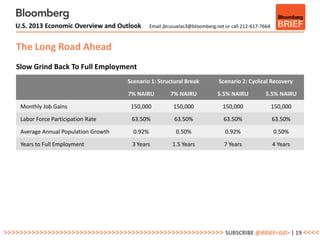
Bloomberg BRIEF: Economics
U.S. 2013 Economic Overview and Outlook
                   Joseph Brusuelas | January 2013
U.S. 2013 Economic Overview and Outlook   Email jbrusuelas3@bloomberg.net or call 212-617-7664


  Executive Summary
  Politics and Policy To Be Major Determinants of Growth
  • Fiscal drag to be a major theme in 2013.
    - Automatic sequestration could increase fiscal drag.
  • Fed policy designed to address economy caught in liquidity trap.
    - Fed will continue to purchase assets throughout 2013.
  • Chances for major tax and fiscal reform are probably remote.


>>>>>>>>>>>>>>>>>>>>>>>>>>>>>>>>>>>>>>>>>>>>>>>>>>>>>>> SUBSCRIBE @BRIEF<GO> | 2 <<<<
U.S. 2013 Economic Overview and Outlook   Email jbrusuelas3@bloomberg.net or call 212-617-7664


  Executive Summary
  Another Year of 2 Percent Growth Likely
  • Job growth around 150,000 per month with a modest decline in the
    unemployment rate by end of year.
  • Growth drivers: energy, housing , manufacturing and improving financial conditions.
  Risks to the outlook
  • External Sector: Euro zone and Middle East tensions.
  • Domestic fiscal policy disputes.
  • Financial regulation.


>>>>>>>>>>>>>>>>>>>>>>>>>>>>>>>>>>>>>>>>>>>>>>>>>>>>>>> SUBSCRIBE @BRIEF<GO> | 3 <<<<
U.S. 2013 Economic Overview and Outlook                                             Email jbrusuelas3@bloomberg.net or call 212-617-7664


  Jobs and Growth
                                    400                                                                                                           5


                                    200
                                                                                                                                                  3


                                                                                                                                                       Quarterly Average (Percentage)
   Quarterly Average (Thousands)


                                      0
                                                                                                                                                  1

                                    -200

                                                                                                                                                  -1

                                    -400

                                                                                                                                                  -3
                                    -600


                                                                                                                                                  -5
                                    -800

                                                         Real GDP Y/Y (RHS)                      Total Change in Employment (LHS)
                                   -1000                                                                                                          -7
                                           1996   1998      2000          2002            2004            2006          2008        2010   2012

                                                                                 R2=.77
                Source: Bloomberg

>>>>>>>>>>>>>>>>>>>>>>>>>>>>>>>>>>>>>>>>>>>>>>>>>>>>>>> SUBSCRIBE @BRIEF<GO> | 4 <<<<
U.S. 2013 Economic Overview and Outlook     Email jbrusuelas3@bloomberg.net or call 212-617-7664


  Executive Summary
  US Economy: Liquidity Trap Prevails
  • Slow growth and elevated unemployment continue.
  • Investors have not priced in fiscal drag on growth in first half of 2013.
  • 10-year rate likely hit high for until second half of year.
  • Dollar weakness to persist against trade weighted basket of currencies.
  • Policy debate around debt ceiling and sequestration to economy remains the primary
    risk to the economic outlook.


>>>>>>>>>>>>>>>>>>>>>>>>>>>>>>>>>>>>>>>>>>>>>>>>>>>>>>> SUBSCRIBE @BRIEF<GO> | 5 <<<<
U.S. 2013 Economic Overview and Outlook                                          Email jbrusuelas3@bloomberg.net or call 212-617-7664


  Mind The Gap
                                                                    US Retains Substantial Output Gap
                               15
                                                  Real GDP               Real Potential Output
                               14


                               13
  Trillions (2005 Chained $)


                               12


                               11


                               10


                               9


                               8


                               7
                                    1990   1992      1994    1996       1998      2000       2002   2004      2006     2008      2010     2012

                       Source: Bloomberg


>>>>>>>>>>>>>>>>>>>>>>>>>>>>>>>>>>>>>>>>>>>>>>>>>>>>>>> SUBSCRIBE @BRIEF<GO> | 6 <<<<
U.S. 2013 Economic Overview and Outlook                              Email jbrusuelas3@bloomberg.net or call 212-617-7664


  Labor Market Slack Persists
             58                                                                                                                 11
                         Employment to Population Ratio (LHS)     Unemployment Rate (RHS, Inverted)

                                                                                                                                10
             59


                                                                                                                                9
             60

                                                                                                                                8
             61
   Percent


                                                                                                                                     Percent
                                                                                                                                7

             62
                                                                                                                                6

             63
                                                                                                                                5


             64
                                                                                                                                4


             65                                                                                                                 3
                  1990   1992      1994      1996      1998     2000       2002     2004     2006     2008      2010     2012

       Source: Bloomberg                            USERTOT , USURTOT INDEX<GO>


>>>>>>>>>>>>>>>>>>>>>>>>>>>>>>>>>>>>>>>>>>>>>>>>>>>>>>> SUBSCRIBE @BRIEF<GO> | 7 <<<<
U.S. 2013 Economic Overview and Outlook                               Email jbrusuelas3@bloomberg.net or call 212-617-7664


  Real Consumption on Lower Trend
                               11000


                               10500
                                                                         Real PCE Trend Prior to Recession
   Billions (Chained 2005 $)


                               10000


                                9500


                                9000


                                8500


                                8000
                                       2005   2006   2007        2008          2009         2010             2011    2012
              Source: Bloomberg                      US.HHSPNR BEA INDEX<GO>


>>>>>>>>>>>>>>>>>>>>>>>>>>>>>>>>>>>>>>>>>>>>>>>>>>>>>>> SUBSCRIBE @BRIEF<GO> | 8 <<<<
U.S. 2013 Economic Overview and Outlook      Email jbrusuelas3@bloomberg.net or call 212-617-7664


  Cyclical Growth Outlook
  Core Scenario: Below Trend (2.5 percent) Growth
  • Liquidity Trap Defines Business Cycle.
  • Liquidity injections into banking system have failed to stimulate growth and
    employment back to trend.
  • Monetary policy targeting liquidity trap.
  • Policy gridlock offers no fiscal relief.


>>>>>>>>>>>>>>>>>>>>>>>>>>>>>>>>>>>>>>>>>>>>>>>>>>>>>>> SUBSCRIBE @BRIEF<GO> | 9 <<<<
U.S. 2013 Economic Overview and Outlook   Email jbrusuelas3@bloomberg.net or call 212-617-7664


   Cyclical Growth Outlook
   Structural adjustment to growth model and labor market continues.
   • Moving away from overconsumption based on easy credit.
   • Growth: 2.2 percent cyclical growth average.
   • Consumption: 1.5 percent cyclical growth average.
   • Diversification of growth drivers.
   • Elevated unemployment likely to persist.
   • Public and private deleveraging continues.


>>>>>>>>>>>>>>>>>>>>>>>>>>>>>>>>>>>>>>>>>>>>>>>>>>>>>>> SUBSCRIBE @BRIEF<GO> | 10 <<<<
U.S. 2013 Economic Overview and Outlook   Email jbrusuelas3@bloomberg.net or call 212-617-7664


   Cyclical Growth Outlook
   Alternative Scenario: Cyclical Outperformance
   • Long term tax and fiscal reform.
   • Sustainable increase in corporate and consumer confidence.
   • Domestic corporations deploy.
   • Growth and hiring move back toward long term trends.
   • Rising rates and inflation.


>>>>>>>>>>>>>>>>>>>>>>>>>>>>>>>>>>>>>>>>>>>>>>>>>>>>>>> SUBSCRIBE @BRIEF<GO> | 11 <<<<
U.S. 2013 Economic Overview and Outlook   Email jbrusuelas3@bloomberg.net or call 212-617-7664


   Bloomberg Consensus: Survey of Forecasters

                                         Q4 12          Q1 13          Q2 13          Q3 13         Q4 13


     Real GDP                           1.40%          1.60%          2.10%          2.50%          2.80%

     CPI                                2.0%           1.70%           2.0%          1.90%          2.10%

     Core PCE                           1.70%          1.60%          1.60%          1.70%          1.80%

     Unemployment                       7.83%          7.80%          7.80%          7.70%          7.50%

     Central Bank Rate                  0.25%          0.25%          0.25%          0.25%          0.25%

     2-Year Rate                        0.25%          0.26%          0.29%          0.34%          0.41%

     10-Year Rate                       1.76%          1.76%          1.86%          1.99%          2.14%

     EUR/USD                            $1.32          $1.29          $1.28           $1.27         $1.27


>>>>>>>>>>>>>>>>>>>>>>>>>>>>>>>>>>>>>>>>>>>>>>>>>>>>>>> SUBSCRIBE @BRIEF<GO> | 12 <<<<
U.S. 2013 Economic Overview and Outlook                                               Email jbrusuelas3@bloomberg.net or call 212-617-7664


   Slow Growth Likely to Define 2013
                               65.0                                                                                                              6.0

                                                                                                                                                 5.0

                               60.0                                                                                                              4.0

                                                                                                                                                 3.0


                                                                                                                                                        GDP Y/Y Percentage Change
   Index (Quarterly Average)


                               55.0                                                                                                              2.0

                                                                                                                                                 1.0

                               50.0                                                                                                              0.0

                                                                                                                                                 -1.0

                               45.0                                                                                                              -2.0

                                                                                                                                                 -3.0

                               40.0                                                                                                              -4.0
                                             ISM Manufacturing Survey (LHS)
                                             Weighted ISM Manufacturing & Non-Man (LHS)                                                          -5.0
                                             GDP Y/Y (RHS)
                               35.0                                                                                                              -6.0
                                      1998        2000           2002            2004         2006          2008         2010          2012

          Source: Bloomberg                                       NAPMPMI, GDP CYOY INDEX<GO>


>>>>>>>>>>>>>>>>>>>>>>>>>>>>>>>>>>>>>>>>>>>>>>>>>>>>>>> SUBSCRIBE @BRIEF<GO> | 13 <<<<
U.S. 2013 Economic Overview and Outlook                        Email jbrusuelas3@bloomberg.net or call 212-617-7664


   Low Wage Bias in Hiring
               150


               125


               100


               75
   Thousands


               50


               25


                 0


               -25
                            Leisure and Hospitality      Health Care and Social Assistance     Temp           Retail Trade
               -50
                     2010                                                 2011                                               2012
     Source: Bloomberg                     USRTTOT, USESTEMP, USEETOTS, USEHTOTS INDEX<GO>


>>>>>>>>>>>>>>>>>>>>>>>>>>>>>>>>>>>>>>>>>>>>>>>>>>>>>>> SUBSCRIBE @BRIEF<GO> | 14 <<<<
U.S. 2013 Economic Overview and Outlook                            Email jbrusuelas3@bloomberg.net or call 212-617-7664


   Real Consumption and Consumer Confidence
           120                                                                                                               8


           110
                                                                                                                             6


                                                                                                                                  Year Over Year Percentage Change
           100
                                                                                                                             4

            90
   Index


                                                                                                                             2

            80

                                                                                                                             0
            70


                                                                                                                             -2
            60

                        University of Michigan Consumer Sentiment     Real Personal Consumption
            50                                                                                                               -4
                 1996       1998          2000         2002         2004        2006         2008       2010         2012

                                         PCE CHY%, CONSSENT INDEX<GO>
    Source: Bloomberg

>>>>>>>>>>>>>>>>>>>>>>>>>>>>>>>>>>>>>>>>>>>>>>>>>>>>>>> SUBSCRIBE @BRIEF<GO> | 15 <<<<
U.S. 2013 Economic Overview and Outlook   Email jbrusuelas3@bloomberg.net or call 212-617-7664


   Central Bank Policy Outlook and Overview
   Fed will likely remain on hold throughout 2013
   • Forward guidance to remain unchanged.
   • Asset purchase to remain in place, then slow in 2014.


   .


>>>>>>>>>>>>>>>>>>>>>>>>>>>>>>>>>>>>>>>>>>>>>>>>>>>>>>> SUBSCRIBE @BRIEF<GO> | 16 <<<<
U.S. 2013 Economic Overview and Outlook    Email jbrusuelas3@bloomberg.net or call 212-617-7664


   Central Bank Policy Outlook and Overview
   • Aggressive action to unclog monetary transmission mechanism to remain in place
     through 2013.
   • Balance sheet likely to expand to $4 trillion by end of 2013.
   • If policy does not gain traction, Fed will begin to create conditions for targeting of
     nominal GDP.


>>>>>>>>>>>>>>>>>>>>>>>>>>>>>>>>>>>>>>>>>>>>>>>>>>>>>>> SUBSCRIBE @BRIEF<GO> | 17 <<<<
U.S. 2013 Economic Overview and Outlook   Email jbrusuelas3@bloomberg.net or call 212-617-7664


   Central Bank Policy Outlook and Overview
   Five C’s of U.S. Monetary Policy
   • Communications
   • Commitment
   • Conditionality
   • Composition
   • Credibility


>>>>>>>>>>>>>>>>>>>>>>>>>>>>>>>>>>>>>>>>>>>>>>>>>>>>>>> SUBSCRIBE @BRIEF<GO> | 18 <<<<
U.S. 2013 Economic Overview and Outlook       Email jbrusuelas3@bloomberg.net or call 212-617-7664


   The Long Road Ahead
   Slow Grind Back To Full Employment
                                       Scenario 1: Structural Break           Scenario 2: Cyclical Recovery

                                       7% NAIRU           7% NAIRU            5.5% NAIRU           5.5% NAIRU

    Monthly Job Gains                   150,000            150,000              150,000                 150,000

    Labor Force Participation Rate      63.50%             63.50%               63.50%                  63.50%

    Average Annual Population Growth     0.92%              0.50%                0.92%                  0.50%

    Years to Full Employment            3 Years           1.5 Years              7 Years                4 Years


>>>>>>>>>>>>>>>>>>>>>>>>>>>>>>>>>>>>>>>>>>>>>>>>>>>>>>> SUBSCRIBE @BRIEF<GO> | 19 <<<<
U.S. 2013 Economic Overview and Outlook                                Email jbrusuelas3@bloomberg.net or call 212-617-7664


   Mortgage Backed Primary Secondary Spread
                  180

                                                             Fed MBS Purchase Program Starts


                  160


                  140
   Basis Points


                  120


                  100


                                                                                Mortgage Backed Primary-Secondary Spread
                   80
                    Jan-12   Feb-12   Mar-12   Apr-12   May-12   Jun-12    Jul-12   Aug-12     Sep-12    Oct-12    Nov-12   Dec-12   Jan-13


     Source: Bloomberg                          ILM3NAVG, MTGEFNCL INDEX<GO>


>>>>>>>>>>>>>>>>>>>>>>>>>>>>>>>>>>>>>>>>>>>>>>>>>>>>>>> SUBSCRIBE @BRIEF<GO> | 20 <<<<
U.S. 2013 Economic Overview and Outlook                     Email jbrusuelas3@bloomberg.net or call 212-617-7664


      Monetary Policy at the Zero Bound
                                    Taylor Rule & Evans Rule Estimates of the Fed Funds Rates
                 8

                 6
                                                                                                   Taylor Rule Estinates
                                                       Fed Funds Rate
                 4

                 2
   Percentage


                 0

                                                                                                       Evans Rule
                 -2                                                                                    Estimates

                 -4

                 -6

                 -8

                -10
                      2007   2008   2009      2010       2011        2012       2013        2014         2015


  Source: Bloomberg                            USFEDL01, PCE CYOY, USURTOT INDEX<GO>


>>>>>>>>>>>>>>>>>>>>>>>>>>>>>>>>>>>>>>>>>>>>>>>>>>>>>>> SUBSCRIBE @BRIEF<GO> | 21 <<<<
U.S. 2013 Economic Overview and Outlook    Email jbrusuelas3@bloomberg.net or call 212-617-7664


   Rate Outlook
   U.S. 10-Year likely posted highs for first half of 2013
   • Forward looking rates indicated Fed policy to continue to suppress curve.
   • Slower spending, followed by slow growth and modest deceleration in hiring mid year.
   • Expect move back toward 1.50 on 10-year due to weak January data.
   • Long term rates should trade in range between 1.50 and 2 percent.
   • Risks to the outlook:
     - Acceleration in demand from external sector bolsters growth prospects.
     - Gains in labor market and housing offset fiscal drag.
     - Premature exit by Fed from asset purchase program.


>>>>>>>>>>>>>>>>>>>>>>>>>>>>>>>>>>>>>>>>>>>>>>>>>>>>>>> SUBSCRIBE @BRIEF<GO> | 22 <<<<
U.S. 2013 Economic Overview and Outlook   Email jbrusuelas3@bloomberg.net or call 212-617-7664


Image page
  U.S. Rates Overview
   Bloomberg consensus forecast indicates higher 10- and 30-year rates.
   Fed Asset Purchases Likely to continue near $85 billion per month.
   Current Rates:
   • 2-Year:   .41 percent
   • 10-year: 2.14 percent
   • 30-year: 3.26 percent
   Fourth Quarter Consensus Survey Rate Forecast:
   • 2-Year: .26 percent
   • 10-year: 1.90 percent
   • 30-year: 3.10 percent


>>>>>>>>>>>>>>>>>>>>>>>>>>>>>>>>>>>>>>>>>>>>>>>>>>>>>>> SUBSCRIBE @BRIEF<GO> | 23 <<<<
U.S. 2013 Economic Overview and Outlook                          Email jbrusuelas3@bloomberg.net or call 212-617-7664


   Projected Path of Long- and Short-Term Rates
             4.50


             4.00


             3.50


             3.00


             2.50
   Percent


             2.00


             1.50


             1.00


             0.50
                         US 10-Year (LHS)      3-Month, 2-Year Forward (RHS)
             0.00
                Jan-08                Jan-09               Jan-10                  Jan-11               Jan-12             Jan-13

    Source: Bloomberg
    USGG10YR INDEX, G0025 2Y3M BLC2CURNCY<GO>


>>>>>>>>>>>>>>>>>>>>>>>>>>>>>>>>>>>>>>>>>>>>>>>>>>>>>>> SUBSCRIBE @BRIEF<GO> | 24 <<<<
U.S. 2013 Economic Overview and Outlook   Email jbrusuelas3@bloomberg.net or call 212-617-7664


   FX Overview
   Dollar appreciation versus euro- and-trade weighted basket of currencies eases:
   • Global central bank policy will drive foreign exchange valuations.
   • Competitive quantitative easing manage currency competition among highly indebted
     industrialized states.
   • USD depreciation against a broader trade weighted based of currencies.
   • Winners
     - AUD
     - CAD
     - BRL
     - MXN


>>>>>>>>>>>>>>>>>>>>>>>>>>>>>>>>>>>>>>>>>>>>>>>>>>>>>>> SUBSCRIBE @BRIEF<GO> | 25 <<<<
U.S. 2013 Economic Overview and Outlook                       Email jbrusuelas3@bloomberg.net or call 212-617-7664


   Dollar Depreciation Likely to Continue
            115
                                                QE 1 Begins                               QE 2                     QE 3


            110


            105
    Index


            100


             95


                     Real Trade Weighted Broad Dollar Index
             90
              2006          2007         2008                 2009           2010           2011            2012          2013

    Source: Bloomberg                            USTWBROA INDEX<GO>

>>>>>>>>>>>>>>>>>>>>>>>>>>>>>>>>>>>>>>>>>>>>>>>>>>>>>>> SUBSCRIBE @BRIEF<GO> | 26 <<<<
U.S. 2013 Economic Overview and Outlook   Email jbrusuelas3@bloomberg.net or call 212-617-7664


Image page
   U.S. Manufacturing Outlook
   Manufacturing growth stabilizes
   • Rise in capital expenditures following resolution of
     - Automatic sequestration.
     - Debt ceiling.
     - Auto production leads modest growth in manufacturing.
       o Rebuilding of auto stock following Hurricane Sandy.
       o 250,000 autos destroyed by storm.

   External Demand Rebounds
   • Modest support for U.S. growth picture.
   • European recession.
   • China bounce in second half of 2013.


>>>>>>>>>>>>>>>>>>>>>>>>>>>>>>>>>>>>>>>>>>>>>>>>>>>>>>> SUBSCRIBE @BRIEF<GO> | 27 <<<<
U.S. 2013 Economic Overview and Outlook                                              Email jbrusuelas3@bloomberg.net or call 212-617-7664


   Industrial Production and Growth
                           6.0                                                                                                                   10.0

                           5.0


                                                                                                                                                         Y/Y Percentage Change (Quarterly Average)
                           4.0
                                                                                                                                                 5.0

                           3.0
   Y/Y Percentage Change


                           2.0
                                                                                                                                                 0.0
                           1.0

                           0.0
                                                                                                                                                 -5.0
                           -1.0

                           -2.0

                                                                                                                                                 -10.0
                           -3.0

                           -4.0
                                         GDP CYOY (LHS)          Industrial Production (RHS)
                           -5.0                                                                                                                  -15.0
                                  1996         1998       2000           2002             2004       2006         2008        2010        2012
         Source: Bloomberg
         IP YOY, GDP CYOY INDEX<GO>                                              R2=.76


>>>>>>>>>>>>>>>>>>>>>>>>>>>>>>>>>>>>>>>>>>>>>>>>>>>>>>> SUBSCRIBE @BRIEF<GO> | 28 <<<<
U.S. 2013 Economic Overview and Outlook            Email jbrusuelas3@bloomberg.net or call 212-617-7664


   Excluding Europe Global Manufacturing Rebounds
            65                                                                                               60%


            60
                                                                                                             40%


                                                                                                                    Y/Y Percentage Change (Index)
            55
                                                                                                             20%

            50
    Index


                                                                                                             0%

            45

                                                                                                             -20%
            40


                                                                                                             -40%
            35
                        MSCI World Index (RHS)    US ISM (LHS)                    China PMI (LHS)
                        Euro Zone PMI (LHS)       JP Morgan Global PMI (LHS)
            30                                                                                               -60%
                 2006   2007               2008   2009                2010         2011             2012

    Source: Bloomberg


>>>>>>>>>>>>>>>>>>>>>>>>>>>>>>>>>>>>>>>>>>>>>>>>>>>>>>> SUBSCRIBE @BRIEF<GO> | 29 <<<<
U.S. 2013 Economic Overview and Outlook   Email jbrusuelas3@bloomberg.net or call 212-617-7664


   Financial Conditions Overview
   • Global central banks asset purchase supportive of financial conditions.
   • Improved financial conditions supportive of U.S. and global growth.
   • Credit creation continues to improve.
   • This has not resulted in an increase in monetary velocity.


>>>>>>>>>>>>>>>>>>>>>>>>>>>>>>>>>>>>>>>>>>>>>>>>>>>>>>> SUBSCRIBE @BRIEF<GO> | 30 <<<<
U.S. 2013 Economic Overview and Outlook                             Email jbrusuelas3@bloomberg.net or call 212-617-7664


    Bloomberg Financial Conditions Indices
                    2


                    1


                    0


                    -1
   Index(Z-Score)


                    -2


                    -3


                    -4


                    -5
                            US Financial Conditions Index
                            EU Financial Conditions Index
                    -6
                     2010                                   2011                                 2012                          2013
             Source: Bloomberg                   BFCIUS, BFCIEU INDEX<GO>


>>>>>>>>>>>>>>>>>>>>>>>>>>>>>>>>>>>>>>>>>>>>>>>>>>>>>>> SUBSCRIBE @BRIEF<GO> | 31 <<<<
U.S. 2013 Economic Overview and Outlook                                                      Email jbrusuelas3@bloomberg.net or call 212-617-7664


      Credit Markets Healing
                                                                          Private Credit Creation & Nominal Growth
                                      20%
                                               Nominal GDP

                                               Total Credit Creation Private Financial Instiutions
                                      15%
   Year Over Year Percentage Change


                                      10%


                                      5%


                                      0%


                                      -5%
                                        1962      1967          1972          1977         1982          1987     1992       1997        2002          2007   2012
                                                                                       Adjusted R2=.64
      Source: Federal Reserve, Bloomberg


>>>>>>>>>>>>>>>>>>>>>>>>>>>>>>>>>>>>>>>>>>>>>>>>>>>>>>> SUBSCRIBE @BRIEF<GO> | 32 <<<<
U.S. 2013 Economic Overview and Outlook         Email jbrusuelas3@bloomberg.net or call 212-617-7664


   Credit Markets Healing, Not Translating to Rising Velocity
   2.2
               M2

   2.1


    2


   1.9


   1.8


   1.7


   1.6


   1.5
     1960      1964    1968   1972   1976   1980    1984    1988      1992    1996     2000     2004      2008   2012
   Source: Bloomberg                               VELOM2 INDEX<GO>


>>>>>>>>>>>>>>>>>>>>>>>>>>>>>>>>>>>>>>>>>>>>>>>>>>>>>>> SUBSCRIBE @BRIEF<GO> | 33 <<<<
U.S. 2013 Economic Overview and Outlook     Email jbrusuelas3@bloomberg.net or call 212-617-7664


   Housing Outlook and Overview
   Modest cyclical recovery
   • Recovery in starts driven by demand for multifamily dwellings.
   • Prices stabilization.
   • Some metro-areas experiencing price appreciation.
   Overall housing recovery still years away
   • Mortgages underwater still a concern.


>>>>>>>>>>>>>>>>>>>>>>>>>>>>>>>>>>>>>>>>>>>>>>>>>>>>>>> SUBSCRIBE @BRIEF<GO> | 34 <<<<
U.S. 2013 Economic Overview and Outlook                                                   Email jbrusuelas3@bloomberg.net or call 212-617-7664


   Housing Starts Stabilize
                                  2                                                                                                                       90

                                1.8                                                                                                                       80

                                1.6
                                                                                                                                                          70

                                1.4
   Millions (Annualized Pace)


                                                                                                                                                          60
                                1.2
                                                                                                                                                          50


                                                                                                                                                               Index
                                  1
                                                                                                                                                          40
                                0.8
                                                                                                                                                          30
                                0.6

                                                                                                                                                          20
                                0.4

                                0.2                                                                                                                       10
                                             Single Family Starts          National Association of Homebuilders Index
                                  0                                                                                                                       0
                                      1990    1992         1994     1996     1998        2000       2002        2004    2006    2008      2010     2012

                                Source: Bloomberg                     USHBMIDX, NHSPS1 INDEX<GO>


>>>>>>>>>>>>>>>>>>>>>>>>>>>>>>>>>>>>>>>>>>>>>>>>>>>>>>> SUBSCRIBE @BRIEF<GO> | 35 <<<<
U.S. 2013 Economic Overview and Outlook                    Email jbrusuelas3@bloomberg.net or call 212-617-7664


   Negative and Near Negative Equity Still A Policy Challenge
                                   First Mortgages: Negative and Near Negative Equity
             29


             28


             27


             26


             25                                                                                                    Near Negative
   Percent


                                                                                                                    Equity, 4.7
             24


             23


             22


             21                                                                                             Negative Equity, 22.3


             20
                  Q4'09   Q1'10   Q2'10      Q3'10    Q4'10       Q1'11     Q2'11     Q3'11      Q4'11     Q1'12       Q2'12

    Source: Bloomberg                     NESHNATI, NNSHNATI INDEX<GO>


>>>>>>>>>>>>>>>>>>>>>>>>>>>>>>>>>>>>>>>>>>>>>>>>>>>>>>> SUBSCRIBE @BRIEF<GO> | 36 <<<<
Bloomberg
Joseph Brusuelas,
Senior Economist
Bloomberg, LP
jbrusuelas3@bloomberg.net

Joseph Brusuelas is an economist who writes for the Bloomberg Economic Brief. The observations he makes
are his own. Bloomberg is a leading source of data, news, and analytics for financial and legal
professionals, corporations, media organizations and private individuals around the globe. The
BLOOMBERG PROFESSIONAL® service and Bloomberg’s media services provide real-time and historical
pricing, indicative data, reporting, research, estimates, analytics, portfolio management tools, electronic
trading and order management systems, multimedia events and electronic communications to Bloomberg
clients in more than 150 countries, 24 hours a day.

bloomberg.com
Frankfurt                           London                                    San Francisco                      Singapore                          Tokyo
+49 69 9204 1210                   +44 20 7330 7500                          +1 415 912 2960                   +65 6212 1000                      +81 3 3201 8900

Hong Kong                           New York                                  São Paulo                           Sydney
+852 2977 6000                      +1 212 318 2000                           +55 11 3048 4500                   +61 2 9777 8600


The BLOOMBERG PROFESSIONAL service, BLOOMBERG Data and BLOOMBERG Order Management Systems (the "Services") are owned and distributed locally by Bloomberg Finance L.P. ("BFLP") and its
subsidiaries in all jurisdictions other than Argentina, Bermuda, China, India, Japan and Korea (the "BLP Countries"). BFLP is a wholly-owned subsidiary of Bloomberg L.P. ("BLP"). BLP provides BFLP with all
global marketing and operational support and service for the Services and distributes the Services either directly or through a non-BFLP subsidiary in the BLP Countries. The Services include electronic trading
and order-routing services, which are available only to sophisticated institutional investors and only where the necessary legal clearances have been obtained. BFLP, BLP and their affiliates do not provide
investment advice or guarantee the accuracy of prices or information in the Services. Nothing on the Services shall constitute an offering of financial instruments by BFLP, BLP or their affiliates.
BLOOMBERG, BLOOMBERG PROFESSIONAL, BLOOMBERG MARKETS, BLOOMBERG NEWS, BLOOMBERG ANYWHERE, BLOOMBERG TRADEBOOK, BLOOMBERG BONDTRADER, BLOOMBERG
TELEVISION, BLOOMBERG RADIO, BLOOMBERG PRESS and BLOOMBERG.COM are trademarks and service marks of BFLP, a Delaware limited partnership, or its subsidiaries.

2013 US Economic Outlook - Published by Bloomberg Brief Economics

  • 1.
    Bloomberg BRIEF: Economics U.S.2013 Economic Overview and Outlook Joseph Brusuelas | January 2013
  • 2.
    U.S. 2013 EconomicOverview and Outlook Email jbrusuelas3@bloomberg.net or call 212-617-7664 Executive Summary Politics and Policy To Be Major Determinants of Growth • Fiscal drag to be a major theme in 2013. - Automatic sequestration could increase fiscal drag. • Fed policy designed to address economy caught in liquidity trap. - Fed will continue to purchase assets throughout 2013. • Chances for major tax and fiscal reform are probably remote. >>>>>>>>>>>>>>>>>>>>>>>>>>>>>>>>>>>>>>>>>>>>>>>>>>>>>>> SUBSCRIBE @BRIEF<GO> | 2 <<<<
  • 3.
    U.S. 2013 EconomicOverview and Outlook Email jbrusuelas3@bloomberg.net or call 212-617-7664 Executive Summary Another Year of 2 Percent Growth Likely • Job growth around 150,000 per month with a modest decline in the unemployment rate by end of year. • Growth drivers: energy, housing , manufacturing and improving financial conditions. Risks to the outlook • External Sector: Euro zone and Middle East tensions. • Domestic fiscal policy disputes. • Financial regulation. >>>>>>>>>>>>>>>>>>>>>>>>>>>>>>>>>>>>>>>>>>>>>>>>>>>>>>> SUBSCRIBE @BRIEF<GO> | 3 <<<<
  • 4.
    U.S. 2013 EconomicOverview and Outlook Email jbrusuelas3@bloomberg.net or call 212-617-7664 Jobs and Growth 400 5 200 3 Quarterly Average (Percentage) Quarterly Average (Thousands) 0 1 -200 -1 -400 -3 -600 -5 -800 Real GDP Y/Y (RHS) Total Change in Employment (LHS) -1000 -7 1996 1998 2000 2002 2004 2006 2008 2010 2012 R2=.77 Source: Bloomberg >>>>>>>>>>>>>>>>>>>>>>>>>>>>>>>>>>>>>>>>>>>>>>>>>>>>>>> SUBSCRIBE @BRIEF<GO> | 4 <<<<
  • 5.
    U.S. 2013 EconomicOverview and Outlook Email jbrusuelas3@bloomberg.net or call 212-617-7664 Executive Summary US Economy: Liquidity Trap Prevails • Slow growth and elevated unemployment continue. • Investors have not priced in fiscal drag on growth in first half of 2013. • 10-year rate likely hit high for until second half of year. • Dollar weakness to persist against trade weighted basket of currencies. • Policy debate around debt ceiling and sequestration to economy remains the primary risk to the economic outlook. >>>>>>>>>>>>>>>>>>>>>>>>>>>>>>>>>>>>>>>>>>>>>>>>>>>>>>> SUBSCRIBE @BRIEF<GO> | 5 <<<<
  • 6.
    U.S. 2013 EconomicOverview and Outlook Email jbrusuelas3@bloomberg.net or call 212-617-7664 Mind The Gap US Retains Substantial Output Gap 15 Real GDP Real Potential Output 14 13 Trillions (2005 Chained $) 12 11 10 9 8 7 1990 1992 1994 1996 1998 2000 2002 2004 2006 2008 2010 2012 Source: Bloomberg >>>>>>>>>>>>>>>>>>>>>>>>>>>>>>>>>>>>>>>>>>>>>>>>>>>>>>> SUBSCRIBE @BRIEF<GO> | 6 <<<<
  • 7.
    U.S. 2013 EconomicOverview and Outlook Email jbrusuelas3@bloomberg.net or call 212-617-7664 Labor Market Slack Persists 58 11 Employment to Population Ratio (LHS) Unemployment Rate (RHS, Inverted) 10 59 9 60 8 61 Percent Percent 7 62 6 63 5 64 4 65 3 1990 1992 1994 1996 1998 2000 2002 2004 2006 2008 2010 2012 Source: Bloomberg USERTOT , USURTOT INDEX<GO> >>>>>>>>>>>>>>>>>>>>>>>>>>>>>>>>>>>>>>>>>>>>>>>>>>>>>>> SUBSCRIBE @BRIEF<GO> | 7 <<<<
  • 8.
    U.S. 2013 EconomicOverview and Outlook Email jbrusuelas3@bloomberg.net or call 212-617-7664 Real Consumption on Lower Trend 11000 10500 Real PCE Trend Prior to Recession Billions (Chained 2005 $) 10000 9500 9000 8500 8000 2005 2006 2007 2008 2009 2010 2011 2012 Source: Bloomberg US.HHSPNR BEA INDEX<GO> >>>>>>>>>>>>>>>>>>>>>>>>>>>>>>>>>>>>>>>>>>>>>>>>>>>>>>> SUBSCRIBE @BRIEF<GO> | 8 <<<<
  • 9.
    U.S. 2013 EconomicOverview and Outlook Email jbrusuelas3@bloomberg.net or call 212-617-7664 Cyclical Growth Outlook Core Scenario: Below Trend (2.5 percent) Growth • Liquidity Trap Defines Business Cycle. • Liquidity injections into banking system have failed to stimulate growth and employment back to trend. • Monetary policy targeting liquidity trap. • Policy gridlock offers no fiscal relief. >>>>>>>>>>>>>>>>>>>>>>>>>>>>>>>>>>>>>>>>>>>>>>>>>>>>>>> SUBSCRIBE @BRIEF<GO> | 9 <<<<
  • 10.
    U.S. 2013 EconomicOverview and Outlook Email jbrusuelas3@bloomberg.net or call 212-617-7664 Cyclical Growth Outlook Structural adjustment to growth model and labor market continues. • Moving away from overconsumption based on easy credit. • Growth: 2.2 percent cyclical growth average. • Consumption: 1.5 percent cyclical growth average. • Diversification of growth drivers. • Elevated unemployment likely to persist. • Public and private deleveraging continues. >>>>>>>>>>>>>>>>>>>>>>>>>>>>>>>>>>>>>>>>>>>>>>>>>>>>>>> SUBSCRIBE @BRIEF<GO> | 10 <<<<
  • 11.
    U.S. 2013 EconomicOverview and Outlook Email jbrusuelas3@bloomberg.net or call 212-617-7664 Cyclical Growth Outlook Alternative Scenario: Cyclical Outperformance • Long term tax and fiscal reform. • Sustainable increase in corporate and consumer confidence. • Domestic corporations deploy. • Growth and hiring move back toward long term trends. • Rising rates and inflation. >>>>>>>>>>>>>>>>>>>>>>>>>>>>>>>>>>>>>>>>>>>>>>>>>>>>>>> SUBSCRIBE @BRIEF<GO> | 11 <<<<
  • 12.
    U.S. 2013 EconomicOverview and Outlook Email jbrusuelas3@bloomberg.net or call 212-617-7664 Bloomberg Consensus: Survey of Forecasters Q4 12 Q1 13 Q2 13 Q3 13 Q4 13 Real GDP 1.40% 1.60% 2.10% 2.50% 2.80% CPI 2.0% 1.70% 2.0% 1.90% 2.10% Core PCE 1.70% 1.60% 1.60% 1.70% 1.80% Unemployment 7.83% 7.80% 7.80% 7.70% 7.50% Central Bank Rate 0.25% 0.25% 0.25% 0.25% 0.25% 2-Year Rate 0.25% 0.26% 0.29% 0.34% 0.41% 10-Year Rate 1.76% 1.76% 1.86% 1.99% 2.14% EUR/USD $1.32 $1.29 $1.28 $1.27 $1.27 >>>>>>>>>>>>>>>>>>>>>>>>>>>>>>>>>>>>>>>>>>>>>>>>>>>>>>> SUBSCRIBE @BRIEF<GO> | 12 <<<<
  • 13.
    U.S. 2013 EconomicOverview and Outlook Email jbrusuelas3@bloomberg.net or call 212-617-7664 Slow Growth Likely to Define 2013 65.0 6.0 5.0 60.0 4.0 3.0 GDP Y/Y Percentage Change Index (Quarterly Average) 55.0 2.0 1.0 50.0 0.0 -1.0 45.0 -2.0 -3.0 40.0 -4.0 ISM Manufacturing Survey (LHS) Weighted ISM Manufacturing & Non-Man (LHS) -5.0 GDP Y/Y (RHS) 35.0 -6.0 1998 2000 2002 2004 2006 2008 2010 2012 Source: Bloomberg NAPMPMI, GDP CYOY INDEX<GO> >>>>>>>>>>>>>>>>>>>>>>>>>>>>>>>>>>>>>>>>>>>>>>>>>>>>>>> SUBSCRIBE @BRIEF<GO> | 13 <<<<
  • 14.
    U.S. 2013 EconomicOverview and Outlook Email jbrusuelas3@bloomberg.net or call 212-617-7664 Low Wage Bias in Hiring 150 125 100 75 Thousands 50 25 0 -25 Leisure and Hospitality Health Care and Social Assistance Temp Retail Trade -50 2010 2011 2012 Source: Bloomberg USRTTOT, USESTEMP, USEETOTS, USEHTOTS INDEX<GO> >>>>>>>>>>>>>>>>>>>>>>>>>>>>>>>>>>>>>>>>>>>>>>>>>>>>>>> SUBSCRIBE @BRIEF<GO> | 14 <<<<
  • 15.
    U.S. 2013 EconomicOverview and Outlook Email jbrusuelas3@bloomberg.net or call 212-617-7664 Real Consumption and Consumer Confidence 120 8 110 6 Year Over Year Percentage Change 100 4 90 Index 2 80 0 70 -2 60 University of Michigan Consumer Sentiment Real Personal Consumption 50 -4 1996 1998 2000 2002 2004 2006 2008 2010 2012 PCE CHY%, CONSSENT INDEX<GO> Source: Bloomberg >>>>>>>>>>>>>>>>>>>>>>>>>>>>>>>>>>>>>>>>>>>>>>>>>>>>>>> SUBSCRIBE @BRIEF<GO> | 15 <<<<
  • 16.
    U.S. 2013 EconomicOverview and Outlook Email jbrusuelas3@bloomberg.net or call 212-617-7664 Central Bank Policy Outlook and Overview Fed will likely remain on hold throughout 2013 • Forward guidance to remain unchanged. • Asset purchase to remain in place, then slow in 2014. . >>>>>>>>>>>>>>>>>>>>>>>>>>>>>>>>>>>>>>>>>>>>>>>>>>>>>>> SUBSCRIBE @BRIEF<GO> | 16 <<<<
  • 17.
    U.S. 2013 EconomicOverview and Outlook Email jbrusuelas3@bloomberg.net or call 212-617-7664 Central Bank Policy Outlook and Overview • Aggressive action to unclog monetary transmission mechanism to remain in place through 2013. • Balance sheet likely to expand to $4 trillion by end of 2013. • If policy does not gain traction, Fed will begin to create conditions for targeting of nominal GDP. >>>>>>>>>>>>>>>>>>>>>>>>>>>>>>>>>>>>>>>>>>>>>>>>>>>>>>> SUBSCRIBE @BRIEF<GO> | 17 <<<<
  • 18.
    U.S. 2013 EconomicOverview and Outlook Email jbrusuelas3@bloomberg.net or call 212-617-7664 Central Bank Policy Outlook and Overview Five C’s of U.S. Monetary Policy • Communications • Commitment • Conditionality • Composition • Credibility >>>>>>>>>>>>>>>>>>>>>>>>>>>>>>>>>>>>>>>>>>>>>>>>>>>>>>> SUBSCRIBE @BRIEF<GO> | 18 <<<<
  • 19.
    U.S. 2013 EconomicOverview and Outlook Email jbrusuelas3@bloomberg.net or call 212-617-7664 The Long Road Ahead Slow Grind Back To Full Employment Scenario 1: Structural Break Scenario 2: Cyclical Recovery 7% NAIRU 7% NAIRU 5.5% NAIRU 5.5% NAIRU Monthly Job Gains 150,000 150,000 150,000 150,000 Labor Force Participation Rate 63.50% 63.50% 63.50% 63.50% Average Annual Population Growth 0.92% 0.50% 0.92% 0.50% Years to Full Employment 3 Years 1.5 Years 7 Years 4 Years >>>>>>>>>>>>>>>>>>>>>>>>>>>>>>>>>>>>>>>>>>>>>>>>>>>>>>> SUBSCRIBE @BRIEF<GO> | 19 <<<<
  • 20.
    U.S. 2013 EconomicOverview and Outlook Email jbrusuelas3@bloomberg.net or call 212-617-7664 Mortgage Backed Primary Secondary Spread 180 Fed MBS Purchase Program Starts 160 140 Basis Points 120 100 Mortgage Backed Primary-Secondary Spread 80 Jan-12 Feb-12 Mar-12 Apr-12 May-12 Jun-12 Jul-12 Aug-12 Sep-12 Oct-12 Nov-12 Dec-12 Jan-13 Source: Bloomberg ILM3NAVG, MTGEFNCL INDEX<GO> >>>>>>>>>>>>>>>>>>>>>>>>>>>>>>>>>>>>>>>>>>>>>>>>>>>>>>> SUBSCRIBE @BRIEF<GO> | 20 <<<<
  • 21.
    U.S. 2013 EconomicOverview and Outlook Email jbrusuelas3@bloomberg.net or call 212-617-7664 Monetary Policy at the Zero Bound Taylor Rule & Evans Rule Estimates of the Fed Funds Rates 8 6 Taylor Rule Estinates Fed Funds Rate 4 2 Percentage 0 Evans Rule -2 Estimates -4 -6 -8 -10 2007 2008 2009 2010 2011 2012 2013 2014 2015 Source: Bloomberg USFEDL01, PCE CYOY, USURTOT INDEX<GO> >>>>>>>>>>>>>>>>>>>>>>>>>>>>>>>>>>>>>>>>>>>>>>>>>>>>>>> SUBSCRIBE @BRIEF<GO> | 21 <<<<
  • 22.
    U.S. 2013 EconomicOverview and Outlook Email jbrusuelas3@bloomberg.net or call 212-617-7664 Rate Outlook U.S. 10-Year likely posted highs for first half of 2013 • Forward looking rates indicated Fed policy to continue to suppress curve. • Slower spending, followed by slow growth and modest deceleration in hiring mid year. • Expect move back toward 1.50 on 10-year due to weak January data. • Long term rates should trade in range between 1.50 and 2 percent. • Risks to the outlook: - Acceleration in demand from external sector bolsters growth prospects. - Gains in labor market and housing offset fiscal drag. - Premature exit by Fed from asset purchase program. >>>>>>>>>>>>>>>>>>>>>>>>>>>>>>>>>>>>>>>>>>>>>>>>>>>>>>> SUBSCRIBE @BRIEF<GO> | 22 <<<<
  • 23.
    U.S. 2013 EconomicOverview and Outlook Email jbrusuelas3@bloomberg.net or call 212-617-7664 Image page U.S. Rates Overview Bloomberg consensus forecast indicates higher 10- and 30-year rates. Fed Asset Purchases Likely to continue near $85 billion per month. Current Rates: • 2-Year: .41 percent • 10-year: 2.14 percent • 30-year: 3.26 percent Fourth Quarter Consensus Survey Rate Forecast: • 2-Year: .26 percent • 10-year: 1.90 percent • 30-year: 3.10 percent >>>>>>>>>>>>>>>>>>>>>>>>>>>>>>>>>>>>>>>>>>>>>>>>>>>>>>> SUBSCRIBE @BRIEF<GO> | 23 <<<<
  • 24.
    U.S. 2013 EconomicOverview and Outlook Email jbrusuelas3@bloomberg.net or call 212-617-7664 Projected Path of Long- and Short-Term Rates 4.50 4.00 3.50 3.00 2.50 Percent 2.00 1.50 1.00 0.50 US 10-Year (LHS) 3-Month, 2-Year Forward (RHS) 0.00 Jan-08 Jan-09 Jan-10 Jan-11 Jan-12 Jan-13 Source: Bloomberg USGG10YR INDEX, G0025 2Y3M BLC2CURNCY<GO> >>>>>>>>>>>>>>>>>>>>>>>>>>>>>>>>>>>>>>>>>>>>>>>>>>>>>>> SUBSCRIBE @BRIEF<GO> | 24 <<<<
  • 25.
    U.S. 2013 EconomicOverview and Outlook Email jbrusuelas3@bloomberg.net or call 212-617-7664 FX Overview Dollar appreciation versus euro- and-trade weighted basket of currencies eases: • Global central bank policy will drive foreign exchange valuations. • Competitive quantitative easing manage currency competition among highly indebted industrialized states. • USD depreciation against a broader trade weighted based of currencies. • Winners - AUD - CAD - BRL - MXN >>>>>>>>>>>>>>>>>>>>>>>>>>>>>>>>>>>>>>>>>>>>>>>>>>>>>>> SUBSCRIBE @BRIEF<GO> | 25 <<<<
  • 26.
    U.S. 2013 EconomicOverview and Outlook Email jbrusuelas3@bloomberg.net or call 212-617-7664 Dollar Depreciation Likely to Continue 115 QE 1 Begins QE 2 QE 3 110 105 Index 100 95 Real Trade Weighted Broad Dollar Index 90 2006 2007 2008 2009 2010 2011 2012 2013 Source: Bloomberg USTWBROA INDEX<GO> >>>>>>>>>>>>>>>>>>>>>>>>>>>>>>>>>>>>>>>>>>>>>>>>>>>>>>> SUBSCRIBE @BRIEF<GO> | 26 <<<<
  • 27.
    U.S. 2013 EconomicOverview and Outlook Email jbrusuelas3@bloomberg.net or call 212-617-7664 Image page U.S. Manufacturing Outlook Manufacturing growth stabilizes • Rise in capital expenditures following resolution of - Automatic sequestration. - Debt ceiling. - Auto production leads modest growth in manufacturing. o Rebuilding of auto stock following Hurricane Sandy. o 250,000 autos destroyed by storm. External Demand Rebounds • Modest support for U.S. growth picture. • European recession. • China bounce in second half of 2013. >>>>>>>>>>>>>>>>>>>>>>>>>>>>>>>>>>>>>>>>>>>>>>>>>>>>>>> SUBSCRIBE @BRIEF<GO> | 27 <<<<
  • 28.
    U.S. 2013 EconomicOverview and Outlook Email jbrusuelas3@bloomberg.net or call 212-617-7664 Industrial Production and Growth 6.0 10.0 5.0 Y/Y Percentage Change (Quarterly Average) 4.0 5.0 3.0 Y/Y Percentage Change 2.0 0.0 1.0 0.0 -5.0 -1.0 -2.0 -10.0 -3.0 -4.0 GDP CYOY (LHS) Industrial Production (RHS) -5.0 -15.0 1996 1998 2000 2002 2004 2006 2008 2010 2012 Source: Bloomberg IP YOY, GDP CYOY INDEX<GO> R2=.76 >>>>>>>>>>>>>>>>>>>>>>>>>>>>>>>>>>>>>>>>>>>>>>>>>>>>>>> SUBSCRIBE @BRIEF<GO> | 28 <<<<
  • 29.
    U.S. 2013 EconomicOverview and Outlook Email jbrusuelas3@bloomberg.net or call 212-617-7664 Excluding Europe Global Manufacturing Rebounds 65 60% 60 40% Y/Y Percentage Change (Index) 55 20% 50 Index 0% 45 -20% 40 -40% 35 MSCI World Index (RHS) US ISM (LHS) China PMI (LHS) Euro Zone PMI (LHS) JP Morgan Global PMI (LHS) 30 -60% 2006 2007 2008 2009 2010 2011 2012 Source: Bloomberg >>>>>>>>>>>>>>>>>>>>>>>>>>>>>>>>>>>>>>>>>>>>>>>>>>>>>>> SUBSCRIBE @BRIEF<GO> | 29 <<<<
  • 30.
    U.S. 2013 EconomicOverview and Outlook Email jbrusuelas3@bloomberg.net or call 212-617-7664 Financial Conditions Overview • Global central banks asset purchase supportive of financial conditions. • Improved financial conditions supportive of U.S. and global growth. • Credit creation continues to improve. • This has not resulted in an increase in monetary velocity. >>>>>>>>>>>>>>>>>>>>>>>>>>>>>>>>>>>>>>>>>>>>>>>>>>>>>>> SUBSCRIBE @BRIEF<GO> | 30 <<<<
  • 31.
    U.S. 2013 EconomicOverview and Outlook Email jbrusuelas3@bloomberg.net or call 212-617-7664 Bloomberg Financial Conditions Indices 2 1 0 -1 Index(Z-Score) -2 -3 -4 -5 US Financial Conditions Index EU Financial Conditions Index -6 2010 2011 2012 2013 Source: Bloomberg BFCIUS, BFCIEU INDEX<GO> >>>>>>>>>>>>>>>>>>>>>>>>>>>>>>>>>>>>>>>>>>>>>>>>>>>>>>> SUBSCRIBE @BRIEF<GO> | 31 <<<<
  • 32.
    U.S. 2013 EconomicOverview and Outlook Email jbrusuelas3@bloomberg.net or call 212-617-7664 Credit Markets Healing Private Credit Creation & Nominal Growth 20% Nominal GDP Total Credit Creation Private Financial Instiutions 15% Year Over Year Percentage Change 10% 5% 0% -5% 1962 1967 1972 1977 1982 1987 1992 1997 2002 2007 2012 Adjusted R2=.64 Source: Federal Reserve, Bloomberg >>>>>>>>>>>>>>>>>>>>>>>>>>>>>>>>>>>>>>>>>>>>>>>>>>>>>>> SUBSCRIBE @BRIEF<GO> | 32 <<<<
  • 33.
    U.S. 2013 EconomicOverview and Outlook Email jbrusuelas3@bloomberg.net or call 212-617-7664 Credit Markets Healing, Not Translating to Rising Velocity 2.2 M2 2.1 2 1.9 1.8 1.7 1.6 1.5 1960 1964 1968 1972 1976 1980 1984 1988 1992 1996 2000 2004 2008 2012 Source: Bloomberg VELOM2 INDEX<GO> >>>>>>>>>>>>>>>>>>>>>>>>>>>>>>>>>>>>>>>>>>>>>>>>>>>>>>> SUBSCRIBE @BRIEF<GO> | 33 <<<<
  • 34.
    U.S. 2013 EconomicOverview and Outlook Email jbrusuelas3@bloomberg.net or call 212-617-7664 Housing Outlook and Overview Modest cyclical recovery • Recovery in starts driven by demand for multifamily dwellings. • Prices stabilization. • Some metro-areas experiencing price appreciation. Overall housing recovery still years away • Mortgages underwater still a concern. >>>>>>>>>>>>>>>>>>>>>>>>>>>>>>>>>>>>>>>>>>>>>>>>>>>>>>> SUBSCRIBE @BRIEF<GO> | 34 <<<<
  • 35.
    U.S. 2013 EconomicOverview and Outlook Email jbrusuelas3@bloomberg.net or call 212-617-7664 Housing Starts Stabilize 2 90 1.8 80 1.6 70 1.4 Millions (Annualized Pace) 60 1.2 50 Index 1 40 0.8 30 0.6 20 0.4 0.2 10 Single Family Starts National Association of Homebuilders Index 0 0 1990 1992 1994 1996 1998 2000 2002 2004 2006 2008 2010 2012 Source: Bloomberg USHBMIDX, NHSPS1 INDEX<GO> >>>>>>>>>>>>>>>>>>>>>>>>>>>>>>>>>>>>>>>>>>>>>>>>>>>>>>> SUBSCRIBE @BRIEF<GO> | 35 <<<<
  • 36.
    U.S. 2013 EconomicOverview and Outlook Email jbrusuelas3@bloomberg.net or call 212-617-7664 Negative and Near Negative Equity Still A Policy Challenge First Mortgages: Negative and Near Negative Equity 29 28 27 26 25 Near Negative Percent Equity, 4.7 24 23 22 21 Negative Equity, 22.3 20 Q4'09 Q1'10 Q2'10 Q3'10 Q4'10 Q1'11 Q2'11 Q3'11 Q4'11 Q1'12 Q2'12 Source: Bloomberg NESHNATI, NNSHNATI INDEX<GO> >>>>>>>>>>>>>>>>>>>>>>>>>>>>>>>>>>>>>>>>>>>>>>>>>>>>>>> SUBSCRIBE @BRIEF<GO> | 36 <<<<
  • 37.
    Bloomberg Joseph Brusuelas, Senior Economist Bloomberg,LP jbrusuelas3@bloomberg.net Joseph Brusuelas is an economist who writes for the Bloomberg Economic Brief. The observations he makes are his own. Bloomberg is a leading source of data, news, and analytics for financial and legal professionals, corporations, media organizations and private individuals around the globe. The BLOOMBERG PROFESSIONAL® service and Bloomberg’s media services provide real-time and historical pricing, indicative data, reporting, research, estimates, analytics, portfolio management tools, electronic trading and order management systems, multimedia events and electronic communications to Bloomberg clients in more than 150 countries, 24 hours a day. bloomberg.com Frankfurt London San Francisco Singapore Tokyo +49 69 9204 1210 +44 20 7330 7500 +1 415 912 2960 +65 6212 1000 +81 3 3201 8900 Hong Kong New York São Paulo Sydney +852 2977 6000 +1 212 318 2000 +55 11 3048 4500 +61 2 9777 8600 The BLOOMBERG PROFESSIONAL service, BLOOMBERG Data and BLOOMBERG Order Management Systems (the "Services") are owned and distributed locally by Bloomberg Finance L.P. ("BFLP") and its subsidiaries in all jurisdictions other than Argentina, Bermuda, China, India, Japan and Korea (the "BLP Countries"). BFLP is a wholly-owned subsidiary of Bloomberg L.P. ("BLP"). BLP provides BFLP with all global marketing and operational support and service for the Services and distributes the Services either directly or through a non-BFLP subsidiary in the BLP Countries. The Services include electronic trading and order-routing services, which are available only to sophisticated institutional investors and only where the necessary legal clearances have been obtained. BFLP, BLP and their affiliates do not provide investment advice or guarantee the accuracy of prices or information in the Services. Nothing on the Services shall constitute an offering of financial instruments by BFLP, BLP or their affiliates. BLOOMBERG, BLOOMBERG PROFESSIONAL, BLOOMBERG MARKETS, BLOOMBERG NEWS, BLOOMBERG ANYWHERE, BLOOMBERG TRADEBOOK, BLOOMBERG BONDTRADER, BLOOMBERG TELEVISION, BLOOMBERG RADIO, BLOOMBERG PRESS and BLOOMBERG.COM are trademarks and service marks of BFLP, a Delaware limited partnership, or its subsidiaries.