ANOVA is a hypothesis testing technique used to compare the equality of means for two or more groups; for example, it can be used to test that the mean number of computer chips produced by a company on each of the day, evening, and night shifts is the same. Give an example of an application of ANOVA in an industrial, operations, or manufacturing setting that is different from the examples provided in the overview. Discuss and share this information with your classmates.
In responding to your peers, select responses that use an ANOVA application that is different from your own. Are the results of the ANOVA application statistically significant? Why are the results significant or not significant? Explain your reasoning. Consider how ANOVA could be applied to the final project case study.
Support your initial posts and response posts with scholarly sources cited in APA style.
https://statistics4beginners.wordpress.com/2015/02/18/how-to-calculate-anova-in-excel-2013/
PLEASE GIVE A 1-2 PARAGRAPH RESPONSE TO THE FOLLOWING:
1.
In this module, our goal is to learn the statistical process of comparing several population means through a procedure called "analysis of variance", or ANOVA. ANOVA uses the variance from the mean of 2 or more sample populations to see if there is a statistically significant difference between them (Sharpe, DeVeaux, Velleman, 2016). We've learned that this is a valuable tool in all sorts of areas of study, including automotive, chemical, and medical industries.
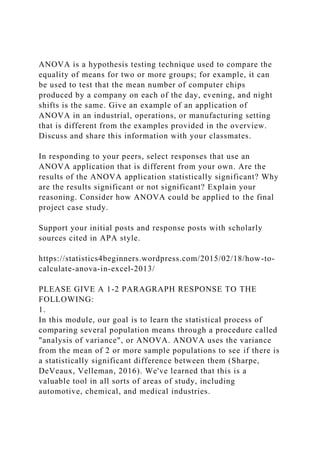
There are many practical examples of ANOVA throughout business. As previously mentioned, the medical field can benefit from the use of this statistics tool. For example, a drug company may be interested in the results of clinical trials for a few new drugs they plan to release. Medicine A, B, and C are all now in the clinical testing phase, so the instances in which each cures a specific ailment can be summed up using ANOVA. Each of the individual drugs, through the course of multiple trials, will have a number of "cured" patients. The following is an example of what the results may be, in table format:
A B C
Trial 1 4 9 2
2 5 8 7
3 7 1 6
4 6 1 5
5 6 4 9
Using ANOVA to evaluate the variance from the mean for each trial, the ultimate goal would be to compare each trial to one another. By comparing the variance, we can say, with statistical confidence, that one medicine may be more effect.
Building solid marketing strategies in today’s competitive market is impossible without sound market research. The right market information can boost your sales, position your product more effectively, and help you speak more effectively to your audience.
Reinforce and focus your marketing research skills. This highly interactive program, facilitated by an experienced marketing research professional, can provide you with the knowledge and tools you need to develop and manage research projects to meet your specific goals. Furthermore, the workshop debunks the myth that you have to spend a lot of money to gain valuable information for decision making. No prior marketing research experience is required!
1. Click here to retrieve the Risk Management Template. Working wi.docxjackiewalcutt
1. Click here to retrieve the Risk Management Template. Working with the RFP you have selected and this template create a risk matrix and management plan for your project.
The Risk Management Template is filled out so you can see the level of detail needed. This template must be tailored to your specific project and presented as if you are giving this to your client, which means uniform font, color, graphics and a professional look.
The document should include a title page, verbiage on why risk management is important to your selected project and how it relates to the project (two to three paragraphs), the modified risk table, and a conclusion.
· Each risk must be scored, and mitigation plans must be outlined in detail.
· Each risk must be ranked, and therefore, the highest risk items should be on top: red, yellow, green in order.
Listing at least 10-15 risks is appropriate.
Unit VI Mini Project
Value Creation
Sellers create value for buyers in the form of providing leading edge technology, state of the art products, timely services, ease of buying, and quality of relationships, services, and products. These values are usually related to company finances (but not for all criteria, as compliance, safety, and other factors can be considered). Sellers will create value for you as the buyer, given the RFP you have selected, and then in turn you will create value for your buyer (client).
Taking into considerations the RFP you have selected to work with during this course, answer the following two questions in detail. Submit this assignment as one comprehensive MS Word document of no less than 200 words.
1. What are the most important value add criteria your sellers can provide you in order to make your project a success?
2. In turn, what value will you provide to your clients? Why should your clients select you as their future vendor?
Unit VII Mini Project
CMROAT
Use the RFP you have selected to work with during this course. Given the following list of possible risks/opportunities, name four that come into play, and give details about how each of the four you selected can impact the RFP (risks and opportunities) you have selected if it were to be a real project. How can these risks be mitigated? How can the opportunities (if any) be used to improve the project and procurement relationship? Submit this assignment as one comprehensive MS Word document of no less than 500 words.
· Budget
· Schedule
· Seller Experience
· Quality
· Technology
· Geography (location of buyer, seller, associates)
· Financial
· Strategic Direction (for both buyer and seller)
At the end of the course, a final procurement plan is due (the Procurement Plan Template is accessible from Syllabus Unit VIII Course Project below). Please take the time to begin working on this during Unit VII so you have enough time to complete it by the end of the official course date. This is a detailed document relating to the RFP you have selected.
BBA ...
Between Black and White Population1. Comparing annual percent .docxjasoninnes20
Between Black and White Population
1. Comparing annual percent of Medicare enrollees having at least one ambulatory visit between B and W
2. Comparing average annual percent of diabetic Medicare enrollees age 65-75 having hemoglobin A1c between B and W
3. Comparing average annual percent of diabetic Medicare enrollees age 65-75 having eye examination between B and W
4. Comparing average annual percent of diabetic Medicare enrollees age 65-75 having
Students will develop an analysis report, in five main sections, including introduction, research method (research questions/objective, data set, research method, and analysis), results, conclusion and health policy recommendations. This is a 5-6 page individual project report.
Here are the main steps for this assignment.
Step 1: Students require to submit the topic using topic selection discussion forum by the end of week 1 and wait for instructor approval.
Step 2: Develop the research question and
Step 3: Run the analysis using EXCEL (RStudio for BONUS points) and report the findings using the assignment instruction.
The Report Structure:
Start with the
1.Cover page (1 page, including running head).
Please look at the example http://www.apastyle.org/manual/related/sample-experiment-paper-1.pdf (you can download the file from the class) and http://www.umuc.edu/library/libhow/apa_tutorial.cfm to learn more about the APA style.
In the title page include:
· Title, this is the approved topic by your instructor.
· Student name
· Class name
· Instructor name
· Date
2.Introduction
Introduce the problem or topic being investigated. Include relevant background information, for example;
· Indicates why this is an issue or topic worth researching;
· Highlight how others have researched this topic or issue (whether quantitatively or qualitatively), and
· Specify how others have operationalized this concept and measured these phenomena
Note: Introduction should not be more than one or two paragraphs.
Literature Review
There is no need for a literature review in this assignment
3.Research Question or Research Hypothesis
What is the Research Question or Research Hypothesis?
***Just in time information: Here are a few points for Research Question or Research Hypothesis
There are basically two kinds of research questions: testable and non-testable. Neither is better than the other, and both have a place in applied research.
Examples of non-testable questions are:
How do managers feel about the reorganization?
What do residents feel are the most important problems facing the community?
Respondents' answers to these questions could be summarized in descriptive tables and the results might be extremely valuable to administrators and planners. Business and social science researchers often ask non-testable research questions. The shortcoming with these types of questions is that they do not provide objective cut-off points for decision-makers.
In order to overcome this problem, researchers often seek to answer o ...
About Your Signature Assignment.docxAbout Your Signature Assig.docxransayo
About Your Signature Assignment.docx
About Your Signature Assignment – Due Monday, 20-November
This signature assignment is designed to align with specific program student learning outcome(s) in your program. Program Student Learning Outcomes are broad statements that describe what students should know and be able to do upon completion of their degree. The signature assignments might be graded with an automated rubric that allows the University to collect data that can be aggregated across a location or college/school and used for program improvements.
Purpose of Assignment
The purpose of this assignment is for students to synthesize the concepts learned throughout the course. This assignment will provide students an opportunity to build critical thinking skills, develop businesses and organizations, and solve problems requiring data by compiling all pertinent information into one report.
Assignment Steps
Resources: Microsoft Excel®, Signature Assignment Databases, Signature Assignment Options, Part 3: Inferential Statistics
Scenario: Upon successful completion of the MBA program, say you work in the analytics department for a consulting company. Your assignment is to analyze one of the following databases:
· Manufacturing
· Hospital
· Consumer Food
· Financial
Select one of the databases based on the information in the Signature Assignment Options.
Provide a 1,600-word detailed, statistical report including the following:
· Explain the context of the case
· Provide a research foundation for the topic
· Present graphs
· Explain outliers
· Prepare calculations
· Conduct hypotheses tests
· Discuss inferences you have made from the results
This assignment is broken down into four parts:
· Part 1 - Preliminary Analysis
· Part 2 - Examination of Descriptive Statistics
· Part 3 - Examination of Inferential Statistics
· Part 4 - Conclusion/Recommendations
Part 1 - Preliminary Analysis (3-4 paragraphs)
Generally, as a statistics consultant, you will be given a problem and data. At times, you may have to gather additional data. For this assignment, assume all the data is already gathered for you.
State the objective:
· What are the questions you are trying to address?
Describe the population in the study clearly and in sufficient detail:
· What is the sample?
Discuss the types of data and variables:
· Are the data quantitative or qualitative?
· What are levels of measurement for the data?
Part 2 - Descriptive Statistics (3-4 paragraphs)
Examine the given data.
Present the descriptive statistics (mean, median, mode, range, standard deviation, variance, CV, and five-number summary).
Identify any outliers in the data.
Present any graphs or charts you think are appropriate for the data.
Note: Ideally, we want to assess the conditions of normality too. However, for the purpose of this exercise, assume data is drawn from normal populations.
Part 3 - Inferential Statistics (2-3 paragraphs)
Use the Part 3: Inferential Statistics document.
· Create (f.
Answer the questions below, following the Submission Requirements .docxjustine1simpson78276
Answer the questions below, following the Submission Requirements as specified at the end of the assessment.
Assessment Concepts
Question
Concept
Question 1
SPSS: One-Variable Chi Square
Question 2
SPSS: One-Variable Chi Square
Question 3
Chi-Square as a Test of Independence
Question 4
SPSS: Two-Variable Chi-Square
Question 5
Measures of Effect Size
Question 6
Power and the Factors Affecting It
Question 7
Power and the Factors Affecting It
Question 8
Correlational Studies
Question 9
Correlation: Relationship Direction
Question 10
SPSS: Scatterplot
Question 11
SPSS: Pearson r
Question 12
SPSS: Pearson r
Question 1
Complete the following steps:
1. Open the SPSS file assessment5a.sav linked in the Resources under the Required Resources heading.
2. At the top of the screen, click on Data, then select Weight Cases.
3. Click on Weight Cases By, click on Count, then click on the arrow next to Frequency Variable to send it over to the Test Variable box.
4. On the toolbar, click Analyze, then Nonparametric Tests, then Legacy Dialogs, the Chi Square.
5. Click on Favorite Color, then click on the arrow to send to the Test Variable List window.
6. Under Expected Values, select Value, then enter the following four values in order: 43, 58, 253, 414.
7. Click OK and copy and paste the output to your Word document.
Question 2
There are 218 first graders in an elementary school. Of these first graders, 86 are boys, and 132 are girls. School-wide, there are 753 boys and 1063 girls. The principal would like to know if the gender ratio in first grade reflects the gender ratio across the school.
Complete the following:
1. Identify the null hypothesis.
2. What are the degrees of freedom (df)?
3. Complete the table (complete in SPSS and paste the output into your Word document):
Question 2
Men
Women
Number Observed
Number Expected
Number Observed
Number Expected
4. Calculate χ² in SPSS and paste the output into your Word document.
5. Can you reject the null hypothesis at α = .05?
Question 3
You recently read a magazine article stating that professionals who attended college online tend to earn higher salaries than professionals who attended brick-and-mortar universities. Identify this study's two variables.
Question 4
Complete the following steps:
1. Open the SPSS file assessment5b.sav linked in the Resources under the Required Resources heading.
2. At the top of the screen, click on Data, then select Weight Cases.
3. Click on Weight Cases By, click on Count, then click on the arrow next to Frequency Variable to send it over to the Test Variable box.
4. On the toolbar, click Analyze, then Descriptive Statistics, then Crosstabs.
5. Click on Team Placement, then click on the arrow to send to the Rows window.
6. Click on Gender, then click on the arrow to send to the Columns window.
7. Click on the Statistics button, then check the box for Chi-Square. Click Continue.
8. Click on the Cells button, then check the box for Expected. Click Continue.
9. Click OK, and.
Assignment 2 RA Annotated BibliographyIn your final paper for .docxjosephinepaterson7611
Assignment 2: RA: Annotated Bibliography
In your final paper for this course, you will need to write a Methods section that is about 3–4 pages long where you will assess and evaluate the methods and analysis of your proposed research.
In preparation for this particular section, answer the following questions thoroughly and provide justification/support. The more complete and detailed your answers for these questions, the better prepared you are to successfully write your final paper:
· What is the problem being addressed by your research study?
· State the refined research question and hypothesis (null and alternative).
· What are your independent and dependent variables? What are their operational definitions?
· Who will be included in your sample (i.e., inclusion and exclusion characteristics)?
· How many participants will you have in your sample?
· How will you recruit your sample?
· Identify the type of measurement instrument to be used to collect the raw numeric data to be statistically analyzed and the type of measurement data the instrument produces.
· What issues will you cover in the informed consent?
· If there is potential risk or harm, how will you ensure the safety of all participants?
· Name any possible threats to validity and steps that can be taken to minimize these threats.
· What type of parametric or nonparametric inferential statistical process (correlation, difference, or effect) will you use in your proposed research? Why is this statistical test the best fit?
· State an acceptable behavioral research alpha level you would use to fail to accept or fail to reject the stated null hypothesis and explain your choice.
This paper may be written in question-and-answer format rather than a flowing paper. Write your response in a 3- to 4-page Microsoft Word document.
All written assignments and responses should follow APA rules for attributing sources.
Submission Details:
· By the due date assigned, save your document as M4_A2_Lastname_Firstname.doc and submit it to the Submissions Area .
Assignment 2 Grading Criteria
Maximum Points
Stated the problem being addressed.
8
Stated the refined research question and hypothesis (null and alternative).
6
Stated the independent and dependent variables and provided the operational definitions.
12
Discussed sample characteristics and size.
8
Discussed a sample recruitment strategy.
6
Identified the type of measurement instrument to be used and the type of measurement data the instrument produces.
8
Discussed the informed consent and potential risk and protection factors.
12
Named the possible threats to validity and steps that can be taken to minimize these threats.
12
Discussed the type of parametric or nonparametric inferential statistical process that will be used and why it is a best fit.
8
Stated an acceptable behavioral research alpha level for analyzing the data.
4
Wrote in a clear, concise, and organized manner; demonstrated ethical scholarship in accurate representation and attrib.
Remarks from the professor on milestone 1 and for milestone 2A.docxsodhi3
Remarks from the professor on milestone 1 and for milestone 2
A good start on the paper. Please look at the introduction again. It does not match the case problem or what the issues of the company are. If you look at the first paragraph it does not lead into the next paragraph and the facts and flow are disjointed.
I read through the paper and it is a series of unjoined statements that don't really flow into a research work. You do have the correct issue that monthly variance in demand is the key to solving the problem but the supporting work for this statement is not there.
The next step for milestone 2 is to analyze the descriptive statistics, ANOVA and correlation/regression asked for in the case. From that you should see how to develop a model to correct the forecasting problem. Make sure your Milestone 2, gives a model that solves the problem.
QSO 510 Milestone Two Guidelines and Rubric
The final project for this course is the creation of a statistical analysis report. Operations management professionals are often relied upon to make decisions
regarding operational processes. Those who utilize a data-driven, structured approach have a clear advantage over those offering decisions based solely on
intuition. You will be provided with a scenario often encountered by an operations manager. Your task is to review the “A-Cat Corp.: Forecasting” scenario, the
addendum, and the accompanying data in the case scenario and addendum.
In Module Seven, you will submit your selection of statistical tools and data analysis, which are critical elements III and IV. You will submit a 3- to 4-page paper
and a spreadsheet that provides justification for the appropriate statistical tools needed to analyze the company’s data, a hypothesis, the results of your analysis,
any inferences from your hypothesis test, and a forecasting model that addresses the company’s problem.
Specifically, the following critical elements must be addressed:
III. Identify statistical tools and methods to collect data:
A. Identify the appropriate family of statistical tools that you will use to perform your analysis. What are your statistical assumptions concerning
the data that led you to selecting this family of tools? In other words, why did you select this family of tools for statistical analysis?
B. Determine the category of the provided data in the given case study. Be sure to justify why the data fits into this category type. What is the
relationship between the type of data and the tools?
C. From the identified family of statistical tools, select the most appropriate tool(s) for analyzing the data provided in the given case study.
D. Justify why you chose this tool to analyze the data. Be sure to include how this tool will help predict the use of the data in driving decisions.
E. Describe the quantitative method that will best inform data-driven decisions. Be sure to include how this method will point out the relationships
between ...
Statistical Processes
Can descriptive statistical processes be used in determining relationships, differences, or effects in your research question and testable null hypothesis? Why or why not? Also, address the value of descriptive statistics for the forensic psychology research problem that you have identified for your course project. read an article for additional information on descriptive statistics and pictorial data presentations.
300 words APA rules for attributing sources.
Computing Descriptive Statistics
Computing Descriptive Statistics: “Ever Wonder What Secrets They Hold?” The Mean, Mode, Median, Variability, and Standard Deviation
Introduction
Before gaining an appreciation for the value of descriptive statistics in behavioral science environments, one must first become familiar with the type of measurement data these statistical processes use. Knowing the types of measurement data will aid the decision maker in making sure that the chosen statistical method will, indeed, produce the results needed and expected. Using the wrong type of measurement data with a selected statistic tool will result in erroneous results, errors, and ineffective decision making.
Measurement, or numerical, data is divided into four types: nominal, ordinal, interval, and ratio. The businessperson, because of administering questionnaires, taking polls, conducting surveys, administering tests, and counting events, products, and a host of other numerical data instrumentations, garners all the numerical values associated with these four types.
Nominal Data
Nominal data is the simplest of all four forms of numerical data. The mathematical values are assigned to that which is being assessed simply by arbitrarily assigning numerical values to a characteristic, event, occasion, or phenomenon. For example, a human resources (HR) manager wishes to determine the differences in leadership styles between managers who are at different geographical regions. To compute the differences, the HR manager might assign the following values: 1 = West, 2 = Midwest, 3 = North, and so on. The numerical values are not descriptive of anything other than the location and are not indicative of quantity.
Ordinal Data
In terms of ordinal data, the variables contained within the measurement instrument are ranked in order of importance. For example, a product-marketing specialist might be interested in how a consumer group would respond to a new product. To garner the information, the questionnaire administered to a group of consumers would include questions scaled as follows: 1 = Not Likely, 2 = Somewhat Likely, 3 = Likely, 4 = More Than Likely, and 5 = Most Likely. This creates a scale rank order from Not Likely to Most Likely with respect to acceptance of the new consumer product.
Interval Data
Oftentimes, in addition to being ordered, the differences (or intervals) between two adjacent measurement values on a measurement scale are identical. For example, the di ...
OL 325 Milestone Three Guidelines and Rubric SectionMoseStaton39
OL 325 Milestone Three Guidelines and Rubric
Section 2: External Competitiveness
Section 2 shifts your focus outside the company to compare pay rates of positions inside the firm with similar positions in the external market place. The shift to
outside the company will move you away from the previous focus on e-sonic’s internal consistency to external competitiveness. Conducting an analysis of
external market data will support your decisions about appropriate pay-policy mixes for job structures in the company.
In section 2 of Milestone Three, you will be introduced to tools compensation professionals use to allocate total compensation within job structures. Total
compensation includes base pay, benefits, and varied incentives used to attract and retain employees. During the simulation you will use some of these tools to
develop pay policies for each e-sonic job structure.
In order to conduct your external market survey you will use web-based salary sites developed by the US Bureau of Labor Statistics and Glassdoor.com. These
websites develop salary information based off of actual pay data from professionals working in specific jobs and potentially represent the most current pay for
the job titles at e-sonic. Follow the steps outlined below:
Section 2 Outline:
Executive Summary Findings
1. Determine Appropriate Pay-Policy Levels for E-sonic Jobs
2. External Market Review
a) Research market competitiveness using the free salary websites listed above, which provide salary data by title and region.
b) Research trends about cost of living adjustments in e-sonic locations. Apply some discussion around leading, lagging or matching the market to
the salary data you found in your market salary research. Assume that the salary research you are using is similar to benchmark jobs. Also,
discuss whether jobs you researched would match the benchmark jobs or require more or less experience and talent than the benchmark job.
c) Update salary data for inflation using CPI-U.
3. Implement Salary Survey Results
a) Create pay grades and ranges by integrating external market data with internal pay grades.
b) Evaluate and summarize decisions made for each job structure.
The External Competitiveness section is fully described in the MyManagementLab Building Strategic Compensation Systems casebook for faculty and students,
linked in the course menu. Follow the explanations and outline to complete this milestone. Section 2: External Marketplace is due at the end of Module Six.
Rubric
Requirements of submission: Each section of the final project must follow these formatting guidelines: 5–7 pages, double spacing, 12-point Times New Roman
font, one-inch margins, and discipline-appropriate citations.
https://www.bls.gov/bls/blswage.htm
https://www.glassdoor.com/Salaries/index.htm
Critical Elements Exemplary (100%) Proficient (85%) Needs Improvement (55%) Not Evident (0%) Value
Section 2: External
Compet ...
This presentation will address the issue of sample size determination for social sciences. A simple example is provided for every to understand and explain the sample size determination.
Assignment 2 Tests of SignificanceThroughout this assignment yo.docxrock73
Assignment 2: Tests of Significance
Throughout this assignment you will review mock studies. You will needs to follow the directions outlined in the section using SPSS and decide whether there is significance between the variables. You will need to list the five steps of hypothesis testing (as covered in the lesson for Week 6) to see how every question should be formatted. You will complete all of the problems. Be sure to cut and past the appropriate test result boxes from SPSS under each problem and explain what you will do with your research hypotheses. All calculations should be coming from your SPSS. You will need to submit the SPSS output file to get credit for this assignment. This file will save as a .spv file and will need to be in a single file. In other words, you are not allowed to submit more than one output file for this assignment.
The five steps of hypothesis testing when using SPSS are as follows:
1. State your research hypothesis (H1) and null hypothesis (H0).
2. Identify your confidence interval (.05 or .01)
3. Conduct your analysis using SPSS.
4. Look for the valid score for comparison. This score is usually under ‘Sig 2-tail’ or ‘Sig. 2’. We will call this “p”.
5. Compare the two and apply the following rule:
a. If “p” is < or = confidence interval, than you reject the null.
Be sure to explain to the reader what this means in regards to your study. (Ex: will you recommend counseling services?)
* Be sure that your answers are clearly distinguishable. Perhaps you bold your font or use a different color.
ASSIGNMENT 2(200) WORD MINIUM
1. They allow us to see if our relationship is "statistically significant". (Remember that this only shows us that there is or is not a relationship but does NOT show us if it is big, small, or in-between.)
2. It let's us know if our findings can be generalized to the population which our sample was selected from and represents.
This week you will decide which test of significance you will use for your project. For this class your choices for tests will include one of the following:
· Chi-square
· t Test
· ANOVA
We will be using a process for hypothesis testing which outlines five steps researchers can follow to complete this process:
1. Write your research hypothesis (H1) and your null hypothesis (H0).
2. Identify and record your confidence interval. These are usually .05 (95%) or .01 (99%).
3. Complete the test using SPSS.
4. Identify the number under Sig. (2-tail). This will be represented by "p".
5. Compare the numbers in steps 2 and 4 and apply the following rule:
1. If p < or = confidence interval, than you reject the null hypothesis
Determine what to do with your null and explain this to your reader. Be sure to go beyond the phrase "reject or fail to reject the null" and explain how that impacts your research and best describes the relationship between variables.
TEST QUESTIONS-NEED FULL ANSWERS
Q1
Make up and discuss research examples corresponding to the various ...
NUR 440 Peer Review Guidelines and Rubric Overview Th.docxvannagoforth
NUR 440 Peer Review Guidelines and Rubric
Overview: The purpose of peer review is to facilitate quality-nursing care through best practice discovered in evidence-based research. According to the
American Nurses Association, “peer review in nursing is the process by which practicing registered nurses systematically access, monitor, and make judgments
about the quality of nursing care provided by peers as measured against professional standards of practice. Peer review implies that the nursing care delivered
by a group of nurses or an individual nurse is evaluated by individuals of the same rank or standing according to established standards of practice.” Peer review
helps not only the author but the reviewer as well through the development of a critical eye which can then be applied to their own work.
Prompt
As the reviewer:
When you peer review another’s work, you will critically evaluate and suggest improvements. You will likely read the abstract once or twice before delving in with
comments and first impressions. Using the checklist below, identify strengths and areas for improvement, being sure to address each critical element in your
review.
Peer Review Checklist:
x Aims and objectives: Is the purpose clearly stated?
x Background: Does the author offer background on the subject?
x Methods: Are the methods clearly stated? What type of method did the author use?
x Results: Are the results valid and reliable?
x Conclusions: Are the conclusions clearly stated and are they informed by the results?
x Relevance to clinical practice: Does the author state the relevancy to clinical practice?
x Articulation of response (e.g., citations, grammar, spelling, syntax, organization)
You will be evaluated on your peer reviews, not the abstract submitted, using the rubric below.
As the author of the abstract, remember the following:
x Read the review carefully, avoiding any desire to defend your choices.
x If you are unclear what the reviewer means, ask them to clarify.
x If you have any questions, feel free to pose them to the reviewer.
x Take special note of repeated commentary (e.g., grammar, citation, etc.) as this may signify an area for improvement.
x Thank the reviewers for their feedback. If some commentary was especially helpful, this is useful information for the reviewer.
x Accept that negative feedback comes with the territory. Your job is not to make everyone happy but to make your work the best that it can be.
https://americannursetoday.com/nursing-peer-review-principles-and-practice/
Guidelines for Submission: You must submit your abstract to the provided discussion for review by Sunday of the previous module. When choosing two abstracts
for review, be sure to select peers who have not yet received feedback. Each of your reviews should be 2–3 paragraphs in length.
Rubric
Critical Elements Exemplary (100%) Proficient (85%) Needs Improvement (55%) Not Evident (0%) Value
Analysis Mee ...
About Your Signature AssignmentThis signature assignment is de.docxransayo
About Your Signature Assignment
This signature assignment is designed to align with specific program student learning outcome(s) in your program. Program Student Learning Outcomes are broad statements that describe what students should know and be able to do upon completion of their degree. The signature assignments might be graded with an automated rubric that allows the University to collect data that can be aggregated across a location or college/school and used for program improvements.
Purpose of Assignment
The purpose of this assignment is for students to synthesize the concepts learned throughout the course. This assignment will provide students an opportunity to build critical thinking skills, develop businesses and organizations, and solve problems requiring data by compiling all pertinent information into one report.
Assignment Steps
Resources: Microsoft Excel®, Signature Assignment Databases, Signature Assignment Options, Part 3: Inferential Statistics
Scenario: Upon successful completion of the MBA program, say you work in the analytics department for a consulting company. Your assignment is to analyze one of the following databases:
· Manufacturing
· Hospital
· Consumer Food
· Financial
Select one of the databases based on the information in the Signature Assignment Options.
Provide a 12 paragraphs each 150 words statistical report including the following:
· Explain the context of the case
· Provide a research foundation for the topic
· Present graphs
· Explain outliers
· Prepare calculations
· Conduct hypotheses tests
· Discuss inferences you have made from the results
This assignment is broken down into four parts:
· Part 1 - Preliminary Analysis
· Part 2 - Examination of Descriptive Statistics
· Part 3 - Examination of Inferential Statistics
· Part 4 - Conclusion/Recommendations
Part 1 - Preliminary Analysis (3-4 paragraphs)
Generally, as a statistics consultant, you will be given a problem and data. At times, you may have to gather additional data. For this assignment, assume all the data is already gathered for you.
State the objective:
· What are the questions you are trying to address?
Describe the population in the study clearly and in sufficient detail:
· What is the sample?
Discuss the types of data and variables:
· Are the data quantitative or qualitative?
· What are levels of measurement for the data?
Part 2 - Descriptive Statistics (3-4 paragraphs)
Examine the given data.
Present the descriptive statistics (mean, median, mode, range, standard deviation, variance, CV, and five-number summary).
Identify any outliers in the data.
Present any graphs or charts you think are appropriate for the data.
Note: Ideally, we want to assess the conditions of normality too. However, for the purpose of this exercise, assume data is drawn from normal populations.
Part 3 - Inferential Statistics (2-3 paragraphs)
Use the Part 3: Inferential Statistics document.
· Create (formulate) hypotheses
· Run formal hyp.
Individual Assignment 2 Research, Analysis & Outline for Final PaLizbethQuinonez813
Individual Assignment 2: Research, Analysis & Outline for Final Paper
CLO #3 Analyze the need for increasing creative thought in a complex global environment including designing strategies to increase cash, profit and growth through understanding competitive dynamics.
CLO#5 Analyze and apply decision matrices for creative opportunities, or to mitigate risk and/or legal considerations in the global marketplace including compliance with Foreign Corrupt Practices Act (FCPA).
Due:Wednesday Week 6
Value: 150
Length: 5 - 7 page informal outline.
The purpose of this assignment is for students to write an outline that presents their research for the final paper (the Signature Assignment) for this class. Students are not writing the final paper (yet). For this assignment, and thus for the final paper students are to identify a business that corresponds to the assigned business sectors (each student is to identify a separate business). In this outline, students will bring options and opportunities, creative problem solving to either solve a problem or create an opportunity. Remember we do not tell companies what they “must or should do.” We present options and opportunities. Students will apply creative innovative thought to the analysis. You can use bullet points for this outline. Students should apply any feedback received from this assignment to the final assignment.
Some important items to note before writing Assignment 2:
· Please go to Week 8 and read the Handout and Rubric for Assignment 3.
· The research is very detailed, double-spaced, Times New Roman, APA Headings, Title Page, References and APA citations. This is an example of an APA sample paper.
· Long quotes are not to be used in short papers of this nature; thus, all quotes should be from seven to 12 words and of course must use APA citations.
· The outline is to detail key points supported with corresponding citations.
· The outline must use at least three levels of Use APA headings. Sources (must be current - one year) other than the textbook can include: New York Times, Wall Street Journal, Harvard Business Review, Wired Magazine, (all can be found in the our University Library). You can also use any government website (usually “.gov”). You can use academic research but it must be recent (five years or newer).
Directions
After reading assigned chapters in your textbook and other course materials, continue your research to gain additional knowledge on industries and business sectors. This following link, located here, has access to a breakdown of all industries. The links after each industry provides additional data.
For the outline, briefly describe the business that you have chosen and the global footprint of their broader industry [e.g. number of subsidiaries in other countries, information on profit and growth strategies, key suppliers and customers. List three (3) major competitors (supported by data), and explain the percentage of the market share the business occup ...
Individual Assignment 2 Research, Analysis & Outline for Final PaLaticiaGrissomzz
Individual Assignment 2: Research, Analysis & Outline for Final Paper
CLO #3 Analyze the need for increasing creative thought in a complex global environment including designing strategies to increase cash, profit and growth through understanding competitive dynamics.
CLO#5 Analyze and apply decision matrices for creative opportunities, or to mitigate risk and/or legal considerations in the global marketplace including compliance with Foreign Corrupt Practices Act (FCPA).
Due:Wednesday Week 6
Value: 150
Length: 5 - 7 page informal outline.
The purpose of this assignment is for students to write an outline that presents their research for the final paper (the Signature Assignment) for this class. Students are not writing the final paper (yet). For this assignment, and thus for the final paper students are to identify a business that corresponds to the assigned business sectors (each student is to identify a separate business). In this outline, students will bring options and opportunities, creative problem solving to either solve a problem or create an opportunity. Remember we do not tell companies what they “must or should do.” We present options and opportunities. Students will apply creative innovative thought to the analysis. You can use bullet points for this outline. Students should apply any feedback received from this assignment to the final assignment.
Some important items to note before writing Assignment 2:
· Please go to Week 8 and read the Handout and Rubric for Assignment 3.
· The research is very detailed, double-spaced, Times New Roman, APA Headings, Title Page, References and APA citations. This is an example of an APA sample paper.
· Long quotes are not to be used in short papers of this nature; thus, all quotes should be from seven to 12 words and of course must use APA citations.
· The outline is to detail key points supported with corresponding citations.
· The outline must use at least three levels of Use APA headings. Sources (must be current - one year) other than the textbook can include: New York Times, Wall Street Journal, Harvard Business Review, Wired Magazine, (all can be found in the our University Library). You can also use any government website (usually “.gov”). You can use academic research but it must be recent (five years or newer).
Directions
After reading assigned chapters in your textbook and other course materials, continue your research to gain additional knowledge on industries and business sectors. This following link, located here, has access to a breakdown of all industries. The links after each industry provides additional data.
For the outline, briefly describe the business that you have chosen and the global footprint of their broader industry [e.g. number of subsidiaries in other countries, information on profit and growth strategies, key suppliers and customers. List three (3) major competitors (supported by data), and explain the percentage of the market share the business occup ...
You will submit a 1-2 page double spaced paper, plus references, des.docxjustine1simpson78276
You will submit a 1-2 page double spaced paper, plus references, describing this organism, and present it to your peers in class on 6/30. In this paper and presentation, you will lay out the organism’s cellular morphology, metabolic activities, growth niche and any virulence or special attributes that it contains. You may discuss how these factors all contribute to its perpetuation.
.
you will submit a 150-200 word reading summary -Reasons for the .docxjustine1simpson78276
you will submit a 150-200 word reading summary
-Reasons for the way things are.
-Confussion about the story of reality
-What is christianity
-4 elements of every world view: where we come from? what is our problem? what is the solution?
Restoration
.
You will submit a 1500 word fully-referenced critical essay .docxjustine1simpson78276
You will submit a 1500 word
fully-referenced
critical essay which will DISCUSS ONE of the following:
a) Journalism is an expression of the culture in which it resides.
b) The decline of the foreign correspondent.
c) Does the West continue to dominate global news flow?
d) Asian values in journalism and its impact across the Asia-Pacific region.
e) The challenges for African journalism in the 21st century.
f) Compare and contrast development journalism in Asia and Africa.
g) The Pacific journalist – tradition versus freedom of expression.
h) The challenges for investigative journalism in Eastern Europe.
i) The clash of civilisation and its influence on US journalism.
j) The framing of Africa by western journalists.
k) Freedom of expression vs democracy in Latin America.
l) The decline of US newspapers and what it means for democracy.
m) Is peace journalism possible?
n)
OR a statement you design based on your studies which has received prior approval from your tutor at least TWO weeks before due date
.
Your assignment will be assessed according to the criteria sheet at the end of the Subject Outline. You are encouraged to self-assess your work by submitting a copy of this assessment criteria sheet with your assignment.
Length: 1500 words
Due: Friday of Week 14
.
you will submit a 150-200 word reading summary The story of real.docxjustine1simpson78276
you will submit a 150-200 word reading summary
The story of reality
What does it mean whether or not the Christian story is the truth about the world.
The blind men and the Elephant
Two applications: religious and skeptical
Three problems: contraction claims, story teller, a talking elephant.
Christians have a problem with the evil.
The problem of a narrow way.
God, Jesus, Men, Resurrection
.
You will select an enterprise-level risks that impact an organizatio.docxjustine1simpson78276
You will select an enterprise-level risks that impact an organization of your choice … please address the following items:
• Here’s the approach you can take for this paper:
Title page (ensure team members and IDs are listed)
Introduction – provide a background of the selected organization.
Risk #1
Description
Impact on organization
Recommendation on how to manage it
Risk #2
Description
Impact on organization
Recommendation on how to manage it
Risk #3
Description
Impact on organization
Recommendation on how to manage it
Conclusion
References (minimum of 8 reputable sources)
Appendix (if any)
The paper will range from 15-pages includes title page, content, and references.
Please write in APA Style.
.
You will select a psychologist (Skinner or Freud ) and conduct a bri.docxjustine1simpson78276
You will select a psychologist (Skinner or Freud ) and conduct a brief investigation of their work. You will produce a two-page written document with a corresponding reference section (three pages total) summarizing the psychologist’s major contribution(s) to the field of psychology, their influence on modern-day psychology, and your opinion on the significance of their work.
Read the files for more detail.
.
You will select a hot button issue from current or relatively re.docxjustine1simpson78276
You will select a hot button issue from current or relatively recent events and examine the ways it (was) being covered by various media outlets. Once you select your topic you must obtain a representative sample of how the topic is being discussed in major outlets of the Conservative, Liberal, and Non-partisan media as well as how it is being discussed on the media. The website
www.allslides.com
will assist you in determining the political views of various media outlets. The components of your project are listed below:
1. A representative sample of how the topic is being discussed in the Conservative (right wing) media:
a. 1 short video clip from a major conservative cable news outlet (e.g. Fox News)
b. 1 example from a major conservative web site (e.g. The Heritage Fondation)
c. 1 example from a major liberal magazine or newspaper (e.g. The National Review / The New York Post)
2. A representative sample of how the topic is being discussed in the Liberal / Progressive (left wing) media:
a. 1 short video clip from a major liberal cable news outlet (e.g. MSNBC)
b. 1 example from a major liberal web site (e.g. thinkprogress.org)
c. 1 example from a major liberal magazine or newspaper (e.g. Mother Jones / The New York Times)
3. A representative sample of how the topic is being discussed in the Center / Non-partisan / Mainstream media:
a. 1 short video clip from a major mainstream news outlet (e.g. ABC, CBS, NBC, CNN)
b. 1 example from a major mainstream web site (e.g. politico.com)
c. 1 example from a major mainstream magazine or newspaper (e.g. Time / USA Today)
4. A representative sample of how the topic is being discussed in the social media:
a. 1 example of a back and forth discussion from a social media outlet (e.g. Facebook, Twitter)
.
More Related Content
Similar to ANOVA is a hypothesis testing technique used to compare the equali.docx
Remarks from the professor on milestone 1 and for milestone 2A.docxsodhi3
Remarks from the professor on milestone 1 and for milestone 2
A good start on the paper. Please look at the introduction again. It does not match the case problem or what the issues of the company are. If you look at the first paragraph it does not lead into the next paragraph and the facts and flow are disjointed.
I read through the paper and it is a series of unjoined statements that don't really flow into a research work. You do have the correct issue that monthly variance in demand is the key to solving the problem but the supporting work for this statement is not there.
The next step for milestone 2 is to analyze the descriptive statistics, ANOVA and correlation/regression asked for in the case. From that you should see how to develop a model to correct the forecasting problem. Make sure your Milestone 2, gives a model that solves the problem.
QSO 510 Milestone Two Guidelines and Rubric
The final project for this course is the creation of a statistical analysis report. Operations management professionals are often relied upon to make decisions
regarding operational processes. Those who utilize a data-driven, structured approach have a clear advantage over those offering decisions based solely on
intuition. You will be provided with a scenario often encountered by an operations manager. Your task is to review the “A-Cat Corp.: Forecasting” scenario, the
addendum, and the accompanying data in the case scenario and addendum.
In Module Seven, you will submit your selection of statistical tools and data analysis, which are critical elements III and IV. You will submit a 3- to 4-page paper
and a spreadsheet that provides justification for the appropriate statistical tools needed to analyze the company’s data, a hypothesis, the results of your analysis,
any inferences from your hypothesis test, and a forecasting model that addresses the company’s problem.
Specifically, the following critical elements must be addressed:
III. Identify statistical tools and methods to collect data:
A. Identify the appropriate family of statistical tools that you will use to perform your analysis. What are your statistical assumptions concerning
the data that led you to selecting this family of tools? In other words, why did you select this family of tools for statistical analysis?
B. Determine the category of the provided data in the given case study. Be sure to justify why the data fits into this category type. What is the
relationship between the type of data and the tools?
C. From the identified family of statistical tools, select the most appropriate tool(s) for analyzing the data provided in the given case study.
D. Justify why you chose this tool to analyze the data. Be sure to include how this tool will help predict the use of the data in driving decisions.
E. Describe the quantitative method that will best inform data-driven decisions. Be sure to include how this method will point out the relationships
between ...
Statistical Processes
Can descriptive statistical processes be used in determining relationships, differences, or effects in your research question and testable null hypothesis? Why or why not? Also, address the value of descriptive statistics for the forensic psychology research problem that you have identified for your course project. read an article for additional information on descriptive statistics and pictorial data presentations.
300 words APA rules for attributing sources.
Computing Descriptive Statistics
Computing Descriptive Statistics: “Ever Wonder What Secrets They Hold?” The Mean, Mode, Median, Variability, and Standard Deviation
Introduction
Before gaining an appreciation for the value of descriptive statistics in behavioral science environments, one must first become familiar with the type of measurement data these statistical processes use. Knowing the types of measurement data will aid the decision maker in making sure that the chosen statistical method will, indeed, produce the results needed and expected. Using the wrong type of measurement data with a selected statistic tool will result in erroneous results, errors, and ineffective decision making.
Measurement, or numerical, data is divided into four types: nominal, ordinal, interval, and ratio. The businessperson, because of administering questionnaires, taking polls, conducting surveys, administering tests, and counting events, products, and a host of other numerical data instrumentations, garners all the numerical values associated with these four types.
Nominal Data
Nominal data is the simplest of all four forms of numerical data. The mathematical values are assigned to that which is being assessed simply by arbitrarily assigning numerical values to a characteristic, event, occasion, or phenomenon. For example, a human resources (HR) manager wishes to determine the differences in leadership styles between managers who are at different geographical regions. To compute the differences, the HR manager might assign the following values: 1 = West, 2 = Midwest, 3 = North, and so on. The numerical values are not descriptive of anything other than the location and are not indicative of quantity.
Ordinal Data
In terms of ordinal data, the variables contained within the measurement instrument are ranked in order of importance. For example, a product-marketing specialist might be interested in how a consumer group would respond to a new product. To garner the information, the questionnaire administered to a group of consumers would include questions scaled as follows: 1 = Not Likely, 2 = Somewhat Likely, 3 = Likely, 4 = More Than Likely, and 5 = Most Likely. This creates a scale rank order from Not Likely to Most Likely with respect to acceptance of the new consumer product.
Interval Data
Oftentimes, in addition to being ordered, the differences (or intervals) between two adjacent measurement values on a measurement scale are identical. For example, the di ...
OL 325 Milestone Three Guidelines and Rubric SectionMoseStaton39
OL 325 Milestone Three Guidelines and Rubric
Section 2: External Competitiveness
Section 2 shifts your focus outside the company to compare pay rates of positions inside the firm with similar positions in the external market place. The shift to
outside the company will move you away from the previous focus on e-sonic’s internal consistency to external competitiveness. Conducting an analysis of
external market data will support your decisions about appropriate pay-policy mixes for job structures in the company.
In section 2 of Milestone Three, you will be introduced to tools compensation professionals use to allocate total compensation within job structures. Total
compensation includes base pay, benefits, and varied incentives used to attract and retain employees. During the simulation you will use some of these tools to
develop pay policies for each e-sonic job structure.
In order to conduct your external market survey you will use web-based salary sites developed by the US Bureau of Labor Statistics and Glassdoor.com. These
websites develop salary information based off of actual pay data from professionals working in specific jobs and potentially represent the most current pay for
the job titles at e-sonic. Follow the steps outlined below:
Section 2 Outline:
Executive Summary Findings
1. Determine Appropriate Pay-Policy Levels for E-sonic Jobs
2. External Market Review
a) Research market competitiveness using the free salary websites listed above, which provide salary data by title and region.
b) Research trends about cost of living adjustments in e-sonic locations. Apply some discussion around leading, lagging or matching the market to
the salary data you found in your market salary research. Assume that the salary research you are using is similar to benchmark jobs. Also,
discuss whether jobs you researched would match the benchmark jobs or require more or less experience and talent than the benchmark job.
c) Update salary data for inflation using CPI-U.
3. Implement Salary Survey Results
a) Create pay grades and ranges by integrating external market data with internal pay grades.
b) Evaluate and summarize decisions made for each job structure.
The External Competitiveness section is fully described in the MyManagementLab Building Strategic Compensation Systems casebook for faculty and students,
linked in the course menu. Follow the explanations and outline to complete this milestone. Section 2: External Marketplace is due at the end of Module Six.
Rubric
Requirements of submission: Each section of the final project must follow these formatting guidelines: 5–7 pages, double spacing, 12-point Times New Roman
font, one-inch margins, and discipline-appropriate citations.
https://www.bls.gov/bls/blswage.htm
https://www.glassdoor.com/Salaries/index.htm
Critical Elements Exemplary (100%) Proficient (85%) Needs Improvement (55%) Not Evident (0%) Value
Section 2: External
Compet ...
This presentation will address the issue of sample size determination for social sciences. A simple example is provided for every to understand and explain the sample size determination.
Assignment 2 Tests of SignificanceThroughout this assignment yo.docxrock73
Assignment 2: Tests of Significance
Throughout this assignment you will review mock studies. You will needs to follow the directions outlined in the section using SPSS and decide whether there is significance between the variables. You will need to list the five steps of hypothesis testing (as covered in the lesson for Week 6) to see how every question should be formatted. You will complete all of the problems. Be sure to cut and past the appropriate test result boxes from SPSS under each problem and explain what you will do with your research hypotheses. All calculations should be coming from your SPSS. You will need to submit the SPSS output file to get credit for this assignment. This file will save as a .spv file and will need to be in a single file. In other words, you are not allowed to submit more than one output file for this assignment.
The five steps of hypothesis testing when using SPSS are as follows:
1. State your research hypothesis (H1) and null hypothesis (H0).
2. Identify your confidence interval (.05 or .01)
3. Conduct your analysis using SPSS.
4. Look for the valid score for comparison. This score is usually under ‘Sig 2-tail’ or ‘Sig. 2’. We will call this “p”.
5. Compare the two and apply the following rule:
a. If “p” is < or = confidence interval, than you reject the null.
Be sure to explain to the reader what this means in regards to your study. (Ex: will you recommend counseling services?)
* Be sure that your answers are clearly distinguishable. Perhaps you bold your font or use a different color.
ASSIGNMENT 2(200) WORD MINIUM
1. They allow us to see if our relationship is "statistically significant". (Remember that this only shows us that there is or is not a relationship but does NOT show us if it is big, small, or in-between.)
2. It let's us know if our findings can be generalized to the population which our sample was selected from and represents.
This week you will decide which test of significance you will use for your project. For this class your choices for tests will include one of the following:
· Chi-square
· t Test
· ANOVA
We will be using a process for hypothesis testing which outlines five steps researchers can follow to complete this process:
1. Write your research hypothesis (H1) and your null hypothesis (H0).
2. Identify and record your confidence interval. These are usually .05 (95%) or .01 (99%).
3. Complete the test using SPSS.
4. Identify the number under Sig. (2-tail). This will be represented by "p".
5. Compare the numbers in steps 2 and 4 and apply the following rule:
1. If p < or = confidence interval, than you reject the null hypothesis
Determine what to do with your null and explain this to your reader. Be sure to go beyond the phrase "reject or fail to reject the null" and explain how that impacts your research and best describes the relationship between variables.
TEST QUESTIONS-NEED FULL ANSWERS
Q1
Make up and discuss research examples corresponding to the various ...
NUR 440 Peer Review Guidelines and Rubric Overview Th.docxvannagoforth
NUR 440 Peer Review Guidelines and Rubric
Overview: The purpose of peer review is to facilitate quality-nursing care through best practice discovered in evidence-based research. According to the
American Nurses Association, “peer review in nursing is the process by which practicing registered nurses systematically access, monitor, and make judgments
about the quality of nursing care provided by peers as measured against professional standards of practice. Peer review implies that the nursing care delivered
by a group of nurses or an individual nurse is evaluated by individuals of the same rank or standing according to established standards of practice.” Peer review
helps not only the author but the reviewer as well through the development of a critical eye which can then be applied to their own work.
Prompt
As the reviewer:
When you peer review another’s work, you will critically evaluate and suggest improvements. You will likely read the abstract once or twice before delving in with
comments and first impressions. Using the checklist below, identify strengths and areas for improvement, being sure to address each critical element in your
review.
Peer Review Checklist:
x Aims and objectives: Is the purpose clearly stated?
x Background: Does the author offer background on the subject?
x Methods: Are the methods clearly stated? What type of method did the author use?
x Results: Are the results valid and reliable?
x Conclusions: Are the conclusions clearly stated and are they informed by the results?
x Relevance to clinical practice: Does the author state the relevancy to clinical practice?
x Articulation of response (e.g., citations, grammar, spelling, syntax, organization)
You will be evaluated on your peer reviews, not the abstract submitted, using the rubric below.
As the author of the abstract, remember the following:
x Read the review carefully, avoiding any desire to defend your choices.
x If you are unclear what the reviewer means, ask them to clarify.
x If you have any questions, feel free to pose them to the reviewer.
x Take special note of repeated commentary (e.g., grammar, citation, etc.) as this may signify an area for improvement.
x Thank the reviewers for their feedback. If some commentary was especially helpful, this is useful information for the reviewer.
x Accept that negative feedback comes with the territory. Your job is not to make everyone happy but to make your work the best that it can be.
https://americannursetoday.com/nursing-peer-review-principles-and-practice/
Guidelines for Submission: You must submit your abstract to the provided discussion for review by Sunday of the previous module. When choosing two abstracts
for review, be sure to select peers who have not yet received feedback. Each of your reviews should be 2–3 paragraphs in length.
Rubric
Critical Elements Exemplary (100%) Proficient (85%) Needs Improvement (55%) Not Evident (0%) Value
Analysis Mee ...
About Your Signature AssignmentThis signature assignment is de.docxransayo
About Your Signature Assignment
This signature assignment is designed to align with specific program student learning outcome(s) in your program. Program Student Learning Outcomes are broad statements that describe what students should know and be able to do upon completion of their degree. The signature assignments might be graded with an automated rubric that allows the University to collect data that can be aggregated across a location or college/school and used for program improvements.
Purpose of Assignment
The purpose of this assignment is for students to synthesize the concepts learned throughout the course. This assignment will provide students an opportunity to build critical thinking skills, develop businesses and organizations, and solve problems requiring data by compiling all pertinent information into one report.
Assignment Steps
Resources: Microsoft Excel®, Signature Assignment Databases, Signature Assignment Options, Part 3: Inferential Statistics
Scenario: Upon successful completion of the MBA program, say you work in the analytics department for a consulting company. Your assignment is to analyze one of the following databases:
· Manufacturing
· Hospital
· Consumer Food
· Financial
Select one of the databases based on the information in the Signature Assignment Options.
Provide a 12 paragraphs each 150 words statistical report including the following:
· Explain the context of the case
· Provide a research foundation for the topic
· Present graphs
· Explain outliers
· Prepare calculations
· Conduct hypotheses tests
· Discuss inferences you have made from the results
This assignment is broken down into four parts:
· Part 1 - Preliminary Analysis
· Part 2 - Examination of Descriptive Statistics
· Part 3 - Examination of Inferential Statistics
· Part 4 - Conclusion/Recommendations
Part 1 - Preliminary Analysis (3-4 paragraphs)
Generally, as a statistics consultant, you will be given a problem and data. At times, you may have to gather additional data. For this assignment, assume all the data is already gathered for you.
State the objective:
· What are the questions you are trying to address?
Describe the population in the study clearly and in sufficient detail:
· What is the sample?
Discuss the types of data and variables:
· Are the data quantitative or qualitative?
· What are levels of measurement for the data?
Part 2 - Descriptive Statistics (3-4 paragraphs)
Examine the given data.
Present the descriptive statistics (mean, median, mode, range, standard deviation, variance, CV, and five-number summary).
Identify any outliers in the data.
Present any graphs or charts you think are appropriate for the data.
Note: Ideally, we want to assess the conditions of normality too. However, for the purpose of this exercise, assume data is drawn from normal populations.
Part 3 - Inferential Statistics (2-3 paragraphs)
Use the Part 3: Inferential Statistics document.
· Create (formulate) hypotheses
· Run formal hyp.
Individual Assignment 2 Research, Analysis & Outline for Final PaLizbethQuinonez813
Individual Assignment 2: Research, Analysis & Outline for Final Paper
CLO #3 Analyze the need for increasing creative thought in a complex global environment including designing strategies to increase cash, profit and growth through understanding competitive dynamics.
CLO#5 Analyze and apply decision matrices for creative opportunities, or to mitigate risk and/or legal considerations in the global marketplace including compliance with Foreign Corrupt Practices Act (FCPA).
Due:Wednesday Week 6
Value: 150
Length: 5 - 7 page informal outline.
The purpose of this assignment is for students to write an outline that presents their research for the final paper (the Signature Assignment) for this class. Students are not writing the final paper (yet). For this assignment, and thus for the final paper students are to identify a business that corresponds to the assigned business sectors (each student is to identify a separate business). In this outline, students will bring options and opportunities, creative problem solving to either solve a problem or create an opportunity. Remember we do not tell companies what they “must or should do.” We present options and opportunities. Students will apply creative innovative thought to the analysis. You can use bullet points for this outline. Students should apply any feedback received from this assignment to the final assignment.
Some important items to note before writing Assignment 2:
· Please go to Week 8 and read the Handout and Rubric for Assignment 3.
· The research is very detailed, double-spaced, Times New Roman, APA Headings, Title Page, References and APA citations. This is an example of an APA sample paper.
· Long quotes are not to be used in short papers of this nature; thus, all quotes should be from seven to 12 words and of course must use APA citations.
· The outline is to detail key points supported with corresponding citations.
· The outline must use at least three levels of Use APA headings. Sources (must be current - one year) other than the textbook can include: New York Times, Wall Street Journal, Harvard Business Review, Wired Magazine, (all can be found in the our University Library). You can also use any government website (usually “.gov”). You can use academic research but it must be recent (five years or newer).
Directions
After reading assigned chapters in your textbook and other course materials, continue your research to gain additional knowledge on industries and business sectors. This following link, located here, has access to a breakdown of all industries. The links after each industry provides additional data.
For the outline, briefly describe the business that you have chosen and the global footprint of their broader industry [e.g. number of subsidiaries in other countries, information on profit and growth strategies, key suppliers and customers. List three (3) major competitors (supported by data), and explain the percentage of the market share the business occup ...
Individual Assignment 2 Research, Analysis & Outline for Final PaLaticiaGrissomzz
Individual Assignment 2: Research, Analysis & Outline for Final Paper
CLO #3 Analyze the need for increasing creative thought in a complex global environment including designing strategies to increase cash, profit and growth through understanding competitive dynamics.
CLO#5 Analyze and apply decision matrices for creative opportunities, or to mitigate risk and/or legal considerations in the global marketplace including compliance with Foreign Corrupt Practices Act (FCPA).
Due:Wednesday Week 6
Value: 150
Length: 5 - 7 page informal outline.
The purpose of this assignment is for students to write an outline that presents their research for the final paper (the Signature Assignment) for this class. Students are not writing the final paper (yet). For this assignment, and thus for the final paper students are to identify a business that corresponds to the assigned business sectors (each student is to identify a separate business). In this outline, students will bring options and opportunities, creative problem solving to either solve a problem or create an opportunity. Remember we do not tell companies what they “must or should do.” We present options and opportunities. Students will apply creative innovative thought to the analysis. You can use bullet points for this outline. Students should apply any feedback received from this assignment to the final assignment.
Some important items to note before writing Assignment 2:
· Please go to Week 8 and read the Handout and Rubric for Assignment 3.
· The research is very detailed, double-spaced, Times New Roman, APA Headings, Title Page, References and APA citations. This is an example of an APA sample paper.
· Long quotes are not to be used in short papers of this nature; thus, all quotes should be from seven to 12 words and of course must use APA citations.
· The outline is to detail key points supported with corresponding citations.
· The outline must use at least three levels of Use APA headings. Sources (must be current - one year) other than the textbook can include: New York Times, Wall Street Journal, Harvard Business Review, Wired Magazine, (all can be found in the our University Library). You can also use any government website (usually “.gov”). You can use academic research but it must be recent (five years or newer).
Directions
After reading assigned chapters in your textbook and other course materials, continue your research to gain additional knowledge on industries and business sectors. This following link, located here, has access to a breakdown of all industries. The links after each industry provides additional data.
For the outline, briefly describe the business that you have chosen and the global footprint of their broader industry [e.g. number of subsidiaries in other countries, information on profit and growth strategies, key suppliers and customers. List three (3) major competitors (supported by data), and explain the percentage of the market share the business occup ...
You will submit a 1-2 page double spaced paper, plus references, des.docxjustine1simpson78276
You will submit a 1-2 page double spaced paper, plus references, describing this organism, and present it to your peers in class on 6/30. In this paper and presentation, you will lay out the organism’s cellular morphology, metabolic activities, growth niche and any virulence or special attributes that it contains. You may discuss how these factors all contribute to its perpetuation.
.
you will submit a 150-200 word reading summary -Reasons for the .docxjustine1simpson78276
you will submit a 150-200 word reading summary
-Reasons for the way things are.
-Confussion about the story of reality
-What is christianity
-4 elements of every world view: where we come from? what is our problem? what is the solution?
Restoration
.
You will submit a 1500 word fully-referenced critical essay .docxjustine1simpson78276
You will submit a 1500 word
fully-referenced
critical essay which will DISCUSS ONE of the following:
a) Journalism is an expression of the culture in which it resides.
b) The decline of the foreign correspondent.
c) Does the West continue to dominate global news flow?
d) Asian values in journalism and its impact across the Asia-Pacific region.
e) The challenges for African journalism in the 21st century.
f) Compare and contrast development journalism in Asia and Africa.
g) The Pacific journalist – tradition versus freedom of expression.
h) The challenges for investigative journalism in Eastern Europe.
i) The clash of civilisation and its influence on US journalism.
j) The framing of Africa by western journalists.
k) Freedom of expression vs democracy in Latin America.
l) The decline of US newspapers and what it means for democracy.
m) Is peace journalism possible?
n)
OR a statement you design based on your studies which has received prior approval from your tutor at least TWO weeks before due date
.
Your assignment will be assessed according to the criteria sheet at the end of the Subject Outline. You are encouraged to self-assess your work by submitting a copy of this assessment criteria sheet with your assignment.
Length: 1500 words
Due: Friday of Week 14
.
you will submit a 150-200 word reading summary The story of real.docxjustine1simpson78276
you will submit a 150-200 word reading summary
The story of reality
What does it mean whether or not the Christian story is the truth about the world.
The blind men and the Elephant
Two applications: religious and skeptical
Three problems: contraction claims, story teller, a talking elephant.
Christians have a problem with the evil.
The problem of a narrow way.
God, Jesus, Men, Resurrection
.
You will select an enterprise-level risks that impact an organizatio.docxjustine1simpson78276
You will select an enterprise-level risks that impact an organization of your choice … please address the following items:
• Here’s the approach you can take for this paper:
Title page (ensure team members and IDs are listed)
Introduction – provide a background of the selected organization.
Risk #1
Description
Impact on organization
Recommendation on how to manage it
Risk #2
Description
Impact on organization
Recommendation on how to manage it
Risk #3
Description
Impact on organization
Recommendation on how to manage it
Conclusion
References (minimum of 8 reputable sources)
Appendix (if any)
The paper will range from 15-pages includes title page, content, and references.
Please write in APA Style.
.
You will select a psychologist (Skinner or Freud ) and conduct a bri.docxjustine1simpson78276
You will select a psychologist (Skinner or Freud ) and conduct a brief investigation of their work. You will produce a two-page written document with a corresponding reference section (three pages total) summarizing the psychologist’s major contribution(s) to the field of psychology, their influence on modern-day psychology, and your opinion on the significance of their work.
Read the files for more detail.
.
You will select a hot button issue from current or relatively re.docxjustine1simpson78276
You will select a hot button issue from current or relatively recent events and examine the ways it (was) being covered by various media outlets. Once you select your topic you must obtain a representative sample of how the topic is being discussed in major outlets of the Conservative, Liberal, and Non-partisan media as well as how it is being discussed on the media. The website
www.allslides.com
will assist you in determining the political views of various media outlets. The components of your project are listed below:
1. A representative sample of how the topic is being discussed in the Conservative (right wing) media:
a. 1 short video clip from a major conservative cable news outlet (e.g. Fox News)
b. 1 example from a major conservative web site (e.g. The Heritage Fondation)
c. 1 example from a major liberal magazine or newspaper (e.g. The National Review / The New York Post)
2. A representative sample of how the topic is being discussed in the Liberal / Progressive (left wing) media:
a. 1 short video clip from a major liberal cable news outlet (e.g. MSNBC)
b. 1 example from a major liberal web site (e.g. thinkprogress.org)
c. 1 example from a major liberal magazine or newspaper (e.g. Mother Jones / The New York Times)
3. A representative sample of how the topic is being discussed in the Center / Non-partisan / Mainstream media:
a. 1 short video clip from a major mainstream news outlet (e.g. ABC, CBS, NBC, CNN)
b. 1 example from a major mainstream web site (e.g. politico.com)
c. 1 example from a major mainstream magazine or newspaper (e.g. Time / USA Today)
4. A representative sample of how the topic is being discussed in the social media:
a. 1 example of a back and forth discussion from a social media outlet (e.g. Facebook, Twitter)
.
you will research resources available on the Internet for monitoring.docxjustine1simpson78276
you will research resources available on the Internet for monitoring natural phenomena including earthquakes, volcanoes, tsunamis, global climate, and weather.
Based on your research, do the following:
Identify a minimum of three different natural phenomena that are typically responsible for natural disasters. Analyze the potential impact of these disasters.
Analyze how these phenomenon are monitored, or not, via the Internet. Critique available Web sites, which publicly display up-to-date monitored information related to each of the natural phenomena you have identified. Focus on the following aspects:
Geography
What parts of the world are potentially affected by these phenomena? Specifically identify the countries.
Resources
What kinds of resources are allocated toward monitoring these phenomena and why?
What types of Web resources monitor the phenomena and provide up-to-date information about them?
What kinds of technology are involved in monitoring the phenomena?
Politics
What political ramifications would this disaster-preparedness technology cause between more-developed countries and less-developed countries?
What kinds of issues could this technology cause between less-developed countries?
Economics
How would this technology directly impact the economies of those countries that have the technology versus those countries that do not?
Do you predict any indirect impacts? What current evidence supports your position?
Disaster Preparedness
What types of systems are in place in terms of disaster preparedness related to these monitored phenomena?
Summarize your findings. Evaluate how this technology will impact the future of humanity, both positively and negatively. Be sure to consider the political and economic issues discussed in your future predictions.
Support your statements with examples. Use a minimum of six reliable references, two of which should be peer-reviewed articles.
Write a 7–8-page paper in Word format. Apply APA standards to citation of sources.
.
You will review qualitative research. The topic is up to you as lon.docxjustine1simpson78276
You will review qualitative research. The topic is up to you as long as you choose a peer-reviewed, academic research piece. There are no hard word counts or page requirements as long as you cover the basic guidelines. You must submit original work, however, and a paper that returns as a large percentage of copy/paste to other sources will not be accepted. (Safe Assign will be used to track/monitor your submission for plagiarism.)
Please use APA formatting and include the following information:
Introduction/Background: Provide context for the research article. What led the author(s) to write the piece? What key concepts were explored? Were there weaknesses in prior research that led the author to the current hypothesis or research question?
Methodology: Describe how the data was gathered and analyzed. What research questions or hypotheses were the researcher trying to explore? What statistical analysis was used?
Study Findings and Results: What were the major findings from the study? Were there any limitations?
Conclusions: Evaluate the article in terms of significance, research methods, readability and the implications of the results. Does the piece lead into further study? Are there different methods you would have chosen based on what you read? What are the strengths and weaknesses of the article in terms of statistical analysis and application? (This is where a large part of the rubric is covered.)
References
.
You will review quantitative research. The topic is up to you as lo.docxjustine1simpson78276
You will review quantitative research. The topic is up to you as long as you choose a peer-reviewed, academic research piece. There are no hard word counts or page requirements as long as you cover the basic guidelines. You must submit original work, however, and a paper that returns as a large percentage of copy/paste to other sources will not be accepted. (Safe Assign will be used to track/monitor your submission for plagiarism.)
Please use APA formatting and include the following information:
Introduction/Background: Provide context for the research article. What led the author(s) to write the piece? What key concepts were explored? Were there weaknesses in prior research that led the author to the current hypothesis or research question?
Methodology: Describe how the data was gathered and analyzed. What research questions or hypotheses were the researcher trying to explore? What statistical analysis was used?
Study Findings and Results: What were the major findings from the study? Were there any limitations?
Conclusions: Evaluate the article in terms of significance, research methods, readability and the implications of the results. Does the piece lead into further study? Are there different methods you would have chosen based on what you read? What are the strengths and weaknesses of the article in terms of statistical analysis and application? (This is where a large part of the rubric is covered.)
References
.
You will research one womens movement that we have not discussed in.docxjustine1simpson78276
You will research one women's movement that we have not discussed in class. Include prominent leaders, prominent issues, challenge to the movement, outcomes of the movement and background information such as how the movement originated. This part must be
at least 1 page
in length and have
3 sources
cited related to your chosen movement. Make sure that they are "academic sources." That means, no wikipedia or other unverified sources. I will deduct MAJOR points for missing citations as it constitutes plagiarism! Include your citations after each essay.
.
You will research a Native American or African communitys culture, .docxjustine1simpson78276
You will research a Native American or African community's culture, oral tradition, religious texts, historical background, and current beliefs and practices.
If possible, interview a Native American or African, medicine man, shaman, or museum expert about that community. If you would like to take pictures during your visit to this community, museum, or place of worship be sure to obtain permission.
In a 15-20-slide presentation with slide notes (not including title slide and reference slide), address the following elements:
Name of the Native American community or African Tribal Religion and the historical religious beliefs and practices of that group.
How historical beliefs and religious practices have been influenced (positively or negatively) by the dominant surrounding culture. Include specific examples.
Current religious beliefs and practices and the part they play in the daily life of a typical member of the community.
Elements of the traditional religion that a Christian would need to consider when sharing the Christian faith/gospel with a person from this community.
Evaluation of the impact American or European policy has had on Native American or African Tribal Religion beliefs and practices.
How current and future governmental policies could impact personal beliefs and practices of that community in the future.
Be creative. Include a title slide, reference slide(s), and slide notes that provide detailed explanation of slide information.
Utilize the course textbook and a minimum of three additional academic resources, one of which can be your interview and should include topic materials and external resources.
.
You will receive 15 points extra credit (added to the homework p.docxjustine1simpson78276
You will receive 15 points extra credit (added to the homework portion of your grade) for locating and submitting a summary of a legal news article that was (1) published within the preceding year and (2) that
is relevant to one of the topics that we have previously covered in the course
(e.g., Torts, Contracts, Constitutional Law, Franchising, etc.). You may find appropriate legal news articles at findlaw.com, on the websites of many news organizations (i.e., the Associated Press, Reuters, the Los Angeles Times, NBC News, etc.), or from any other
reputable
online or print sources.
Your summary must:
Discuss facts of the legal news story
Explain how the news story relates to a topic previously discussed in class, and
Either attach a copy of the new story or provide a functioning link to the article online that will allow me to easily find it.
.
You will provide a short analysis of the interaction of group member.docxjustine1simpson78276
You will provide a short analysis of the interaction of group members that you observe in action. For example, You could go to a county courthouse to watch a celebrity's trial, or you could watch Court TV and follow the proceedings there. After you have completed your observation, write a short critique of what you have observed.
Briefly describe what group meeting you observed as well as where and when the meeting took place. [For example, "I observed the Killeen City Council meeting on October 1, 2015 at Killeen City Hall.]
What organizational plan was employed? [For example, Parliamentary Procedure was employed with the reading of the minutes, old business, new business, etc.]
How were the decisions made? [For example, majority rule, consensus, leader-dictated, etc.]
How was information about topics gathered? [For example, research was provided by group members, research was provided by staff or outsiders, or testimony was provided, etc]
Was there a formal designated leader? Did certain members seem to play particular roles and assume specific responsibilities? [For example, the Mayor was the leader of the City Council.]
Were there conflicts or disagreements between group members and/or outsiders and how were they resolved? [For example, some council members wanted to annex property into the city limits, while some other council members as well as the citizens testifying, were opposed. The council decided to discuss the issue in executive session.]
Did the group tend to digress (get off the topic)? Did someone get them back to the subject, and if so, who did so?
Did the group seem thorough and complete in its treatment of the subjects that it addressed?
Were the group members clear in expressing themselves by phrasing their ideas carefully and by presenting their ideas in a vivid manner?
Would you personally feel comfortable addressing this group? Why or why not? Explain.
.
You will produce and submit a Powerpoint of screenshots related to .docxjustine1simpson78276
You will produce and submit a Powerpoint of screenshots related to using a forensics tool. (Example : FTK Imager) The tool may be any software that captures cell phone or wireless network traffic. You will need to capture screen shots for:
Installation and Setup of a forensics tool on your computer (Minimum of 2 screenshots of this process)
Captured data using the forensics tool (Minimum of 4 screenshots of this process)
Reports from the captured data (Minimum of 3 screenshots)
.
You will produce a clear and coherent writing that is well organized.docxjustine1simpson78276
You will produce a clear and coherent writing that is well organized and edited. After reading and watching S.E. Hinton's "The Outsiders" and "Fences" by August Wilson.
In 350 words or more analyze the impact of the social norms of the 1950’s on the development of theme and character in both Fences and The Outsiders. Use at least two pieces of evidence to support your thinking. Make sure to cite correctly using MLA format. 16 points
Use this sentence format below (fill in the blank, but be clear on what you type):
The 1950’s were a turbulent time in American history. The nation was rapidly changing as were American values.[Three events that happened in the 1950’s that shaped American values]. Although this time is often thought of as a period of prosperity not every American benefited during that decade. In fact two texts written much later would utilize those tensions in a subtle way, to explore the ideas of ___Topic #1____ and ____Topic #2__.
Both The Outsiders and Fences deal with the topics of ____ and ____ by showing the development of their characters and build their themes through their actions and interactions.
Although both stories take place in different parts of America and deal with different ethnic groups they resoundingly share the same theme that in order for a family to stay together they must be willing to change and sacrifice
. A moment in __Title of text_____ that demonstrates this is when [Context for your evidence]“[Textual evidence” this [Analysis of text] (Citation). Similarly in ___Title & author____ there is a moment that _[synonym for displays]___ this theme when [Context for textual evidence].“[Textual evidence to support your claim” ]which shows [Analysis of textual evidence] (Citation). In addition this reinforces the social norm of the time that [Social norm shown in textual evidence].
On the other hand there are subtle differences between the texts when it comes to the topic of ___Topic #3___. In _Tiltle of text__ __Topic #3___ [claim about topic #3]. It is made clear to the reader that[claim about the differences between the text].[Contextualize the differences with an example]. [Reasoning for the different view on the topic]. The fierce 50’s are more than a half a century behind us but the themes and culture that emerged during that time can still be seen today.
.
You will present ADP and Paychex as the recommendations to the VP .docxjustine1simpson78276
You will present ADP and Paychex as the recommendations to the VP of the company. The assignment is to explain the following
1.How will they provide Payroll processing with a HR Integration Interface
2.How will they provide an appropriate report generation feature with both custom reporting and standard reporting features
.
You will prepare and present a personality analysis of your choo.docxjustine1simpson78276
You will prepare and present a personality analysis of your choosing. In 10-12 slides, address the following questions.
Choose a person to analyze. This can be a historical figure, a famous person (politician, celebrity, musician), or a fictional character from a book or other media. Just be sure you have enough information on this person’s personality and background to fully analyze them.
Describe this person’s personality in detail using language and concepts from the humanistic perspective.
Analyze this person from both Abraham Maslow’s humanistic perspective and Carl Rogers’s humanistic perspective. In other words, explain how this person’s personality would be described by each of those theorists. Explain how their personality developed the way it did, from Maslow's and Rogers’s perspectives.
If the person you described experiences psychological issues or psychopathology, explain how humanistic theory can be used to restore a state of health and psychological well-being to the person. In other words, if they suffer from anxiety, depression or other disorders, how would humanistic theorists like Maslow and Rogers help them overcome those disorders?
Include speaker notes below each content-related slide that represent what would be said if giving the presentation in person. Expand upon the information included in the slide and do not simply restate it. Please ensure the speaker notes include 50-75 words per slide.
.
you will prepare a PowerPoint presentation on the consumer infor.docxjustine1simpson78276
you will prepare a PowerPoint presentation on the consumer informatics pillar of health informatics including the e-patient movement (i.e., the widespread use of the Internet or other technologies that allows patients to have more participation in their medical care) and the Personal Health Record (PHR). Creating this week’s presentation will give you the opportunity to explore how participatory health care informatics is shaping patient-centered models of care.
Create your PowerPoint presentation with speaker notes that critically address each of the following elements. (Remember that your presentation slides should have short, bullet-pointed text with your speaker notes including the bulk of the information provided in the following list.)
Interpret the definition of consumer health informatics from national sources such as the Agency for Healthcare Research and Quality (AHRQ), the American Medical Informatics Association (AMIA), etc.
Compare and contrast the roles of patient, consumer, caregiver, and professional in consumer informatics.
Analyze health literacy’s role in the success of consumer informatics.
Analyze the role of the e-patient movement and the PHR in effecting health care change.
Examine how participatory health care informatics is shaping patient-centered models of care.
Compare and contrast two examples of consumer informatics applications of your choosing. (Examples could be those found on the Internet or those you’ve encountered in your personal life.)
You may wish to include visual enhancements in your presentation. These may include appropriate images, a consistent font, appropriate animations, and transitions from content piece to content piece and slide to slide.
Must be five to seven slides with speaker notes (not including the title and references slides) and formatted according to APA style
Must use at least three scholarly sources in addition to the course text.
Must include a separate references slide that is formatted according to APA style
Due Saturday 11/7/2020
.
You will post a 250-word reply to 2 classmate’s threads. The reply r.docxjustine1simpson78276
You will post a 250-word reply to 2 classmate’s threads. The reply requires a minimum of 1 properly formatted citation. Each reply must be completed by you, the individual student. Additionally, each thread and reply must reflect a solid Christian worldview through the use of at least 1 Holy Bible reference.
EUGENE
In reviewing this week’s reading material, Kouzes and Posner’s (2017) argument for the importance of enabling others to act, fostering collaboration, and strengthening others reminded me of Deci and Ryan’s (1985) self-determination theory. I have routinely come back to this theory throughout my coursework as the principles within it seem to fit many different molds, specifically leadership and motivation. The topic of motivation and police officers has become an area of interest due in part to research showing the unique nature of being a police officer, to include internal and external stressors that are seldom experienced by any other profession (Accquadro Maran, Zedda, Varetto & Ieraci, 2015). Deci and Ryan’s (1985) self-determination theory simply says that in order for humans to feel motivated to perform they must have a sense of autonomy, competence, and relatedness. I find that Kouzes and Posner’s (2017) concept of enabling others to act and fostering collaborations meld perfectly with providing people with a sense of autonomy. Leaders, especially front-line supervisors within law enforcement organizations, have a dramatic impact on the autonomy of officers. I have seen first-hand how front-line leadership can restrict the decision-making process so much that they drain the officer’s motivation which leads to them not wanting to act and foster any sort of collaboration with the organization. Having the confidence as a leader to step back and allow others to make decisions is a worthy investment. While not every situation will allow for this, leaders must learn to create environments in which their people can be successful and allow them to make decisions. This level of confidence is not learned overnight, and I have struggled with this myself. However, once I observed the benefits of allowing officers to make their own decisions, obviously within the guidelines of our policies, they feel more connected and confident in their ability to solve problems. If we look at Deci and Ryan’s (1985) argument for competence, this aligns with Kouzes and Posner’s (2017) argument for strengthening others. Competence, or having the ability to complete the task at hand, comes down to proper training which strengthens others and allows them to complete their job more effectively and with confidence. Failure to strengthen others can, and will, result in stagnation due to a lack of motivation to perform. Leadership is a challenging process that takes time to learn and understand. This process can certainly be daunting, however just as Proverbs 3:5 (English Standard Version, 2020) reads, “Trust in the Lord with all your heart, and do not lean .
How to Split Bills in the Odoo 17 POS ModuleCeline George
Bills have a main role in point of sale procedure. It will help to track sales, handling payments and giving receipts to customers. Bill splitting also has an important role in POS. For example, If some friends come together for dinner and if they want to divide the bill then it is possible by POS bill splitting. This slide will show how to split bills in odoo 17 POS.
We all have good and bad thoughts from time to time and situation to situation. We are bombarded daily with spiraling thoughts(both negative and positive) creating all-consuming feel , making us difficult to manage with associated suffering. Good thoughts are like our Mob Signal (Positive thought) amidst noise(negative thought) in the atmosphere. Negative thoughts like noise outweigh positive thoughts. These thoughts often create unwanted confusion, trouble, stress and frustration in our mind as well as chaos in our physical world. Negative thoughts are also known as “distorted thinking”.
Palestine last event orientationfvgnh .pptxRaedMohamed3
An EFL lesson about the current events in Palestine. It is intended to be for intermediate students who wish to increase their listening skills through a short lesson in power point.
The Indian economy is classified into different sectors to simplify the analysis and understanding of economic activities. For Class 10, it's essential to grasp the sectors of the Indian economy, understand their characteristics, and recognize their importance. This guide will provide detailed notes on the Sectors of the Indian Economy Class 10, using specific long-tail keywords to enhance comprehension.
For more information, visit-www.vavaclasses.com
Synthetic Fiber Construction in lab .pptxPavel ( NSTU)
Synthetic fiber production is a fascinating and complex field that blends chemistry, engineering, and environmental science. By understanding these aspects, students can gain a comprehensive view of synthetic fiber production, its impact on society and the environment, and the potential for future innovations. Synthetic fibers play a crucial role in modern society, impacting various aspects of daily life, industry, and the environment. ynthetic fibers are integral to modern life, offering a range of benefits from cost-effectiveness and versatility to innovative applications and performance characteristics. While they pose environmental challenges, ongoing research and development aim to create more sustainable and eco-friendly alternatives. Understanding the importance of synthetic fibers helps in appreciating their role in the economy, industry, and daily life, while also emphasizing the need for sustainable practices and innovation.
Unit 8 - Information and Communication Technology (Paper I).pdfThiyagu K
This slides describes the basic concepts of ICT, basics of Email, Emerging Technology and Digital Initiatives in Education. This presentations aligns with the UGC Paper I syllabus.
The Art Pastor's Guide to Sabbath | Steve ThomasonSteve Thomason
What is the purpose of the Sabbath Law in the Torah. It is interesting to compare how the context of the law shifts from Exodus to Deuteronomy. Who gets to rest, and why?
GIÁO ÁN DẠY THÊM (KẾ HOẠCH BÀI BUỔI 2) - TIẾNG ANH 8 GLOBAL SUCCESS (2 CỘT) N...
ANOVA is a hypothesis testing technique used to compare the equali.docx
1. ANOVA is a hypothesis testing technique used to compare the
equality of means for two or more groups; for example, it can
be used to test that the mean number of computer chips
produced by a company on each of the day, evening, and night
shifts is the same. Give an example of an application of
ANOVA in an industrial, operations, or manufacturing setting
that is different from the examples provided in the overview.
Discuss and share this information with your classmates.
In responding to your peers, select responses that use an
ANOVA application that is different from your own. Are the
results of the ANOVA application statistically significant? Why
are the results significant or not significant? Explain your
reasoning. Consider how ANOVA could be applied to the final
project case study.
Support your initial posts and response posts with scholarly
sources cited in APA style.
https://statistics4beginners.wordpress.com/2015/02/18/how-to-
calculate-anova-in-excel-2013/
PLEASE GIVE A 1-2 PARAGRAPH RESPONSE TO THE
FOLLOWING:
1.
In this module, our goal is to learn the statistical process of
comparing several population means through a procedure called
"analysis of variance", or ANOVA. ANOVA uses the variance
from the mean of 2 or more sample populations to see if there is
a statistically significant difference between them (Sharpe,
DeVeaux, Velleman, 2016). We've learned that this is a
valuable tool in all sorts of areas of study, including
automotive, chemical, and medical industries.
2. There are many practical examples of ANOVA throughout
business. As previously mentioned, the medical field can
benefit from the use of this statistics tool. For example, a drug
company may be interested in the results of clinical trials for a
few new drugs they plan to release. Medicine A, B, and C are
all now in the clinical testing phase, so the instances in which
each cures a specific ailment can be summed up using ANOVA.
Each of the individual drugs, through the course of multiple
trials, will have a number of "cured" patients. The following is
an example of what the results may be, in table format:
A B
C
Trial 1 4 9
2
2 5 8
7
3 7 1
6
4 6 1
5
5 6 4
9
Using ANOVA to evaluate the variance from the mean for each
trial, the ultimate goal would be to compare each trial to one
another. By comparing the variance, we can say, with statistical
confidence, that one medicine may be more effective than the
other two. This sort of analysis would help the company decide
which of the medicines to push to the consumer markets.
Citations
Sharpe, N. D., DeVeaux, R. D., & Velleman, P. (2016).
Business Statistics (Third ed.). Retrieved from
3. https://view.ebookplus.pearsoncmg.com/ebook
2.
Going back to my module 3 and module 5 discussion post
examples, I work within the IT department of a large company.
We are forming new software development teams using agile
development practices. We want to better understand if the
make-up of the team has any impact to the number of defects
that are produced per 1000 lines of code. We want to see If the
mean number of defects per 1000 lines of code is different for a
development team with a senior developer and a senior tester,
one with a junior developer and a senior tester, one with a
senior developer and a junior tester, and one with both a junior
developer and junior tester.
In order to determine if the mean number of bugs found per
1000 lines of code is different for these four types of teams, we
would use ANOVA analysis and use a sampling of the last 15
projects that each type of team has worked on and we gather the
number of defects per 1000 lines of codes for each of these
projects. Our hypothesis is that of the four project team types at
least one of the means of bugs per 1000 lines of code is
different from the other teams. The first step would be to create
a box plot of the results of the four teams’ bugs per 1000 lines
of code. Next, we can perform an ANOVA analysis on the
results using a 5% significance level. If we find that the p-value
is smaller than the significance level, we can reject the null
hypothesis that means of the four teams are the same.
Additionally, per Statistics For Beginners (2015), "if the F > F
crit, we reject the null hypothesis. The means of
the…populations are not equal."
4. References:
Statistics For Beginners. (2015, February 18). How To
Calculate ANOVA (ONE WAY ANOVA) IN EXCEL 2013.
Retrieved
from https://statistics4beginners.wordpress.com/2015/02/18/ho
w-to-calculate-anova-in-excel-2013/
QSO 510 Scenario Analysis Guidelines and Rubric
Knowledge of statistics is important foundational knowledge for
analyzing data. Equally important is what you can do with that
information. An overarching goal
of this course is to consider how statistics informs decision
making, or data-based decision making. Throughout this course,
you will be asked to make decisions
and then to consider the impact of those choices. Whether in
stock trading, in car sales, or on the production floor, the
decisions you make as a business
professional should be directly influenced by the data available
to you. Careful analysis is the key to data-based decision
making.
Each module task below provides a scenario and a list of
questions for you to answer using data-based decision making.
5. Specifically, the following critical elements must be addressed:
I. Main Elements
II. Integration and Application
III. Analysis
IV. Critical Thinking
Guidelines for Submission: Your analysis of the scenario must
be submitted as a 1- to 2-page Microsoft Word document with
double spacing and 12-point Times
New Roman font.
Instructor Feedback: This activity uses an integrated rubric in
Blackboard. Students can view instructor feedback in the Grade
Center. For more information,
review these instructions.
http://snhu-
media.snhu.edu/files/production_documentation/formatting/rubr
ic_feedback_instructions_student.pdf
6. Rubric
Critical Elements Exemplary (100%) Proficient (90%) Needs
Improvement (70%) Not Evident (0%) Value
Main Elements Thoroughly addresses each of the
main elements found in the
individual prompts and guiding
questions for each scenario
Adequately addresses all of the
main elements found in the
individual prompts and guiding
questions for each scenario
Addresses most but not all of the
main elements found in the
individual prompts and guiding
questions for scenario
Addresses less than half of the
main elements found in the
individual prompts or guiding
questions for each scenario
20
Integration and
Application
All of the course concepts are
correctly applied
Most of the course concepts are
correctly applied
7. Some of the course concepts are
correctly applied
Does not correctly apply any of
the course concepts
20
Analysis Meets “Proficient” and the
quality of the statistical analysis
is above minimum quality
standards for competent
Represents competency with
respect to the statistical analysis
Statistical analysis is evident, but
does not meet standards
Statistical analysis is not evident 40
Critical Thinking Draws insightful conclusions that
are thoroughly defended with
peer-reviewed evidence and
examples
Draws informed conclusions that
are justified with evidence based
on peer-reviewed research
Draws logical conclusions, but
does not defend with evidence
based on peer-reviewed research
Does not draw logical conclusions 10
8. Articulation of
Response
Submission is free of errors
related to citations, grammar,
spelling, syntax, and organization
and is presented in a professional
and easy to read format
Submission has no major errors
related to citations, grammar,
spelling, syntax, or organization
Submission has major errors
related to citations, grammar,
spelling, syntax, or organization
that negatively impact readability
and articulation of main ideas
Submission has critical errors
related to citations, grammar,
spelling, syntax, or organization
that prevent understanding of
ideas
10
Earned Total 100%
9. QSO 510 Module Ten 1
Module Nine explored sources of process variation and the use
of control charts to eliminate
unusual sources of variation to ensure that an operations process
is “on control.” Module
Ten introduces decision making under uncertainty and risk
along with payoff tables and
decision trees as vehicles to facilitate decision making.
In making decisions, one considers alternative courses of
action, states of nature that are
naturally occurring events not controlled by the decision maker,
and the potential payoffs
(usually monetary rewards, sometimes costs) from each course
of action. For example, a
new college graduate may consider two alternative courses of
action: a job offer in Houston,
Texas, and a job offer in New York City. She may encounter
two states of nature: a low cost
of living (COL) and a high cost of living. The payoffs, the
monetary values of the job offers in
each city considering the COL, are shown in the payoff table
below.
States of Nature
Actions Low COL High COL
Job Offer Houston $80,000 95,000
Job Offer New York
City
10. 74,000 140,000
The decision maker may face conditions of uncertainty or risk
in making her decision. Under
uncertainty, insufficient information exists to assign
probabilities to the state of nature. A
decision is made based on the decision maker’s optimism or
pessimism about the cost of
living. The pessimist will use the maximin strategy to make a
decision. The optimist will
make a decision using the maximax strategy.
Using the maximax strategy, the maximum payoff from each
alternative course of action is
chosen and the maximum of those maximums is selected. Based
on the table above, the
maximum payoff from the Houston job offer is $95,000 and the
maximum payoff from the
New York City offer is $140,000. The maximum of those two
payoffs is $140,000. The
decision maker should select New York City with a potential
payoff of $140,000.
Using the maximin strategy of the pessimist, the minimum
payoff from each alternative
course of action is chosen and the maximum of those minimums
is selected. Using the table
above, the minimum payoff from the Houston job offer is
$80,000 and the minimum payoff
from the New York City offer is $74.000. The maximum of
those two payoffs is $80,000. The
decision maker should select Houston with a potential payoff of
$80,000.
11. 2 QSO 510 Module Ten
Under risk, either historical probabilities or subjective
probabilities can be assigned to the
state of nature. Using the prior year’s COL published indices,
the probability of a low COL is
0.4 and the probability of a high COL is 0.6. Using the expected
value (EV) criterion and
applying these probabilities provides the following results:
EV(Houston) = 0.4(80,000) + 0.6(95,000) = $89,000
EV(NYC) = 0.4(74,000) + 0.6(140,000) = $113,600
The decision maker should select the New York City offer with
an expected value of
$113,600.
Consider some additional examples of decision making. An oil
pump manufacturer has to
make a decision to purchase pistons used in the pumps or
manufacture them in the
company’s machine shop. The decision will be made given two
states of nature, sales are
low or sales are high for the oil pumps with potential profits
from each option. A sales
manager who travels to a nearby city for business must decide
to travel by train or by plane.
The final decision considers the cost of each option and two
states of nature, inclement
12. weather or good weather on that day.
QSO 510 Module Eight 1
Module Seven compared several population means through a
statistical procedure called
analysis of variance (ANOVA). Module Eight introduces
contingency tables to summarize
categorical data and a chi-square test for the independence of
two categorical sets of data.
The previous modules of this course considered data that is
quantitative and measurable.
This module examines count data that falls into categories, or
classes. Count data can be
summarized with the use of contingency tables. A contingency
table displays counts for two
variables measured on a nominal level of measurement. You
may recall that nominal data is
count data with no natural order to the categories. For example,
a business school dean
may categorize accounting graduates by gender and whether or
not they have passed the
certified public accountant (CPA) examinations. That data is
summarized in the following
contingency table:
Gender Passed CPA
Exam
13. Did Not Pass CPA
Exam
Total
Male 7 3 10
Female 12 2 14
Total 19 5 24
Related to contingency tables is the chi-square test of
independence for two categorical
variables. Consider the following examples:
operates two shifts, a day
shift and an evening shift. A chi-square may be used to verify
that productivity of
fertilizer is independent of the shift on which it was
manufactured.
their satisfaction with
the benefits offered by the company. Employees surveyed are
paid hourly or salaried
and their satisfaction is categorized as satisfied, neutral, or
dissatisfied. The manager
14. may use a chi-square test to verify that employee satisfaction
with the benefits offered
is independent of the type of pay for these employees.
concerned about the use of
cell phones in motor vehicles and its effect on the number of
accidents in the city. A
chi-square test may show that cell phone use in a vehicle is
independent or has no
effect on the accident rate in that city.
turer of athletic shoes receives materials required
to make the shoes from
four suppliers. Athletic shoes are categorized as acceptable or
unacceptable. The
2 QSO 510 Module Eight
company’s quality control manager may use a chi-square test to
determine whether
the acceptability of the athletic shoes is related to the supplier
of the component
materials.
15. Hypotheses that accompany a chi-square test of independence
include a null hypothesis of
independence between two categorical variables and an
alternative hypothesis that a
relationship exists between the two categorical variables. As
Module Eight will show, the chi-
square test is useful for establishing the independence of two
variables that cannot be
quantified and measured, nor analyzed by the traditional
correlation coefficient.
QSO 510 Module Seven 1
Module Six introduced hypotheses and hypothesis testing on a
single population mean.
Module Seven compares several population means through a
statistical procedure called
analysis of variance (ANOVA). One-way ANOVA, also referred
to as one-factor ANOVA or
completely randomized design, is a part of Design of
Experiments, a larger subset of
statistics used extensively in the automotive, chemical, and
medicinal drug industries.
How does the ANOVA test work? To determine whether the
various sample means came
from a single population or populations with different means,
you actually compare these
sample means through their variances. For example, a general
16. manager of a chemical plant
may wish to determine whether a difference exists in the annual
salaries of his shift
supervisors, assistant plant managers, and maintenance
managers. Within-group variation
exists among salaries in each of the three groups, and between-
group variation is present
across the three groups. ANOVA uses a ratio of between-group
variation to within-group
variation to form an F statistic. If the F statistic results in a p
value that is less than or equal
to a given significance level (typically 5%), then he may
conclude that the salaries of shift
supervisors, assistant plant managers, and maintenance
managers are significantly
different. If the p value exceeds the significance level, then the
annual salaries of the three
groups are not significantly different.
Note that probability computation for an F statistic is based on
an F distribution. There is not
a single F distribution but a family of F distributions. A
particular member of the family is
determined by two parameters: the degrees of freedom in the
numerator and the degrees of
freedom in the denominator.
Consider another example of ANOVA. A professor taught four
small sections of Quantitative
Analysis last semester, which resulted in the following data on
student scores by section:
Section 1 Section 2 Section 3 Section 4
94 75 70 68
17. 90 68 73 70
85 77 76 72
80 83 78 65
88 80 74
68 65
65
2 QSO 510 Module Seven
The professor would like to know whether there is a difference
in the mean scores for
students in the four sections. Using statistical software to
analyze the data with ANOVA
provides the following results:
ANOVA
Source of
Variation SS df MS F P value F crit
Between
Groups 440.4933 3 146.8311 2.530122 0.089662 3.159908
Within
Groups 1044.598 18 58.0332
18. Total 1485.091 21
Note that F = 2.53 and p = 0.089662. At a significance level of
0.05, H0 will not be rejected
and we conclude that the mean scores of students in the four
sections of the course are not
significantly different.
Additional applications of ANOVA may include a researcher
using ANOVA to test for a
difference in the effectiveness of three drugs in treating
Alzheimer’s disease. Or, an
automotive engineer may use ANOVA to test for a difference in
three fuel blends on the
performance of the company’s new engine. An operations
manager may use ANOVA to test
for a difference in delivery times for the company’s products
over four routes.
8-2 Scenario Analysis: Promotion
You volunteer some of your spare time to your local fire
department and have been asked by an assistant chief to analyze
data on firefighters who applied for promotion. The assistant
chief wants to ensure that gender bias is not a concern in the
promotion of firefighters. Shown below is data for 50
firefighters who applied for promotion and the results of a chi-
square analysis of the data.
Male
Female
19. Promoted
13
22
Not Promoted
10
5
Chi-Square Statistic
3.6845
P value
0.054919
1 What factors should the assistant chief consider in
determining the presence of gender bias in firefighter
promotion?
2 Is the promotional status of recently promoted firefighters
independent of their gender?
3 What reasons should the assistant chief convey to the fire
chief to justify the absence of gender bias in the most recent
class of firefighters who were promoted?
4 How might the presence of gender bias in promotions impact
the fire department?
For additional details, please refer to the Scenario Analysis
Guidelines and Rubric document in the Assignment Guidelines
and Rubrics section of the course.
http://researchbasics.education.uconn.edu/anova_regression_and
_chi-square/
10-2 Scenario Analysis: Printing Equipment
The owner of a small printing company is considering the
purchase of additional printing equipment to expand her
business. If the owner expands the business and sales are high,
projected profits (minus the cost of the equipment) should be
$90,000; if sales are low, projected profits should be $40,000. If
the equipment is not purchased, projected profits should be
20. $70,000 if sales are high and $50,000 if sales are low.
1. Are there options other than the purchase of additional
equipment that should be considered in making the decision to
expand the business?
2. If the owner is optimistic about the company’s future sales,
should the company expand by purchasing the equipment?
3. Is the owner’s optimism or pessimism about sales the only
factor that may impact the company’s profits?
4. The equipment to be purchased is known in the industry to
have a useful life of five years. How might this impact the
printing company?
For additional details, please refer to the Scenario Analysis
Guidelines and Rubric document in the Assignment Guidelines
and Rubrics section of the course.
http://www.public.asu.edu/~kirkwood/DAStuff/decisiontrees/ind
ex.html
https://web.archive.org/web/20140808023036/http://www.pm-
primer.com/decision-tree-risk-analysis/
https://www.mindtools.com/dectree.html
1-2-page double space Time New Roman Font. APA citation.