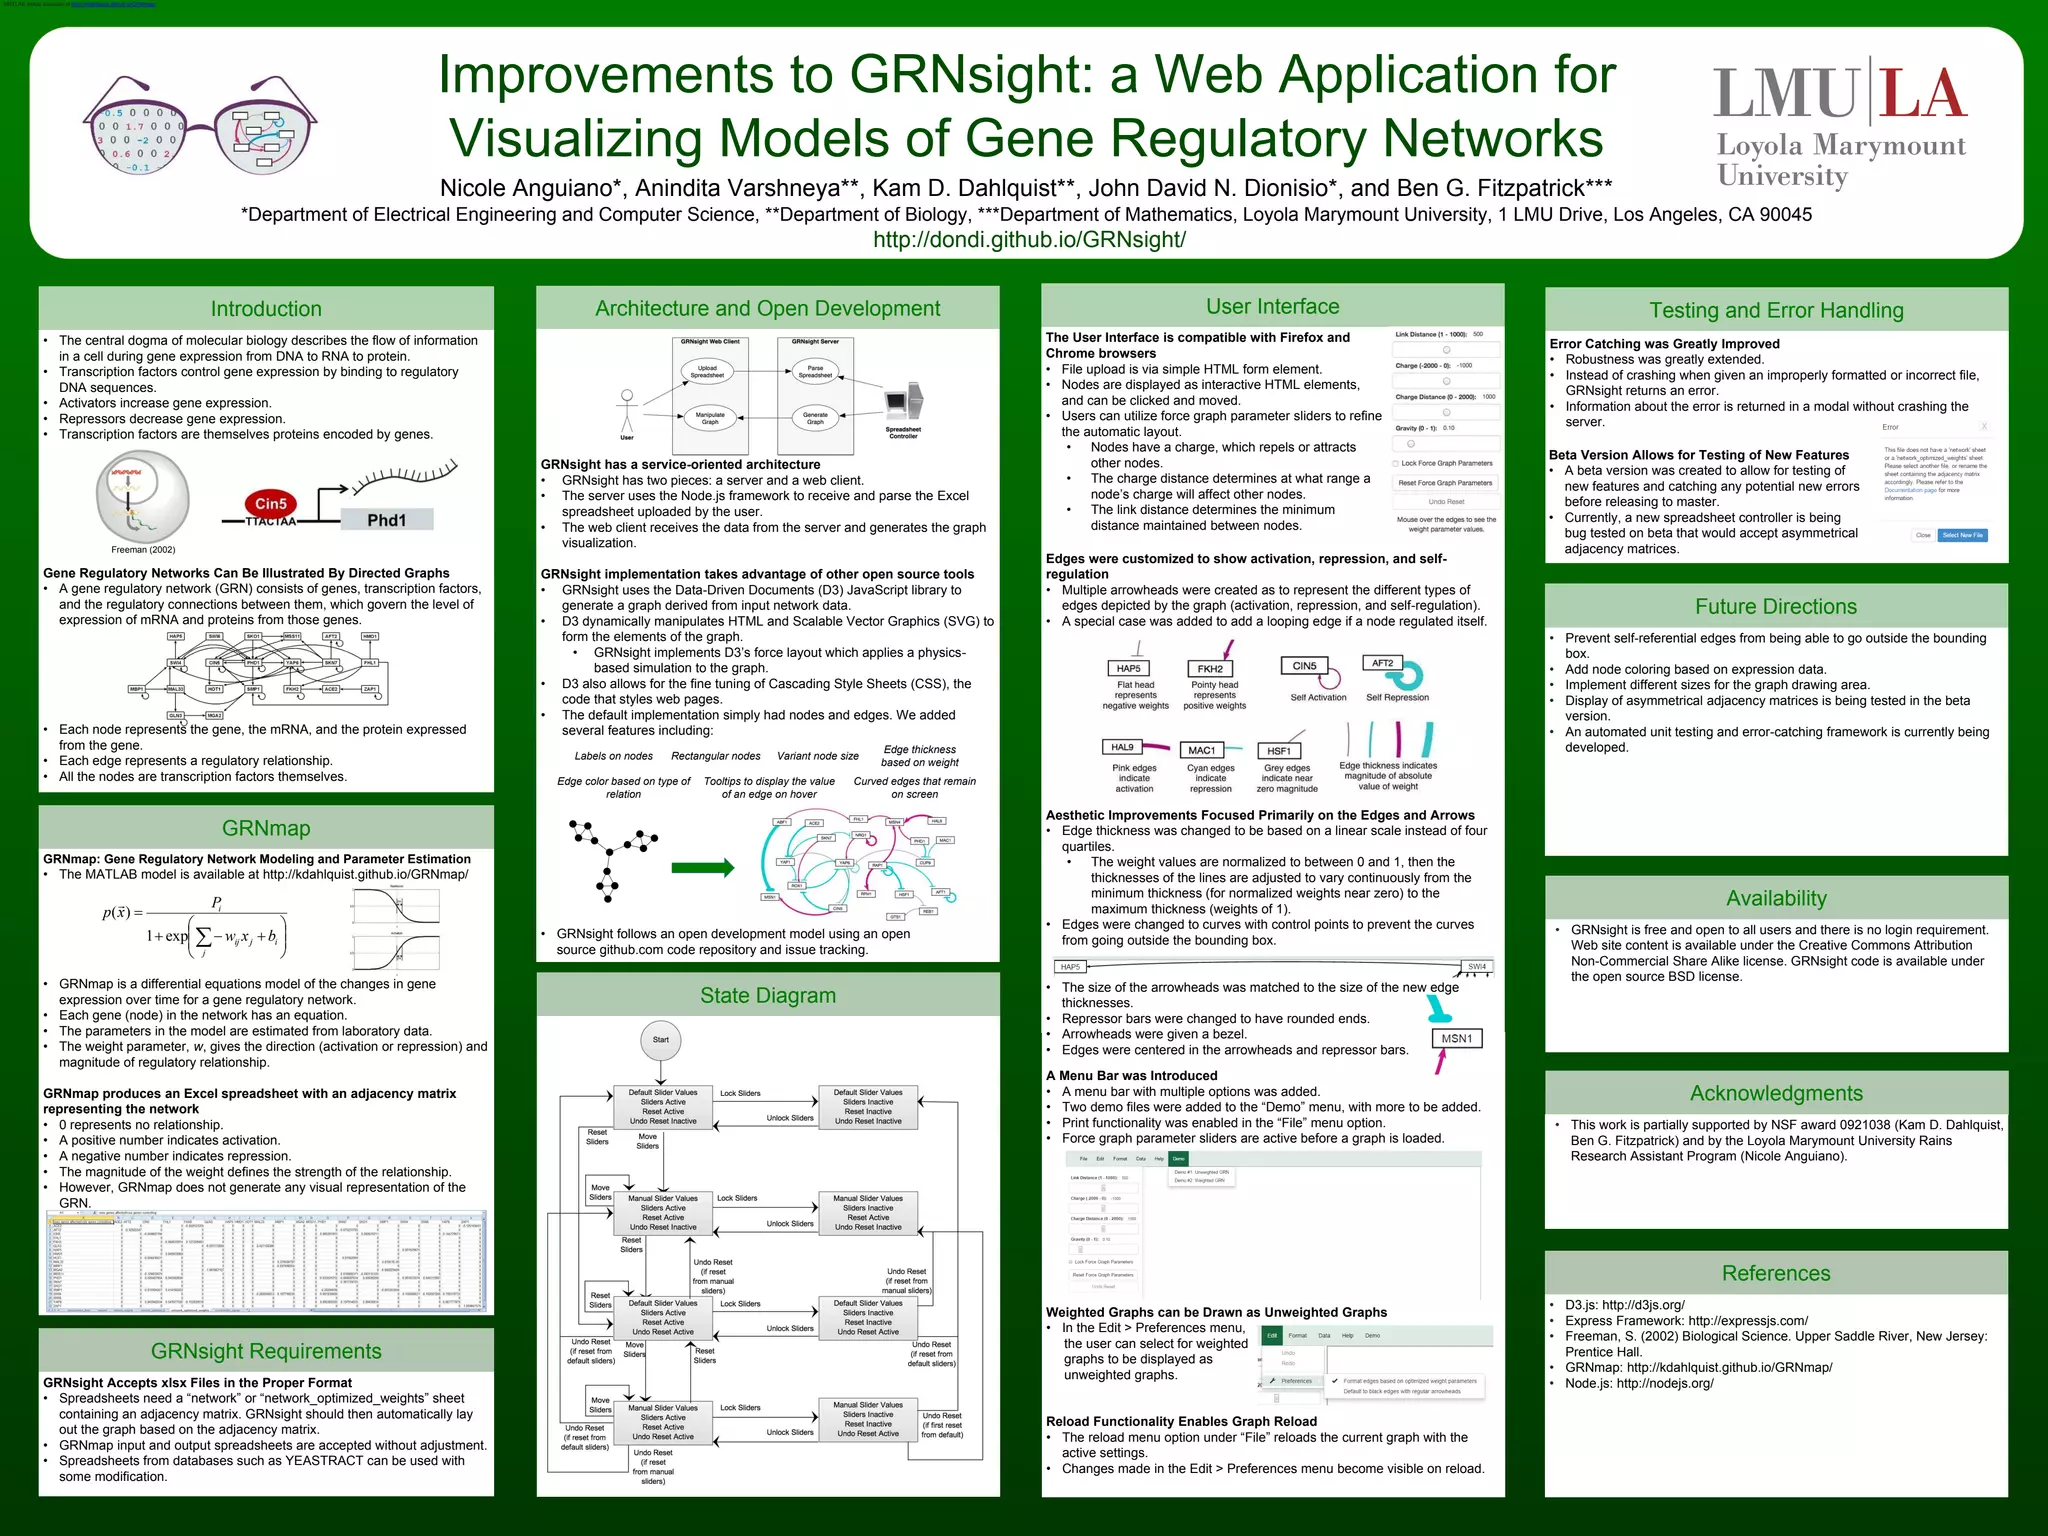
Improvements to GRNsight: a Web Application for 
Visualizing Models of Gene Regulatory Networks 
Nicole Anguiano*, Anindita Varshneya**, Kam D. Dahlquist**, John David N. Dionisio*, and Ben G. Fitzpatrick*** 
*Department of Electrical Engineering and Computer Science, **Department of Biology, ***Department of Mathematics, Loyola Marymount University, 1 LMU Drive, Los Angeles, CA 90045 
http://dondi.github.io/GRNsight/ 
Introduction 
GRNsight has a service-oriented architecture 
• GRNsight has two pieces: a server and a web client. 
• The server uses the Node.js framework to receive and parse the Excel 
spreadsheet uploaded by the user. 
• The web client receives the data from the server and generates the graph 
visualization. 
GRNsight implementation takes advantage of other open source tools 
• GRNsight uses the Data-Driven Documents (D3) JavaScript library to 
generate a graph derived from input network data. 
• D3 dynamically manipulates HTML and Scalable Vector Graphics (SVG) to 
form the elements of the graph. 
• GRNsight implements D3’s force layout which applies a physics-based 
simulation to the graph. 
• D3 also allows for the fine tuning of Cascading Style Sheets (CSS), the 
code that styles web pages. 
• The default implementation simply had nodes and edges. We added 
several features including: 
• GRNsight follows an open development model using an open 
source github.com code repository and issue tracking. 
• The central dogma of molecular biology describes the flow of information 
in a cell during gene expression from DNA to RNA to protein. 
• Transcription factors control gene expression by binding to regulatory 
DNA sequences. 
• Activators increase gene expression. 
• Repressors decrease gene expression. 
• Transcription factors are themselves proteins encoded by genes. 
Freeman (2002) 
Gene Regulatory Networks Can Be Illustrated By Directed Graphs 
• A gene regulatory network (GRN) consists of genes, transcription factors, 
and the regulatory connections between them, which govern the level of 
expression of mRNA and proteins from those genes. 
• Each node represents the gene, the mRNA, and the protein expressed 
from the gene. 
• Each edge represents a regulatory relationship. 
• All the nodes are transcription factors themselves. 
GRNmap: Gene Regulatory Network Modeling and Parameter Estimation 
• The MATLAB model is available at http://kdahlquist.github.io/GRNmap/ 
 
 
   
 
• GRNmap is a differential equations model of the changes in gene 
expression over time for a gene regulatory network. 
• Each gene (node) in the network has an equation. 
• The parameters in the model are estimated from laboratory data. 
• The weight parameter, w, gives the direction (activation or repression) and 
magnitude of regulatory relationship. 
GRNmap produces an Excel spreadsheet with an adjacency matrix 
representing the network 
• 0 represents no relationship. 
• A positive number indicates activation. 
• A negative number indicates repression. 
• The magnitude of the weight defines the strength of the relationship. 
• However, GRNmap does not generate any visual representation of the 
GRN. 
GRNmap 
GRNsight Requirements 
GRNsight Accepts xlsx Files in the Proper Format 
• Spreadsheets need a “network” or “network_optimized_weights” sheet 
containing an adjacency matrix. GRNsight should then automatically lay 
out the graph based on the adjacency matrix. 
• GRNmap input and output spreadsheets are accepted without adjustment. 
• Spreadsheets from databases such as YEASTRACT can be used with 
some modification. 
Architecture and Open Development 
Labels on nodes Rectangular nodes Variant node size 
Edge thickness 
based on weight 
State Diagram 
Testing and Error Handling 
Error Catching was Greatly Improved 
• Robustness was greatly extended. 
• Instead of crashing when given an improperly formatted or incorrect file, 
GRNsight returns an error. 
• Information about the error is returned in a modal without crashing the 
Beta Version Allows for Testing of New Features 
• A beta version was created to allow for testing of 
new features and catching any potential new errors 
before releasing to master. 
• Currently, a new spreadsheet controller is being 
bug tested on beta that would accept asymmetrical 
adjacency matrices. 
Future Directions 
server. 
• Prevent self-referential edges from being able to go outside the bounding 
Acknowledgments 
References 
box. 
• Add node coloring based on expression data. 
• Implement different sizes for the graph drawing area. 
• Display of asymmetrical adjacency matrices is being tested in the beta 
version. 
• An automated unit testing and error-catching framework is currently being 
developed. 
A Menu Bar was Introduced 
• A menu bar with multiple options was added. 
• Two demo files were added to the “Demo” menu, with more to be added. 
• Print functionality was enabled in the “File” menu option. 
• Force graph parameter sliders are active before a graph is loaded. 
Availability 
• GRNsight is free and open to all users and there is no login requirement. 
Web site content is available under the Creative Commons Attribution 
Non-Commercial Share Alike license. GRNsight code is available under 
the open source BSD license. 
• This work is partially supported by NSF award 0921038 (Kam D. Dahlquist, 
Ben G. Fitzpatrick) and by the Loyola Marymount University Rains 
Research Assistant Program (Nicole Anguiano). 
• D3.js: http://d3js.org/ 
• Express Framework: http://expressjs.com/ 
• Freeman, S. (2002) Biological Science. Upper Saddle River, New Jersey: 
Prentice Hall. 
• GRNmap: http://kdahlquist.github.io/GRNmap/ 
• Node.js: http://nodejs.org/ 
MATLAB model available at http://kdahlquist.github.io/GRNmap/ 
Edge color based on type of 
relation 
Tooltips to display the value 
of an edge on hover 
Curved edges that remain 
on screen 
User Interface 
The User Interface is compatible with Firefox and 
Chrome browsers 
• File upload is via simple HTML form element. 
• Nodes are displayed as interactive HTML elements, 
and can be clicked and moved. 
• Users can utilize force graph parameter sliders to refine 
the automatic layout. 
• Nodes have a charge, which repels or attracts 
other nodes. 
• The charge distance determines at what range a 
node’s charge will affect other nodes. 
• The link distance determines the minimum 
distance maintained between nodes. 
• Sliders can be locked to prevent changes. 
Edges were customized to show activation, repression, and self-regulation 
• Multiple arrowheads were created as to represent the different types of 
edges depicted by the graph (activation, repression, and self-regulation). 
• A special case was added to add a looping edge if a node regulated itself. 
Aesthetic Improvements Focused Primarily on the Edges and Arrows 
• Edge thickness was changed to be based on a linear scale instead of four 
quartiles. 
• The weight values are normalized to between 0 and 1, then the 
thicknesses of the lines are adjusted to vary continuously from the 
minimum thickness (for normalized weights near zero) to the 
maximum thickness (weights of 1). 
• Edges were changed to curves with control points to prevent the curves 
from going outside the bounding box. 
• The size of the arrowheads was matched to the size of the new edge 
thicknesses. 
• Repressor bars were changed to have rounded ends. 
• Arrowheads were given a bezel. 
• Edges were centered in the arrowheads and repressor bars. 
Weighted Graphs can be Drawn as Unweighted Graphs 
• In the Edit > Preferences menu, 
the user can select for weighted 
graphs to be displayed as 
unweighted graphs. 
Reload Functionality Enables Graph Reload 
• The reload menu option under “File” reloads the current graph with the 
active settings. 
• Changes made in the Edit > Preferences menu become visible on reload. 
 
 
 
 
 
 
 
 
j 
ij j i 
i 
b x w 
P 
x p 
ex p 1 
( )

Anguiano varshneya sccur-poster_20141122

  • 1.
    Improvements to GRNsight:a Web Application for Visualizing Models of Gene Regulatory Networks Nicole Anguiano*, Anindita Varshneya**, Kam D. Dahlquist**, John David N. Dionisio*, and Ben G. Fitzpatrick*** *Department of Electrical Engineering and Computer Science, **Department of Biology, ***Department of Mathematics, Loyola Marymount University, 1 LMU Drive, Los Angeles, CA 90045 http://dondi.github.io/GRNsight/ Introduction GRNsight has a service-oriented architecture • GRNsight has two pieces: a server and a web client. • The server uses the Node.js framework to receive and parse the Excel spreadsheet uploaded by the user. • The web client receives the data from the server and generates the graph visualization. GRNsight implementation takes advantage of other open source tools • GRNsight uses the Data-Driven Documents (D3) JavaScript library to generate a graph derived from input network data. • D3 dynamically manipulates HTML and Scalable Vector Graphics (SVG) to form the elements of the graph. • GRNsight implements D3’s force layout which applies a physics-based simulation to the graph. • D3 also allows for the fine tuning of Cascading Style Sheets (CSS), the code that styles web pages. • The default implementation simply had nodes and edges. We added several features including: • GRNsight follows an open development model using an open source github.com code repository and issue tracking. • The central dogma of molecular biology describes the flow of information in a cell during gene expression from DNA to RNA to protein. • Transcription factors control gene expression by binding to regulatory DNA sequences. • Activators increase gene expression. • Repressors decrease gene expression. • Transcription factors are themselves proteins encoded by genes. Freeman (2002) Gene Regulatory Networks Can Be Illustrated By Directed Graphs • A gene regulatory network (GRN) consists of genes, transcription factors, and the regulatory connections between them, which govern the level of expression of mRNA and proteins from those genes. • Each node represents the gene, the mRNA, and the protein expressed from the gene. • Each edge represents a regulatory relationship. • All the nodes are transcription factors themselves. GRNmap: Gene Regulatory Network Modeling and Parameter Estimation • The MATLAB model is available at http://kdahlquist.github.io/GRNmap/       • GRNmap is a differential equations model of the changes in gene expression over time for a gene regulatory network. • Each gene (node) in the network has an equation. • The parameters in the model are estimated from laboratory data. • The weight parameter, w, gives the direction (activation or repression) and magnitude of regulatory relationship. GRNmap produces an Excel spreadsheet with an adjacency matrix representing the network • 0 represents no relationship. • A positive number indicates activation. • A negative number indicates repression. • The magnitude of the weight defines the strength of the relationship. • However, GRNmap does not generate any visual representation of the GRN. GRNmap GRNsight Requirements GRNsight Accepts xlsx Files in the Proper Format • Spreadsheets need a “network” or “network_optimized_weights” sheet containing an adjacency matrix. GRNsight should then automatically lay out the graph based on the adjacency matrix. • GRNmap input and output spreadsheets are accepted without adjustment. • Spreadsheets from databases such as YEASTRACT can be used with some modification. Architecture and Open Development Labels on nodes Rectangular nodes Variant node size Edge thickness based on weight State Diagram Testing and Error Handling Error Catching was Greatly Improved • Robustness was greatly extended. • Instead of crashing when given an improperly formatted or incorrect file, GRNsight returns an error. • Information about the error is returned in a modal without crashing the Beta Version Allows for Testing of New Features • A beta version was created to allow for testing of new features and catching any potential new errors before releasing to master. • Currently, a new spreadsheet controller is being bug tested on beta that would accept asymmetrical adjacency matrices. Future Directions server. • Prevent self-referential edges from being able to go outside the bounding Acknowledgments References box. • Add node coloring based on expression data. • Implement different sizes for the graph drawing area. • Display of asymmetrical adjacency matrices is being tested in the beta version. • An automated unit testing and error-catching framework is currently being developed. A Menu Bar was Introduced • A menu bar with multiple options was added. • Two demo files were added to the “Demo” menu, with more to be added. • Print functionality was enabled in the “File” menu option. • Force graph parameter sliders are active before a graph is loaded. Availability • GRNsight is free and open to all users and there is no login requirement. Web site content is available under the Creative Commons Attribution Non-Commercial Share Alike license. GRNsight code is available under the open source BSD license. • This work is partially supported by NSF award 0921038 (Kam D. Dahlquist, Ben G. Fitzpatrick) and by the Loyola Marymount University Rains Research Assistant Program (Nicole Anguiano). • D3.js: http://d3js.org/ • Express Framework: http://expressjs.com/ • Freeman, S. (2002) Biological Science. Upper Saddle River, New Jersey: Prentice Hall. • GRNmap: http://kdahlquist.github.io/GRNmap/ • Node.js: http://nodejs.org/ MATLAB model available at http://kdahlquist.github.io/GRNmap/ Edge color based on type of relation Tooltips to display the value of an edge on hover Curved edges that remain on screen User Interface The User Interface is compatible with Firefox and Chrome browsers • File upload is via simple HTML form element. • Nodes are displayed as interactive HTML elements, and can be clicked and moved. • Users can utilize force graph parameter sliders to refine the automatic layout. • Nodes have a charge, which repels or attracts other nodes. • The charge distance determines at what range a node’s charge will affect other nodes. • The link distance determines the minimum distance maintained between nodes. • Sliders can be locked to prevent changes. Edges were customized to show activation, repression, and self-regulation • Multiple arrowheads were created as to represent the different types of edges depicted by the graph (activation, repression, and self-regulation). • A special case was added to add a looping edge if a node regulated itself. Aesthetic Improvements Focused Primarily on the Edges and Arrows • Edge thickness was changed to be based on a linear scale instead of four quartiles. • The weight values are normalized to between 0 and 1, then the thicknesses of the lines are adjusted to vary continuously from the minimum thickness (for normalized weights near zero) to the maximum thickness (weights of 1). • Edges were changed to curves with control points to prevent the curves from going outside the bounding box. • The size of the arrowheads was matched to the size of the new edge thicknesses. • Repressor bars were changed to have rounded ends. • Arrowheads were given a bezel. • Edges were centered in the arrowheads and repressor bars. Weighted Graphs can be Drawn as Unweighted Graphs • In the Edit > Preferences menu, the user can select for weighted graphs to be displayed as unweighted graphs. Reload Functionality Enables Graph Reload • The reload menu option under “File” reloads the current graph with the active settings. • Changes made in the Edit > Preferences menu become visible on reload.         j ij j i i b x w P x p ex p 1 ( )

Editor's Notes

  • #2 Kill abstract Change to sans serif font Make title bigger Make title background white Use full names Super script to associate names with correct department Background color: make it dark green, make writing on white background and writing in black/dark green 4 columns!!! Smaller pictures Bold titles References can be 12pt Acknowledgements can be 16pt Everything else is 18-24pt Titles don’t need to be bigger than 36pt Remove circles from the arrowhead diagram, group the related labels together Include menu bar Testing/error handling – sample error (we don’t crash with errors!) Mouseovers for edges screenshot