Download to read offline

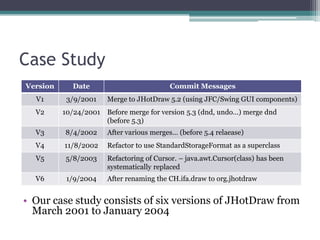


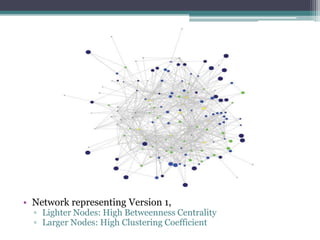

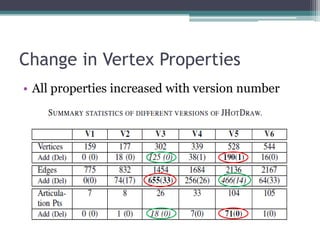


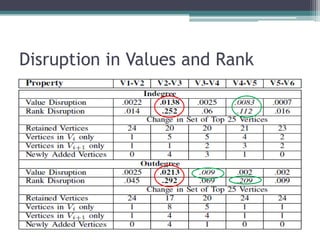
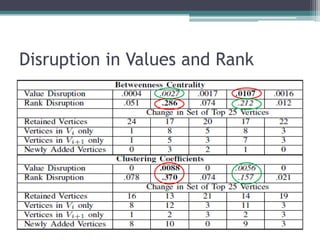

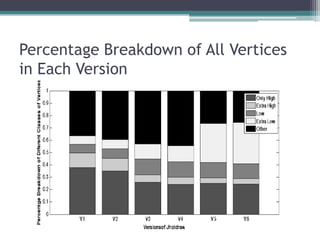
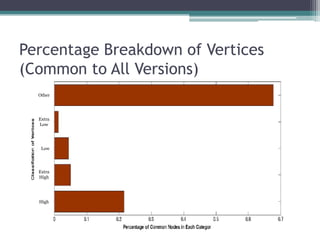
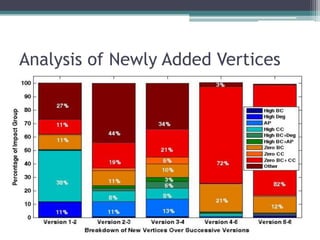
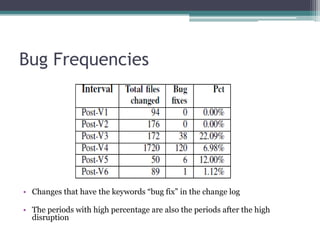
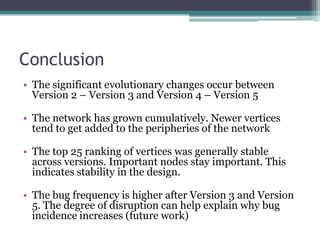


This document analyzes the evolution of the JHotDraw software system across six versions from 2001 to 2004 using graph-based metrics to detect significant changes and disruptions. It identifies specific properties of network relationships and their correlations, highlighting that significant evolutionary changes occur primarily between certain version transitions with stability in key nodes. The increase in bug frequency post certain versions suggests a link between disruption and software quality issues.