Downloaded 19 times


![info@@scientificrevenue.com Pricing Without Compromise
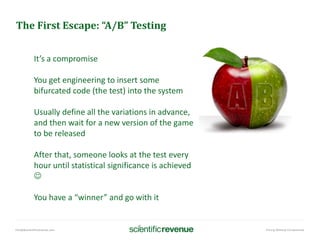
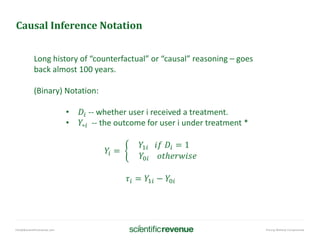
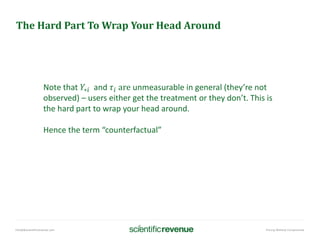
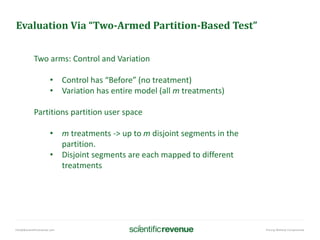
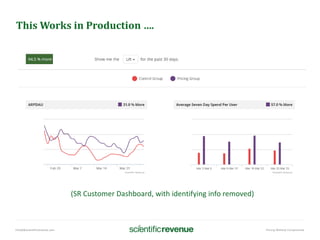
Causal Inference Notation II
E[𝑌𝑖 𝐷𝑖 = 1 − 𝐸 𝑌𝑖 𝐷𝑖 = 0] -- observed difference in outcome
E[𝑌1𝑖 𝐷𝑖 = 1 − 𝐸 𝑌0𝑖 𝐷𝑖 = 0] -- same thing
E[𝑌1𝑖 𝐷𝑖 = 1 − 𝐸 𝑌0𝑖 𝐷𝑖 = 1] + E[𝑌0𝑖 𝐷𝑖 = 1 − 𝐸 𝑌0𝑖 𝐷𝑖 = 0]
Treatment effect on treated Selection bias
(red is counterfactual and inserted for algebraic convenience)](https://image.slidesharecdn.com/scientificrevenueusf2016talk-161112015044/85/Scientific-Revenue-USF-2016-talk-35-320.jpg)


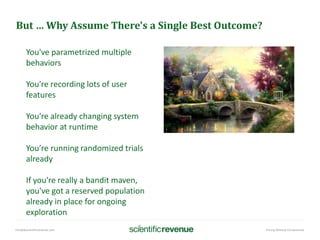
The document discusses advanced methods in analytics for e-commerce, focusing on continuous optimization and the use of machine learning, particularly through techniques like multi-arm bandits and causal inference. It emphasizes the shift from traditional A/B testing to more dynamic and data-driven approaches for revenue optimization. Key concepts include real-time segmentation, the importance of objective functions, and evaluating treatment effects through causal models.


