Download as PDF, PPTX
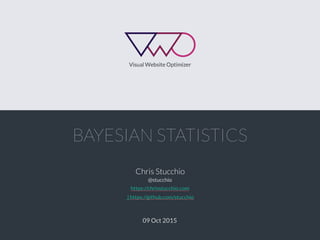


![Cost of a Mistake
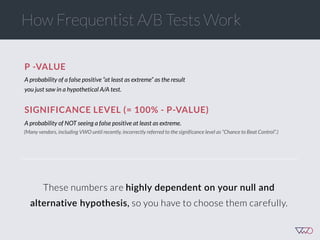
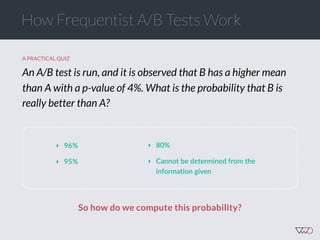
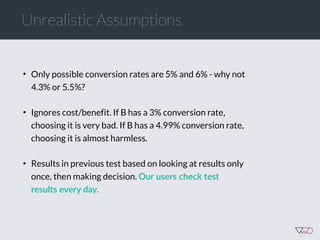
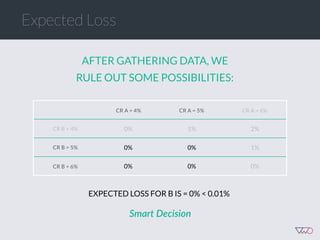
Suppose we choose variation x. The cost of this choice is:
Loss[x] = Max (CR[i] - CR[x])
This is simple opportunity cost - it’s the difference
between the best choice and our choice.
Key point: bigger mistakes cost us more money.](https://image.slidesharecdn.com/ch201502chrisstucchio-151203135716-lva1-app6892/85/Chris-Stuccio-Data-science-Conversion-Hotel-2015-41-320.jpg)
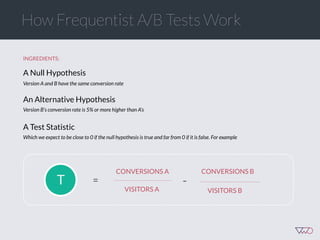
![Cost of a Mistake
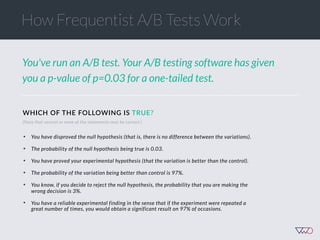
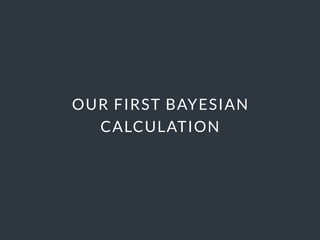
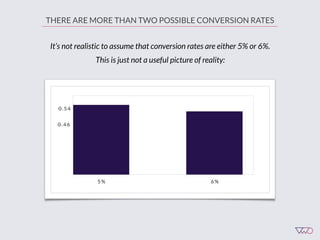
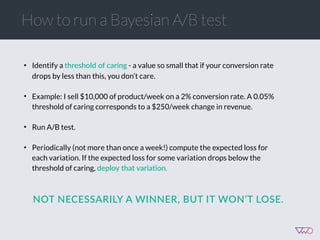
EXAMPLE
A. 5%
‣ Loss[A] = Max(5% - 5%, 6% - 5%, 4.5% - 5%) = 1%
‣ Loss[B] = Max(5% - 6%, 6% - 6%, 4.5% - 6%) = 0%
‣ Loss[C] = Max(5% - 4.5%, 6% - 4.5%, 4.5% - 4.5%) = 1.5%
B. 6% C. 4.5%](https://image.slidesharecdn.com/ch201502chrisstucchio-151203135716-lva1-app6892/85/Chris-Stuccio-Data-science-Conversion-Hotel-2015-42-320.jpg)


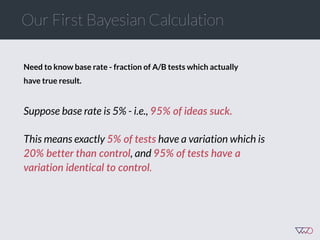
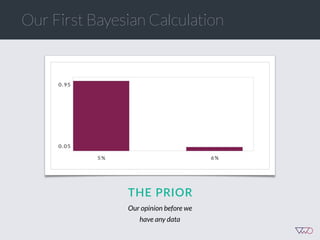
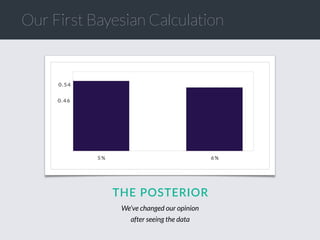
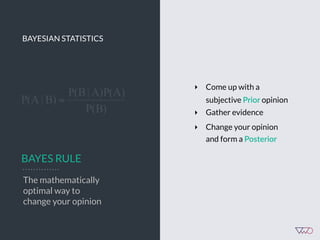
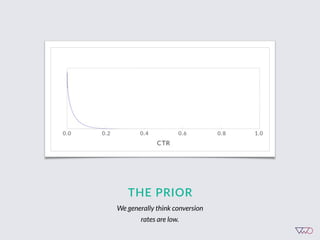
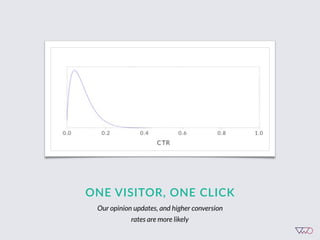
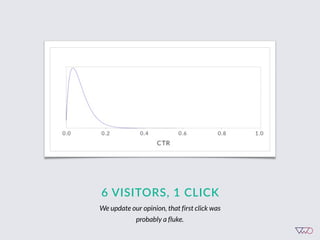
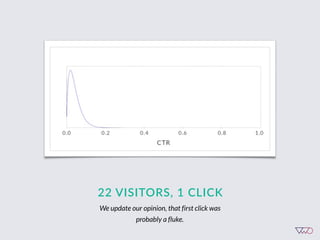
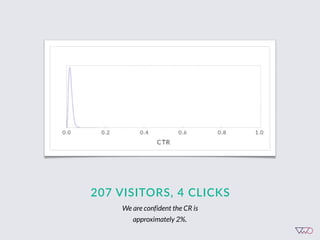
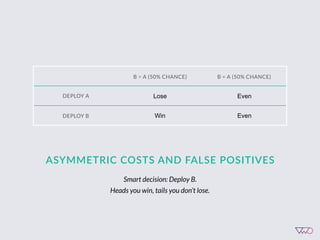
The document discusses the principles of Bayesian statistics and compares them to frequentist approaches in A/B testing, emphasizing the importance of selecting appropriate null and alternative hypotheses. It highlights the misinterpretations of significance and emphasizes the role of prior opinions and gathering evidence in Bayesian analysis to form more reliable conclusions. Additionally, it suggests practical steps for implementing Bayesian A/B tests and outlines the advantages of this approach over traditional methods.


![[DSC Europe 25] Elena Menshikova - AI-Powered Operational Excellence: Revolut...](https://cdn.slidesharecdn.com/ss_thumbnails/es6nholbqy3zaao2c2yd-2-elena-menshikova-data-ai-in-decision-making-260115093812-4fba8b38-thumbnail.jpg?width=640&height=640&fit=bounds)


![[DSC Europe 25] Bojan Djuricic - Predictive Design Process.pdf](https://cdn.slidesharecdn.com/ss_thumbnails/5awdrbedqdek3gqu2ezy-4-the-predictive-design-bojan-djuricic-260120105856-6c399e9b-thumbnail.jpg?width=640&height=640&fit=bounds)


