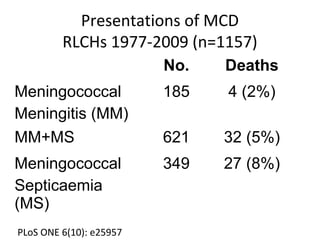
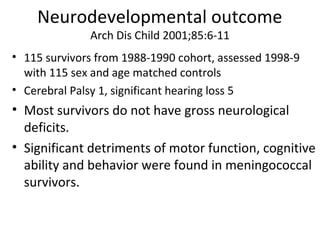
6. Blood flow in disease
Red Blood Cell
White Blood Cell
Platelet
Meningococcus
Endotoxin
Cytokines
7. Blood flow in Septicaemia
Red Blood Cell
White Blood Cell
Platelet
8. Consequences of Septicaemia
• Blood that doesn’t clot in a test tube (DIC)
• Fluid leaking out of blood vessels (shock)
• Clots happening in blood vessels (thrombosis)
• Not enough oxygen getting to tissues
9. Blood flow in Meningitis
Brain
Cerebrospinal
fluid
Skull
10. Consequences of Meningitis
• White blood cells and bacteria in the
cerebrospinal fluid (CSF)
• Fluid leaking out of blood vessels (brain
swelling)
• Decreased blood flow to brain
• Not enough oxygen getting to brain
12. Neurodevelopmental outcome
Arch Dis Child 2001;85:6-11
• 115 survivors from 1988-1990 cohort, assessed 1998-9
with 115 sex and age matched controls
• Cerebral Palsy 1, significant hearing loss 5
• Most survivors do not have gross neurological
deficits.
• Significant detriments of motor function, cognitive
ability and behavior were found in meningococcal
survivors.
13. Mortality in severe meningococcal disease.
Arch Dis Child 2001;85:382-5.
Centre Year Total
No.
Predicted
mortality
Actual
mortality
SMR
Kentucky,
USA
1979–84 62 9.1 9 1.00
Melbourne,
Australia
1985–92 35 14.4 12 0.83
London, UK 1994-96 98 23 18 0.78
Utrecht,
Netherlands
1988–93 53 15.4 10 0.65
Merseyside,
UK
1995–98 123 24.9 11 0.44
14. Critical Illness and Amputation in
Meningococcal Septicaemia:
Is Life Worth Saving?
• Young people admitted to PICU with
meningococcal disease
• Nine participants who had undergone
amputations
• Standardized assessments made
• Funded by MRF
Pediatrics 2008;122:629-632
16. Quality of life after amputation.
Allport et al
• “Generally good”
• Not predicted by
degree of amputation
• Less good if learning
difficulties
Pediatrics 2008;122:629-632
17. After effects of meningococcal disease
Meningococcal
Meningitis
Infection of the covering
of the brain can lead to;
•Deafness
•Learning difficulties
•Seizures
Meningococcal
Septicaemia
Infection in the
bloodstream can lead to;
•Skin loss
•Amputation
•Deafness
•Learning difficulties
Degree of amputation, function, and quality of life for each participant (patients 1–9). Participants' results are ordered according limb loss degree (body maps). Functional ability was measured with the AMPS.6 The AMPS assesses the quality of performance of activities of daily living. Participants choose and perform 2 everyday tasks; results are adjusted for the difficulty of the task. Blue bars show motor scores (participants' ability to move themselves and the task objects). Purple bars show process or cognitive scores (how participants organize, sequence, and adapt to problems during the tasks). Quality of life was measured with Short Form-36 (>16 years of age) or the Child Health Questionnaire.7 Green bars show physical scores and blue bars mental/psychosocial summary scores. AMPS and Short Form-36/Child Health Questionnaire results are presented as z scores (number of SDs from the mean for age and gender).