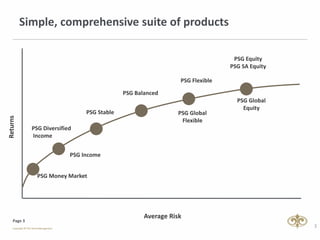
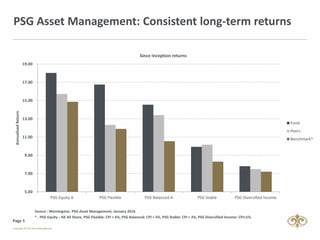
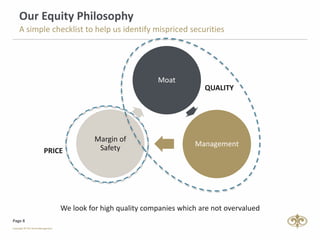
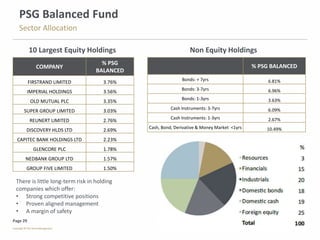
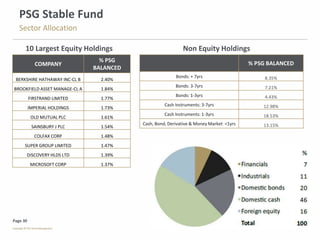
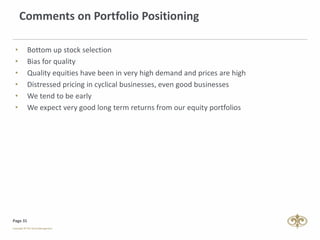
June 2016
Page 2
“Is this in the best long term interests of our investors?”
Our Primary Role: Stewardship
Our framework for answering this question:
Think and act long term
Be prudent in deploying our clients’ assets
Have an obsessive focus on research
Page 3
Simple, comprehensive suite of products
3
PSG Money Market
PSG Diversified
Income
PSG Balanced
PSG Flexible
PSG Equity
PSG SA Equity
Average Risk
Returns
PSG Global
Equity
PSG Stable PSG Global
Flexible
PSG Income
Page 4
Our team
Page 5
PSG Asset Management: Consistent long-term returns
Source : Morningstar, PSG Asset Management, January 2016
* - PSG Equity : JSE All Share, PSG Flexible: CPI + 6%, PSG Balanced: CPI + 5%, PSG Stable: CPI + 3%, PSG Diversified Income: CPI+1%.
5.00
7.00
9.00
11.00
13.00
15.00
17.00
19.00
PSG Equity A PSG Flexible PSG Balanced A PSG Stable PSG Diversified Income
AnnualisedReturn
Since Inception returns
Fund
Peers
Benchmark*
Page 6
Equity Team: Awards
2004: S&P – Sector award : Flexible sector (3 years)
2004: S&P – Sector award: Growth sector (1 year)
2005: Raging bull – Sector award: General Equity (3 years)
2006: S&P – Sector award: General Equity (3 years)
2010: Raging bull – Sector award : Flexible (3 years)
2010: Raging bull – Best domestic AA Flexible fund (5 years)
2011: Raging bull – Sector award: General Equity (3 years)
2011: Raging bull – Best broad-based domestic Equity fund (3 years)
2011: Raging bull – Best domestic AA Flexible fund (5 years)
2014: Raging bull – Best domestic Multi-Asset High Equity fund (5 years)
2016: Morningstar – 3rd place best fund house: larger fund range category
Page 7
Equity process
Page 8
Moat
Management
Margin of
Safety
QUALITY
PRICE
Our Equity Philosophy
A simple checklist to help us identify mispriced securities
We look for high quality companies which are not overvalued
Page 9
Fund mangers can exercise own discretion, but
use the Buy List as their main tool for portfolio
construction. Fund managers take responsibility
for their fund’s performance.
PSG Asset Management: Equity process
FUNDS
BUY
LISTS
FUNDAMENTAL
ANALYSIS
IDEA GENERATION
INVESTMENT UNIVERSE
PHILOSOPHY Moat, Management & Margin of Safety
Local & Global Companies.
Proprietary screens, company results to find
potential opportunities.
Detailed analysis on potential opportunities in
terms of our investment philosophy.
Investment Committee determines domestic &
offshore buy lists by means of majority vote.
Page 10
EquitySA Equity
Flexible
Balanced
Stable
Diversified Income
Global Equity
Global Flexible
0%
20%
40%
60%
80%
100%
120%
EquityExposure
99%
92%
99%
99%
99%
99%
98%
93%
Process compliance
Our funds have a significant overlap with our Buy Lists
PSG AM Internal, 31/12/2015
Bubble Size = number of equity holdings
Conviction level Suggested weight
Buy High 6% - 10%
Buy Medium 3%-6%
Buy Low 0%-3%
Overlap with Buy List
Fund Equity Holding Overlap with PSGAM Buy Lists
Page 11
Equity process applied
Page 12
The market cycle
Value investing : buying with a margin of safety
Source : PSGAM, Bloomberg
(12.5.2015).
Greed
Fear
Intrinsic
value
Page 13
Our process revisited
Past high conviction opportunities
18.57%
15.22%
Page 14
Asset allocation
Page 15
Our universe of opportunities
2015 2016
High quality/blue chip SA equities are expensive
Government bonds expensive
Property expensive
Offshore equities still a good opportunity
Growing opportunity in cyclical equities
Cash is under-appreciated
A review of what we said last year and our current thinking
Page 16
Asset allocation process
Based on thorough bottom-up research
Thorough bottom-up research
Fixed Income Investment
Committee
Equity Investment Committee Credit Investment Committee
Funds
Fund managers consider all opportunities on a risk-return basis
Buy lists calibrated for level of conviction
Page 17
2015 in review
• Our asset allocation has been spot on:
- Maximum offshore
- Very high levels of cash
• We were early into cyclical equities.
• A short term drawdown in part of the portfolio does not constitute a permanent
capital loss.
• We have been employing cash across the asset curve as opportunities arose in recent
months
Page 18
Example: Allocating assets
Source: PSG Asset Management Research
Objective : Buying low and selling high
6
7
8
9
10
11
12
13
14
15
16
17
18
19
20
0%
20%
40%
60%
80%
100%
Nov-04 Jul-05 Mar-06 Nov-06 Jul-07 Mar-08 Nov-08 Jul-09 Mar-10 Nov-10 Jul-11 Mar-12 Nov-12 Jul-13 Mar-14 Nov-14 Jul-15
PERatio
Assetallocation%
% Cash PE - Fund PE - ALSI
Page 19
Examples of recent opportunities
Page 20
7.50
8.50
9.50
10.50
11.50
12.50
13.50
14.50
2012 2013 2013 2014 2014 2015 2015
Price Earnings ratio: Basket of cyclical stocks
Opportunities in equities: Cyclical shares
These companies are now trading at exceptionally attractive valuations
Source: PSG Asset Management Research; Bloomberg
10 year average
Page 21
17.00
19.00
21.00
23.00
25.00
27.00
2011 2012 2013 2014 2015
Where one should be careful: Selected blue chips
P:E of a basket of blue chips: Well beyond their 10-year average
Source: PSG Asset Management Research
10 year average
22
Copyright © PSG
Property looking more attractive
-40%
-20%
0%
20%
40%
60%
Jun 05 Mar 06 Dec 06 Sep 07 Jun 08 Mar 09 Dec 09 Sep 10 Jun 11 Mar 12 Dec 12 Sep 13 Jun 14 Mar 15 Dec 15
Prem/disc to NAV
Growthpoint trading at a discount to its NAV for the first time in years
Page 23
5.45%
5.93%
6.56%
1Yr NCD
8.44%
3Yr NCD
9.71%
5Yr NCD
10.47%
4.0%
5.0%
6.0%
7.0%
8.0%
9.0%
10.0%
11.0%
0 1 2 3 4 5
YieldtoMaturity
Years to Maturity
NCD Yields: Apr-2013 2016 Expected Core inflation : 5.4% NCD Yields: Dec-2015
An opportunity in cash
South African Fixed rate NCDs
Page 24
Nominal Bonds are looking more attractive
RSA Nominal bonds
Source: PSG Asset Management
R207
5.5%
R186
6.4%
R209
7.3%
R207
9.3%
R186
9.8%
R209
10.2%
3%
4%
5%
6%
7%
8%
9%
10%
11%
0.0 5.0 10.0 15.0 20.0 25.0 30.0 35.0
YieldtoMaturity
Years to Maturity
Bond Yields: Apr-2013 2016 Expected Core inflation : 5.4% Bond Yields: Dec-2015
Page 25
Our Funds
Performance
30/Apr/2016 1 Month 3 Months 6 Months 1 Year 2 Year 3 Year 5 Year 10 Year Inception
Fund Fund Size
Return
Rank
Count
Return
Rank
Count
Return
Rank
Count
Return
Rank
Count
Return
Rank
Count
Return
Rank
Count
Return
Rank
Count
Return
Rank
Count
Date
Return
Rank
Count
Core Funds
PSG Equity A R 2 163 277 363 3.70 18 159 18.80 11 156 4.14 22 151 -4.44 111 143 5.20 77 126 16.04 12 110 15.16 15 84 11.94 21 53 01-Mar-02 19.13 2 36
PSG Equity A BM (JSE All Share TR) - 1.70 8.89 -0.18 0.21 7.24 14.37 13.44 12.83 01-Mar-02 15.28
PSG SA Equity D R 40 292 319 4.55 8 160 21.84 3 157 2.87 26 152 -8.37 134 144 3.28 94 127 - - - - - - - - - 01-Nov-13 7.51 68 117
PSG SA Equity D BM (SWIX TR) - 1.25 9.74 1.28 -0.35 9.78 - - - 01-Nov-13 11.37
PSG Flexible R 7 615 315 059 1.63 13 70 12.57 4 68 6.60 5 68 5.24 10 67 10.31 14 59 17.07 6 53 15.25 11 47 15.18 3 30 01-Nov-04 17.58 2 13
PSG Flexible BM (CPI+6%) - 1.32 2.97 4.47 12.28 11.18 11.48 11.67 12.16 01-Nov-04 11.92
PSG Balanced A R 5 172 291 174 0.79 61 173 9.19 9 163 3.73 19 154 2.81 73 143 8.84 39 114 13.69 13 97 13.48 22 75 11.04 13 41 01-Jun-99 14.92 3 10
PSG Balanced A BM (CPI+5%) - 1.13 4.04 5.92 11.26 10.16 10.46 10.65 11.34 01-Jun-99 10.65
PSG Stable A R 2 544 335 177 0.91 19 139 5.12 8 135 4.03 6 128 5.95 31 122 7.92 50 98 9.22 41 90 - - - - - - 13-Sep-11 10.57 40 78
PSG Stable BM (CPI+3%) - 0.98 3.59 4.97 9.26 8.16 8.46 8.65 - 13-Sep-11 8.68
PSG Diversified Income R 974 356 979 0.46 64 79 2.10 54 79 3.70 20 78 7.40 22 71 7.35 20 64 7.46 8 54 7.62 12 40 7.86 9 22 11-Apr-06 7.84 9 22
PSG Diversified Income BM (CPI+1%) - 0.83 3.14 4.01 7.26 6.15 6.45 6.65 7.33 11-Apr-06 7.36
PSG Income E R 92 673 338 0.72 11 32 2.12 8 32 3.76 7 32 7.41 9 32 7.18 3 30 - - - - - - - - - 03-Sep-13 6.98 2 29
PSG Income E BM (STeFI Composite) - 0.57 1.70 3.36 6.67 6.43 - - - 03-Sep-13 6.17
PSG Money Market A R 5 716 089 637 0.57 21 27 1.70 22 27 3.38 20 27 6.68 18 27 6.45 10 26 6.01 11 25 5.72 14 24 7.26 7 17 01-Nov-98 8.62 3 6
PSG Money Market A BM (ASISA SA IB MM) - 0.59 1.75 3.41 6.68 6.38 6.01 5.75 7.27 01-Nov-98 8.61
PSG Money Market B R 5 716 089 637 0.61 6 28 1.80 6 28 3.58 3 28 7.10 1 28 6.86 1 27 6.41 1 26 6.10 1 25 - - - 03-Jan-11 6.09 1 25
PSG Money Market A BM (ASISA SA IB MM) - 0.59 1.75 3.41 6.68 6.38 6.01 5.75 7.27 01-Nov-98 8.61
PSG Global Equity USD $ 11 162 656 3.33 32 687 16.63 13 683 1.29 77 666 -12.41 570 627 -6.08 471 536 1.40 360 473 0.62 285 381 - - - 23-Jul-10 3.02 321 351
PSG Global Equity BM (MSCI World Free NR) - 1.58 7.67 -1.05 -4.16 1.45 6.27 5.96 - 23-Jul-10 9.46
PSG Global Equity FF A R 104 621 673 -0.43 7 44 5.51 2 43 3.42 9 40 4.06 34 38 8.46 29 31 16.98 23 26 - - - - - - 05-May-11 15.30 20 21
PSG Global Equity FF BM (MSCI World Free NR) - -2.06 -3.97 1.63 13.63 17.72 23.74 - - 04-May-11 23.63
PSG Global Flexible USD A $ 109 446 692 3.32 12 136 16.24 5 134 2.86 12 127 -8.32 79 114 -3.61 70 94 2.19 18 80 - - - - - - 02-Jan-13 2.92 22 77
PSG Global FlexibleA USD Acc BM (USCPI+6%) - 0.90 2.12 3.03 6.84 6.39 6.76 - - 02-Jan-13 7.04
PSG Global Flexible FF A R 557 388 407 -0.52 2 24 4.36 2 24 4.79 5 22 8.80 16 18 11.63 13 16 18.31 6 15 - - - - - - 10-Apr-13 18.43 8 15
PSG Global FlexibleFF A BM (USCPI+6%) - -2.72 -8.92 5.83 26.68 23.44 24.31 - - 10-Apr-13 24.48
Data Source: MorningStar Direct 1st Quartile
Peer Group Ranking for Offshore in USD 2nd Quartile
3rd Quartile
4th Quartile
Light Blue - Monitored Closely
Dark Blue - Appropriate measurement period
Page 27
PSG Equity Fund
Sector Allocation - Bias for mispriced quality, very attractively priced
COMPANY % PSG EQUITY
IMPERIAL HOLDINGS 7.50%
GLENCORE PLC 7.43%
FIRSTRAND LIMITED 5.80%
OLD MUTUAL PLC 5.46%
DISCOVERY HLDS LTD 4.96%
GRINDROD LIMITED 3.92%
HUDACO INDUSTRIES 3.49%
SOFTBANK CORP 3.41%
REUNERT LIMITED 3.18%
CAPITAL ONE FIN CORP 3.17%
In 2016 we have reduced our exposure to
global equities in favour of SA financials
There is little long-term risk in holding
companies which offer:
• Strong competitive positions
• Proven aligned management
• A margin of safety
10 Largest Equity Holdings
Page 28
PSG Flexible Fund
Sector Allocation
COMPANY % PSG EQUITY
BERKSHIRE HATHAWAY 7.59%
SAINSBURY J PLC 5.00%
FIRSTRAND LIMITED 4.22%
IMPERIAL HOLDINGS 4.07%
CAPITEC BANK HOLDINGS LTD 3.17%
OLD MUTUAL PLC 2.92%
GLENCORE PLC 2.91%
DISCOVERY HLDS LTD 2.59%
SUPER GROUP LIMITED 2.53%
GRINDROD LIMITED 2.37%
10 Largest Equity Holdings
% PSG EQUITY
Cash, Bond, Derivative & Money Market
30.51%
Non Equity Holdings
Page 29
PSG Balanced Fund
Sector Allocation
There is little long-term risk in holding
companies which offer:
• Strong competitive positions
• Proven aligned management
• A margin of safety
COMPANY
% PSG
BALANCED
FIRSTRAND LIMITED 3.76%
IMPERIAL HOLDINGS 3.56%
OLD MUTUAL PLC 3.35%
SUPER GROUP LIMITED 3.03%
REUNERT LIMITED 2.76%
DISCOVERY HLDS LTD 2.69%
CAPITEC BANK HOLDINGS LTD 2.23%
GLENCORE PLC 1.78%
NEDBANK GROUP LTD 1.57%
GROUP FIVE LIMITED 1.50%
10 Largest Equity Holdings
% PSG BALANCED
Bonds: + 7yrs 6.81%
Bonds: 3-7yrs 6.96%
Bonds: 1-3yrs 3.63%
Cash Instruments: 3-7yrs 6.09%
Cash Instruments: 1-3yrs 2.67%
Cash, Bond, Derivative & Money Market <1yrs 10.49%
Non Equity Holdings
Page 30
PSG Stable Fund
Sector Allocation
COMPANY
% PSG
BALANCED
BERKSHIRE HATHAWAY INC-CL B 2.40%
BROOKFIELD ASSET MANAGE-CL A 1.84%
FIRSTRAND LIMITED 1.77%
IMPERIAL HOLDINGS 1.73%
OLD MUTUAL PLC 1.61%
SAINSBURY J PLC 1.54%
COLFAX CORP 1.48%
SUPER GROUP LIMITED 1.47%
DISCOVERY HLDS LTD 1.39%
MICROSOFT CORP 1.37%
10 Largest Equity Holdings
% PSG BALANCED
Bonds: + 7yrs 8.35%
Bonds: 3-7yrs 7.21%
Bonds: 1-3yrs 4.43%
Cash Instruments: 3-7yrs 12.98%
Cash Instruments: 1-3yrs 18.53%
Cash, Bond, Derivative & Money Market <1yrs 13.15%
Non Equity Holdings
Page 31
Comments on Portfolio Positioning
• Bottom up stock selection
• Bias for quality
• Quality equities have been in very high demand and prices are high
• Distressed pricing in cyclical businesses, even good businesses
• We tend to be early
• We expect very good long term returns from our equity portfolios
Page 32
Conclusion
Page 33
Conclusion
The context of the market backdrop is important:
• A long bull market in global equities
• Majority of shares are sharply down from their recent highs.
• Elevated valuations remain for quality defensives. We think they are overpriced.
• Cyclical businesses have got very cheap.
• We have been buyers of out-of-favour stocks that are mispriced:
• Mining & construction: Glencore, Anglo, Group 5.
• Cyclical SA inc businesses: Imperial, Reunert, Super Group.
• Financials: US and SA banks, Old Mutual, Discovery.
• We continue to see good opportunity within the global universe: Microsoft, Softbank.
• We do not expect rand weakness to support returns to the same extent going forward.
• We will be buyers of quality on the JSE when the margin of safety returns.
• Our portfolios are extremely attractively priced: in both relative and absolute terms.
Page 35
Disclaimer
Disclaimer: Collective Investment Schemes in Securities (CIS) are generally medium to long-term investments. The value of participatory interests (units) or the
investment may go down as well as up and past performance is not a guide to future performance. CIS are traded at ruling prices and can engage in borrowing
and script lending. Fluctuations or movements in the exchange rates may cause the value of underlying international investments to go up or down. Where
foreign securities are included in a portfolio, the portfolio is exposed to risks such as potential constraints on liquidity and the repatriation of funds;
macroeconomic, political, foreign exchange, tax, settlement and potential limitations on the availability of market information. The portfolios may be capped at
any time in order for them to be managed in accordance with their mandate. Fees and Performance: Prices are published daily and available on the website
www.psg.co.za and in the daily newspapers. A schedule of fees and charges and maximum commissions is available on request from PSG Collective Investments
Limited. Commission and incentives may be paid and, if so, are included in the overall costs. Forward pricing is used. Different classes of Participatory Interest
can apply to these portfolios and are subject to different fees, charges and possibly dividend withholding tax and will thus have differing performances.
Performance is calculated for the portfolio and individual investor performance may differ as a result thereof. All performance data for a lump sum, net of fees,
include income and assumes reinvestment of income on a NAV-NAV basis. Source of performance: Figures quoted are from Morningstar Inc. Additional
information: Additional information is available free of charge on the website and may include publications, brochures, application forms and annual reports.
Company details: PSG Collective Investments Limited is registered as a CIS Manager with the Financial Services Board, and a member of the Association of
Savings and Investments South Africa (ASISA) through its holdings company PSG Konsult Limited. The management of the portfolios is delegated to PSG Asset
Management (Pty) Ltd, an authorized Financial Services Provider under the Financial Advisory and Intermediary Services Act 2002, FSP no 29524. PSG Asset
Management (Pty) Ltd and PSG Collective Investments Limited are subsidiaries of PSG Group Limited. Money Market: The PSG Money Market Fund maintains a
constant price and targeted at a constant value. The quoted yield is calculated by annualizing the average 7 day yield. A money market portfolio is not a bank
deposit account. Excessive withdrawals from the portfolio may place the portfolio under liquidity pressures and in such circumstances a process of ring-fencing
of withdrawal instructions and managed payouts over time may be followed. The total return to the investor is made up of interest received and any gain or loss
made on any particular instrument. In most cases the return will merely have the effect of increasing or decreasing the daily yield but in the case of abnormal
losses it can have the effect of reducing the capital value of the portfolio. Trustee: The Standard Bank of South Africa Limited, Main Tower, Standard Bank
Centre, 2 Hertzog Boulevard, Cape Town, 8001. Tel: 021 401 2443. Email: compliance-PSG@standardbank.co.za. Conflict of Interest Disclosure: The Fund may
from time to time invest in a portfolio managed by a related party. PSG Collective Investments Limited or the Fund Manager may negotiate a discount in fees
charged by the underlying portfolio. All discounts negotiated are re-invested in the Fund for the benefit of the investor. Neither PSG Collective Investments
Limited nor PSG Asset Management retains any portion of such discount for their own accounts. The Fund Manager may use the brokerage services of a related
party, PSG Securities Ltd.
PSG Collective Investments Limited does not provide any guarantee either with respect to the capital or the return of the portfolio and can be contacted on
0800 600 168 or e-mail, psgassetmanagement@psg.co.za

PSG Asset management

  • 1.
  • 2.
    Page 2 “Is thisin the best long term interests of our investors?” Our Primary Role: Stewardship Our framework for answering this question: Think and act long term Be prudent in deploying our clients’ assets Have an obsessive focus on research
  • 3.
    Page 3 Simple, comprehensivesuite of products 3 PSG Money Market PSG Diversified Income PSG Balanced PSG Flexible PSG Equity PSG SA Equity Average Risk Returns PSG Global Equity PSG Stable PSG Global Flexible PSG Income
  • 4.
  • 5.
    Page 5 PSG AssetManagement: Consistent long-term returns Source : Morningstar, PSG Asset Management, January 2016 * - PSG Equity : JSE All Share, PSG Flexible: CPI + 6%, PSG Balanced: CPI + 5%, PSG Stable: CPI + 3%, PSG Diversified Income: CPI+1%. 5.00 7.00 9.00 11.00 13.00 15.00 17.00 19.00 PSG Equity A PSG Flexible PSG Balanced A PSG Stable PSG Diversified Income AnnualisedReturn Since Inception returns Fund Peers Benchmark*
  • 6.
    Page 6 Equity Team:Awards 2004: S&P – Sector award : Flexible sector (3 years) 2004: S&P – Sector award: Growth sector (1 year) 2005: Raging bull – Sector award: General Equity (3 years) 2006: S&P – Sector award: General Equity (3 years) 2010: Raging bull – Sector award : Flexible (3 years) 2010: Raging bull – Best domestic AA Flexible fund (5 years) 2011: Raging bull – Sector award: General Equity (3 years) 2011: Raging bull – Best broad-based domestic Equity fund (3 years) 2011: Raging bull – Best domestic AA Flexible fund (5 years) 2014: Raging bull – Best domestic Multi-Asset High Equity fund (5 years) 2016: Morningstar – 3rd place best fund house: larger fund range category
  • 7.
  • 8.
    Page 8 Moat Management Margin of Safety QUALITY PRICE OurEquity Philosophy A simple checklist to help us identify mispriced securities We look for high quality companies which are not overvalued
  • 9.
    Page 9 Fund mangerscan exercise own discretion, but use the Buy List as their main tool for portfolio construction. Fund managers take responsibility for their fund’s performance. PSG Asset Management: Equity process FUNDS BUY LISTS FUNDAMENTAL ANALYSIS IDEA GENERATION INVESTMENT UNIVERSE PHILOSOPHY Moat, Management & Margin of Safety Local & Global Companies. Proprietary screens, company results to find potential opportunities. Detailed analysis on potential opportunities in terms of our investment philosophy. Investment Committee determines domestic & offshore buy lists by means of majority vote.
  • 10.
    Page 10 EquitySA Equity Flexible Balanced Stable DiversifiedIncome Global Equity Global Flexible 0% 20% 40% 60% 80% 100% 120% EquityExposure 99% 92% 99% 99% 99% 99% 98% 93% Process compliance Our funds have a significant overlap with our Buy Lists PSG AM Internal, 31/12/2015 Bubble Size = number of equity holdings Conviction level Suggested weight Buy High 6% - 10% Buy Medium 3%-6% Buy Low 0%-3% Overlap with Buy List Fund Equity Holding Overlap with PSGAM Buy Lists
  • 11.
  • 12.
    Page 12 The marketcycle Value investing : buying with a margin of safety Source : PSGAM, Bloomberg (12.5.2015). Greed Fear Intrinsic value
  • 13.
    Page 13 Our processrevisited Past high conviction opportunities 18.57% 15.22%
  • 14.
  • 15.
    Page 15 Our universeof opportunities 2015 2016 High quality/blue chip SA equities are expensive Government bonds expensive Property expensive Offshore equities still a good opportunity Growing opportunity in cyclical equities Cash is under-appreciated A review of what we said last year and our current thinking
  • 16.
    Page 16 Asset allocationprocess Based on thorough bottom-up research Thorough bottom-up research Fixed Income Investment Committee Equity Investment Committee Credit Investment Committee Funds Fund managers consider all opportunities on a risk-return basis Buy lists calibrated for level of conviction
  • 17.
    Page 17 2015 inreview • Our asset allocation has been spot on: - Maximum offshore - Very high levels of cash • We were early into cyclical equities. • A short term drawdown in part of the portfolio does not constitute a permanent capital loss. • We have been employing cash across the asset curve as opportunities arose in recent months
  • 18.
    Page 18 Example: Allocatingassets Source: PSG Asset Management Research Objective : Buying low and selling high 6 7 8 9 10 11 12 13 14 15 16 17 18 19 20 0% 20% 40% 60% 80% 100% Nov-04 Jul-05 Mar-06 Nov-06 Jul-07 Mar-08 Nov-08 Jul-09 Mar-10 Nov-10 Jul-11 Mar-12 Nov-12 Jul-13 Mar-14 Nov-14 Jul-15 PERatio Assetallocation% % Cash PE - Fund PE - ALSI
  • 19.
    Page 19 Examples ofrecent opportunities
  • 20.
    Page 20 7.50 8.50 9.50 10.50 11.50 12.50 13.50 14.50 2012 20132013 2014 2014 2015 2015 Price Earnings ratio: Basket of cyclical stocks Opportunities in equities: Cyclical shares These companies are now trading at exceptionally attractive valuations Source: PSG Asset Management Research; Bloomberg 10 year average
  • 21.
    Page 21 17.00 19.00 21.00 23.00 25.00 27.00 2011 20122013 2014 2015 Where one should be careful: Selected blue chips P:E of a basket of blue chips: Well beyond their 10-year average Source: PSG Asset Management Research 10 year average
  • 22.
    22 Copyright © PSG Propertylooking more attractive -40% -20% 0% 20% 40% 60% Jun 05 Mar 06 Dec 06 Sep 07 Jun 08 Mar 09 Dec 09 Sep 10 Jun 11 Mar 12 Dec 12 Sep 13 Jun 14 Mar 15 Dec 15 Prem/disc to NAV Growthpoint trading at a discount to its NAV for the first time in years
  • 23.
    Page 23 5.45% 5.93% 6.56% 1Yr NCD 8.44% 3YrNCD 9.71% 5Yr NCD 10.47% 4.0% 5.0% 6.0% 7.0% 8.0% 9.0% 10.0% 11.0% 0 1 2 3 4 5 YieldtoMaturity Years to Maturity NCD Yields: Apr-2013 2016 Expected Core inflation : 5.4% NCD Yields: Dec-2015 An opportunity in cash South African Fixed rate NCDs
  • 24.
    Page 24 Nominal Bondsare looking more attractive RSA Nominal bonds Source: PSG Asset Management R207 5.5% R186 6.4% R209 7.3% R207 9.3% R186 9.8% R209 10.2% 3% 4% 5% 6% 7% 8% 9% 10% 11% 0.0 5.0 10.0 15.0 20.0 25.0 30.0 35.0 YieldtoMaturity Years to Maturity Bond Yields: Apr-2013 2016 Expected Core inflation : 5.4% Bond Yields: Dec-2015
  • 25.
  • 26.
    Performance 30/Apr/2016 1 Month3 Months 6 Months 1 Year 2 Year 3 Year 5 Year 10 Year Inception Fund Fund Size Return Rank Count Return Rank Count Return Rank Count Return Rank Count Return Rank Count Return Rank Count Return Rank Count Return Rank Count Date Return Rank Count Core Funds PSG Equity A R 2 163 277 363 3.70 18 159 18.80 11 156 4.14 22 151 -4.44 111 143 5.20 77 126 16.04 12 110 15.16 15 84 11.94 21 53 01-Mar-02 19.13 2 36 PSG Equity A BM (JSE All Share TR) - 1.70 8.89 -0.18 0.21 7.24 14.37 13.44 12.83 01-Mar-02 15.28 PSG SA Equity D R 40 292 319 4.55 8 160 21.84 3 157 2.87 26 152 -8.37 134 144 3.28 94 127 - - - - - - - - - 01-Nov-13 7.51 68 117 PSG SA Equity D BM (SWIX TR) - 1.25 9.74 1.28 -0.35 9.78 - - - 01-Nov-13 11.37 PSG Flexible R 7 615 315 059 1.63 13 70 12.57 4 68 6.60 5 68 5.24 10 67 10.31 14 59 17.07 6 53 15.25 11 47 15.18 3 30 01-Nov-04 17.58 2 13 PSG Flexible BM (CPI+6%) - 1.32 2.97 4.47 12.28 11.18 11.48 11.67 12.16 01-Nov-04 11.92 PSG Balanced A R 5 172 291 174 0.79 61 173 9.19 9 163 3.73 19 154 2.81 73 143 8.84 39 114 13.69 13 97 13.48 22 75 11.04 13 41 01-Jun-99 14.92 3 10 PSG Balanced A BM (CPI+5%) - 1.13 4.04 5.92 11.26 10.16 10.46 10.65 11.34 01-Jun-99 10.65 PSG Stable A R 2 544 335 177 0.91 19 139 5.12 8 135 4.03 6 128 5.95 31 122 7.92 50 98 9.22 41 90 - - - - - - 13-Sep-11 10.57 40 78 PSG Stable BM (CPI+3%) - 0.98 3.59 4.97 9.26 8.16 8.46 8.65 - 13-Sep-11 8.68 PSG Diversified Income R 974 356 979 0.46 64 79 2.10 54 79 3.70 20 78 7.40 22 71 7.35 20 64 7.46 8 54 7.62 12 40 7.86 9 22 11-Apr-06 7.84 9 22 PSG Diversified Income BM (CPI+1%) - 0.83 3.14 4.01 7.26 6.15 6.45 6.65 7.33 11-Apr-06 7.36 PSG Income E R 92 673 338 0.72 11 32 2.12 8 32 3.76 7 32 7.41 9 32 7.18 3 30 - - - - - - - - - 03-Sep-13 6.98 2 29 PSG Income E BM (STeFI Composite) - 0.57 1.70 3.36 6.67 6.43 - - - 03-Sep-13 6.17 PSG Money Market A R 5 716 089 637 0.57 21 27 1.70 22 27 3.38 20 27 6.68 18 27 6.45 10 26 6.01 11 25 5.72 14 24 7.26 7 17 01-Nov-98 8.62 3 6 PSG Money Market A BM (ASISA SA IB MM) - 0.59 1.75 3.41 6.68 6.38 6.01 5.75 7.27 01-Nov-98 8.61 PSG Money Market B R 5 716 089 637 0.61 6 28 1.80 6 28 3.58 3 28 7.10 1 28 6.86 1 27 6.41 1 26 6.10 1 25 - - - 03-Jan-11 6.09 1 25 PSG Money Market A BM (ASISA SA IB MM) - 0.59 1.75 3.41 6.68 6.38 6.01 5.75 7.27 01-Nov-98 8.61 PSG Global Equity USD $ 11 162 656 3.33 32 687 16.63 13 683 1.29 77 666 -12.41 570 627 -6.08 471 536 1.40 360 473 0.62 285 381 - - - 23-Jul-10 3.02 321 351 PSG Global Equity BM (MSCI World Free NR) - 1.58 7.67 -1.05 -4.16 1.45 6.27 5.96 - 23-Jul-10 9.46 PSG Global Equity FF A R 104 621 673 -0.43 7 44 5.51 2 43 3.42 9 40 4.06 34 38 8.46 29 31 16.98 23 26 - - - - - - 05-May-11 15.30 20 21 PSG Global Equity FF BM (MSCI World Free NR) - -2.06 -3.97 1.63 13.63 17.72 23.74 - - 04-May-11 23.63 PSG Global Flexible USD A $ 109 446 692 3.32 12 136 16.24 5 134 2.86 12 127 -8.32 79 114 -3.61 70 94 2.19 18 80 - - - - - - 02-Jan-13 2.92 22 77 PSG Global FlexibleA USD Acc BM (USCPI+6%) - 0.90 2.12 3.03 6.84 6.39 6.76 - - 02-Jan-13 7.04 PSG Global Flexible FF A R 557 388 407 -0.52 2 24 4.36 2 24 4.79 5 22 8.80 16 18 11.63 13 16 18.31 6 15 - - - - - - 10-Apr-13 18.43 8 15 PSG Global FlexibleFF A BM (USCPI+6%) - -2.72 -8.92 5.83 26.68 23.44 24.31 - - 10-Apr-13 24.48 Data Source: MorningStar Direct 1st Quartile Peer Group Ranking for Offshore in USD 2nd Quartile 3rd Quartile 4th Quartile Light Blue - Monitored Closely Dark Blue - Appropriate measurement period
  • 27.
    Page 27 PSG EquityFund Sector Allocation - Bias for mispriced quality, very attractively priced COMPANY % PSG EQUITY IMPERIAL HOLDINGS 7.50% GLENCORE PLC 7.43% FIRSTRAND LIMITED 5.80% OLD MUTUAL PLC 5.46% DISCOVERY HLDS LTD 4.96% GRINDROD LIMITED 3.92% HUDACO INDUSTRIES 3.49% SOFTBANK CORP 3.41% REUNERT LIMITED 3.18% CAPITAL ONE FIN CORP 3.17% In 2016 we have reduced our exposure to global equities in favour of SA financials There is little long-term risk in holding companies which offer: • Strong competitive positions • Proven aligned management • A margin of safety 10 Largest Equity Holdings
  • 28.
    Page 28 PSG FlexibleFund Sector Allocation COMPANY % PSG EQUITY BERKSHIRE HATHAWAY 7.59% SAINSBURY J PLC 5.00% FIRSTRAND LIMITED 4.22% IMPERIAL HOLDINGS 4.07% CAPITEC BANK HOLDINGS LTD 3.17% OLD MUTUAL PLC 2.92% GLENCORE PLC 2.91% DISCOVERY HLDS LTD 2.59% SUPER GROUP LIMITED 2.53% GRINDROD LIMITED 2.37% 10 Largest Equity Holdings % PSG EQUITY Cash, Bond, Derivative & Money Market 30.51% Non Equity Holdings
  • 29.
    Page 29 PSG BalancedFund Sector Allocation There is little long-term risk in holding companies which offer: • Strong competitive positions • Proven aligned management • A margin of safety COMPANY % PSG BALANCED FIRSTRAND LIMITED 3.76% IMPERIAL HOLDINGS 3.56% OLD MUTUAL PLC 3.35% SUPER GROUP LIMITED 3.03% REUNERT LIMITED 2.76% DISCOVERY HLDS LTD 2.69% CAPITEC BANK HOLDINGS LTD 2.23% GLENCORE PLC 1.78% NEDBANK GROUP LTD 1.57% GROUP FIVE LIMITED 1.50% 10 Largest Equity Holdings % PSG BALANCED Bonds: + 7yrs 6.81% Bonds: 3-7yrs 6.96% Bonds: 1-3yrs 3.63% Cash Instruments: 3-7yrs 6.09% Cash Instruments: 1-3yrs 2.67% Cash, Bond, Derivative & Money Market <1yrs 10.49% Non Equity Holdings
  • 30.
    Page 30 PSG StableFund Sector Allocation COMPANY % PSG BALANCED BERKSHIRE HATHAWAY INC-CL B 2.40% BROOKFIELD ASSET MANAGE-CL A 1.84% FIRSTRAND LIMITED 1.77% IMPERIAL HOLDINGS 1.73% OLD MUTUAL PLC 1.61% SAINSBURY J PLC 1.54% COLFAX CORP 1.48% SUPER GROUP LIMITED 1.47% DISCOVERY HLDS LTD 1.39% MICROSOFT CORP 1.37% 10 Largest Equity Holdings % PSG BALANCED Bonds: + 7yrs 8.35% Bonds: 3-7yrs 7.21% Bonds: 1-3yrs 4.43% Cash Instruments: 3-7yrs 12.98% Cash Instruments: 1-3yrs 18.53% Cash, Bond, Derivative & Money Market <1yrs 13.15% Non Equity Holdings
  • 31.
    Page 31 Comments onPortfolio Positioning • Bottom up stock selection • Bias for quality • Quality equities have been in very high demand and prices are high • Distressed pricing in cyclical businesses, even good businesses • We tend to be early • We expect very good long term returns from our equity portfolios
  • 32.
  • 33.
    Page 33 Conclusion The contextof the market backdrop is important: • A long bull market in global equities • Majority of shares are sharply down from their recent highs. • Elevated valuations remain for quality defensives. We think they are overpriced. • Cyclical businesses have got very cheap. • We have been buyers of out-of-favour stocks that are mispriced: • Mining & construction: Glencore, Anglo, Group 5. • Cyclical SA inc businesses: Imperial, Reunert, Super Group. • Financials: US and SA banks, Old Mutual, Discovery. • We continue to see good opportunity within the global universe: Microsoft, Softbank. • We do not expect rand weakness to support returns to the same extent going forward. • We will be buyers of quality on the JSE when the margin of safety returns. • Our portfolios are extremely attractively priced: in both relative and absolute terms.
  • 35.
    Page 35 Disclaimer Disclaimer: CollectiveInvestment Schemes in Securities (CIS) are generally medium to long-term investments. The value of participatory interests (units) or the investment may go down as well as up and past performance is not a guide to future performance. CIS are traded at ruling prices and can engage in borrowing and script lending. Fluctuations or movements in the exchange rates may cause the value of underlying international investments to go up or down. Where foreign securities are included in a portfolio, the portfolio is exposed to risks such as potential constraints on liquidity and the repatriation of funds; macroeconomic, political, foreign exchange, tax, settlement and potential limitations on the availability of market information. The portfolios may be capped at any time in order for them to be managed in accordance with their mandate. Fees and Performance: Prices are published daily and available on the website www.psg.co.za and in the daily newspapers. A schedule of fees and charges and maximum commissions is available on request from PSG Collective Investments Limited. Commission and incentives may be paid and, if so, are included in the overall costs. Forward pricing is used. Different classes of Participatory Interest can apply to these portfolios and are subject to different fees, charges and possibly dividend withholding tax and will thus have differing performances. Performance is calculated for the portfolio and individual investor performance may differ as a result thereof. All performance data for a lump sum, net of fees, include income and assumes reinvestment of income on a NAV-NAV basis. Source of performance: Figures quoted are from Morningstar Inc. Additional information: Additional information is available free of charge on the website and may include publications, brochures, application forms and annual reports. Company details: PSG Collective Investments Limited is registered as a CIS Manager with the Financial Services Board, and a member of the Association of Savings and Investments South Africa (ASISA) through its holdings company PSG Konsult Limited. The management of the portfolios is delegated to PSG Asset Management (Pty) Ltd, an authorized Financial Services Provider under the Financial Advisory and Intermediary Services Act 2002, FSP no 29524. PSG Asset Management (Pty) Ltd and PSG Collective Investments Limited are subsidiaries of PSG Group Limited. Money Market: The PSG Money Market Fund maintains a constant price and targeted at a constant value. The quoted yield is calculated by annualizing the average 7 day yield. A money market portfolio is not a bank deposit account. Excessive withdrawals from the portfolio may place the portfolio under liquidity pressures and in such circumstances a process of ring-fencing of withdrawal instructions and managed payouts over time may be followed. The total return to the investor is made up of interest received and any gain or loss made on any particular instrument. In most cases the return will merely have the effect of increasing or decreasing the daily yield but in the case of abnormal losses it can have the effect of reducing the capital value of the portfolio. Trustee: The Standard Bank of South Africa Limited, Main Tower, Standard Bank Centre, 2 Hertzog Boulevard, Cape Town, 8001. Tel: 021 401 2443. Email: compliance-PSG@standardbank.co.za. Conflict of Interest Disclosure: The Fund may from time to time invest in a portfolio managed by a related party. PSG Collective Investments Limited or the Fund Manager may negotiate a discount in fees charged by the underlying portfolio. All discounts negotiated are re-invested in the Fund for the benefit of the investor. Neither PSG Collective Investments Limited nor PSG Asset Management retains any portion of such discount for their own accounts. The Fund Manager may use the brokerage services of a related party, PSG Securities Ltd. PSG Collective Investments Limited does not provide any guarantee either with respect to the capital or the return of the portfolio and can be contacted on 0800 600 168 or e-mail, psgassetmanagement@psg.co.za

Editor's Notes

  • #13 Margin of safety – difference security is worth and the price you pay. Sufficient discount and your estimate of intrinsic value turns out to be correct – good investment. Vice versa. Key – lots of things know you don’t know – appraisals of IV as conservative as possible. Oscillates between fear and greed – price paid and intrinsic value as irrational. Buying early and buying wrong. Fear and uncertainty – best place to find bargains. Dislocation between the economic environment or the apparent prospects for that company. The investors in our funds often struggle with this – buying when the macro environment is poor. We often end up buying early – believe there is a margin of safety – just don’t know where the bottom is. However significantly more upside than downside – often multiples more. When a value investor gets its wrong – typically be because your estimate of intrinsic value tends to be wrong. Think you are buying with a margin of safety turns out to be wrong. Two examples from our past.
  • #19 In practice. Buy low and sell high; buy when there is a margin of safety. Below – above average companies below average prices. Few companies below our conservative appraisals of fair value. Essence of value investing. P/E of the holdings in the fund = 9.3x at the end of December. Core DNA of our team.
  • #21 In 2015 more interested in domestic SA GDP; earnings were low; misunderstood by the market. Sold off aggressively on the fear of a deep recession; P/E around 8x – good companies in that basket : Imperial, Supergroup, Reunert; long term P/E of the market is around 14x; at least as good as the average company – significantly better; stand out opportunity.
  • #22 We have felt that many of SA’s blue chip companies were expensive – high multiples on high earnings. Talked about this in previous forums like this. Remained expensive; include Naspers in this basket even more expensive. Remained expensive as the Rand has weakened – rand hedge stocks. Prefer to buy above average companies on low P/E’s than above average companies on high PE’s. Low P/E low embedded expectations – propensity typically work out better than you think. If you buy high P/E companies – hoping that the future works out even better than the lofty expectations baked into the share prices. History has suggested that this is not a winning strategy. If those companies disappoint even marginally, proper whack. A good example is Mr Price – disappointed in a trading update – stock was down 17% on the day. A good company is not always a safe investment.