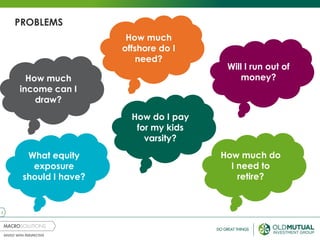
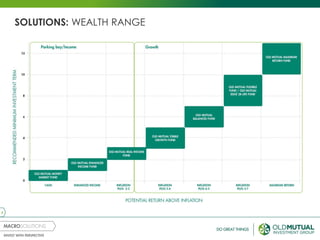
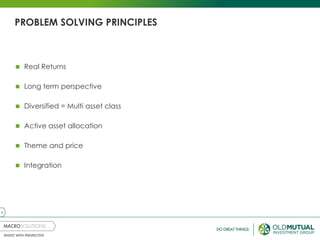
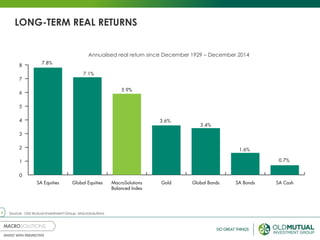
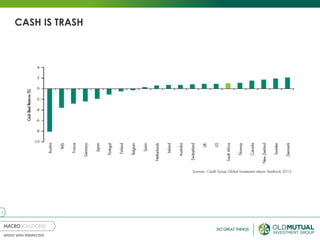
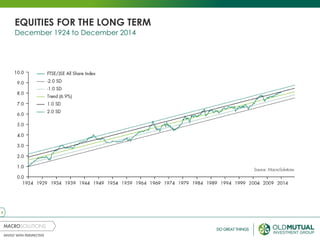
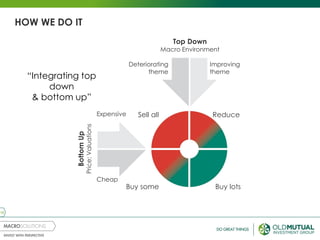
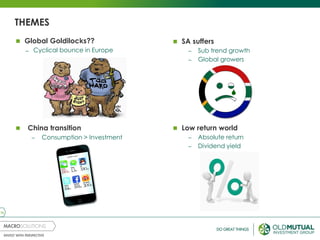
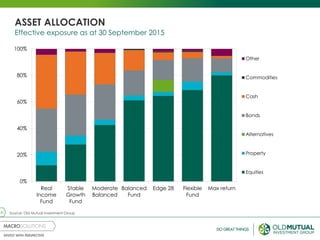
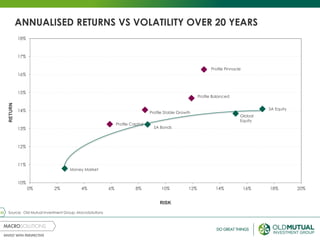
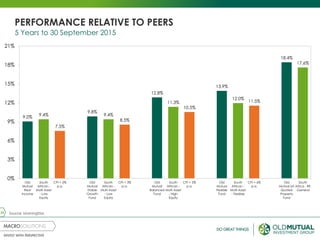
LONG TERM
PERSPECTIVES
Peter Brooke
MacroSolutions
2
PROBLEMS
How much
offshore do I
need?
How much
income can I
draw?
How much do
I need to
retire?
Will I run out of
money?
How do I pay
for my kids
varsity?
What equity
exposure
should I have?
3
SOLUTIONS: WEALTH RANGE
4
PROBLEM SOLVING PRINCIPLES
 Real Returns
 Long term perspective
 Diversified = Multi asset class
 Active asset allocation
 Theme and price
 Integration
5
REAL SOLUTIONS
Note: For inflation we used the relevant average inflation since 1990
Expense Cost Today Cost in 10 yrs Cost in 25 yrs
Inflation
Rate
1st Year Study
(Medical Degree)
R130 000 R308 000 R1.1m 9%
Kidney Dialysis
(per year)
R150 000 R414 000 R1.9m 10.7%
Family Sedan
(1300cc engine)
R200 000 R348 000 R800 000 5.7%
6
Annualised real return since December 1929 – December 2014
LONG-TERM REAL RETURNS
Source: Old Mutual Investment Group, MacroSolutions
7
CASH IS TRASH
8
EQUITIES FOR THE LONG TERM
December 1924 to December 2014
9
December 1924 to December 2014
RISK | DRAWDOWN FTSE/JSE ALL SHARE INDEX
10
December 1924 to December 2014
RISK | DRAWDOWN ALL BOND INDEX
11
TIME
Source: Old Mutual Investment Group, MacroSolutions
1 day and 1 week: Rolling total returns, June 1995 to current
1 month to 10 years: Rolling total returns, January 1925 to current
12
DIVERSIFICATION
Source: Old Mutual Investment Group, MacroSolutions
13
ACTIVE ASSET ALLOCATION
Source: Old Mutual Investment Group, MacroSolutions
14
EXCELLENT ASSET ALLOCATORS
 Independent endorsement of MacroSolutions being the best in the
industry
̶ BNP Paribas/Cadiz Securities study measured asset allocation alpha (relative
to peer average) on rolling 1, 2, 3, 4, 5, 10yrs.
̶ MacroSolutions have delivered the best average alpha in almost all these
periods, and have done it with the least risk!
 Bottom line: This is a different source of alpha that we have been very
successful at capturing!
15
Buy lots
Cheap
Expensive
BottomUp
Price:Valuations
Reduce
Buy some
Sell all
Deteriorating
theme
Improving
theme
Top Down
Macro Environment
“Integrating top
down
& bottom up”
HOW WE DO IT
16
THEMES
 Global Goldilocks??
̶ Cyclical bounce in Europe
 SA suffers
– Sub trend growth
– Global growers
 China transition
– Consumption > Investment
 Low return world
– Absolute return
– Dividend yield
17
GLOBAL GROWTH
-2
0
2
4
-4
6
05 07 11 13
-2
0
2
4
-4
6
1509
World growth
1990 – 2014 ave
Excl 2008/9
Source: Old Mutual Investment Group
18
CHINA TRANSITION |GDP GROWTH AFTER INVESTMENT RATE PEAKS
Source: Old Mutual Investment Group, MacroSolutions, Trailing 10y average GDP rates around the peak in the investment to GDP ratio
0
2
4
6
8
10
12
Japan - peak in 1973 USA - peak in 1979 Korea - peak in 1991 China - peak in 2010
10yr prior to peak
At peak
10yr after peak
20yr after peak
30yr after peak
19
SA SUFFERS
SA
suffe
rs
− Inflation
− Growth
− Employment
− Deficits
− Policy
20
PRICE: LOW RETURN WORLD
SA
Equity
Property
Bonds
Cash
Global*
Equity
Bonds
Cash
Real return View
5.0%
4.5%
2.5%
0.5%
5.0%
-1.0%
-1.0%
Neutral
Neutral
–
Neutral
+
–
–
More balanced outlook
Key risk is earnings delivery as economy
battles
Growing risk following huge bull market
Lack of alternatives makes SA bonds
attractive
Hawkish Reserve Bank helping boost returns
Maintain diversification for
risk management
Best risk adjusted returns
Record low yields = low returns
Cash is trash
Source: Old Mutual Investment Group | NB: These are long-term, real returns expected over the next five years, as at 15 July 2015
* The international return expectations above are in US Dollar terms; any rand depreciation will add to returns in rands.
Comment
Neutral
+
–
21
0%
20%
40%
60%
80%
100%
Real
Income
Fund
Stable
Growth
Fund
Moderate
Balanced
Balanced
Fund
Edge 28 Flexible
Fund
Max return
Other (Multi Asset Class)
Commodities
Cash
Bonds
Alternatives
Property
Equities
ASSET ALLOCATION
Effective exposure as at 30 September 2015
Source: Old Mutual Investment Group
Does it work?
23
ANNUALISED RETURNS VS VOLATILITY OVER 20 YEARS
Source: Old Mutual Investment Group, MacroSolutions
10%
11%
12%
13%
14%
15%
16%
17%
18%
0% 2% 4% 6% 8% 10% 12% 14% 16% 18% 20%
RISK
RETURN
Profile Capital
Profile Stable Growth
Profile Balanced
Profile Pinnacle
Money Market
SA Bonds
Global
Equity
SA Equity
24
PERFORMANCE RELATIVE TO PEERS
5 Years to 30 September 2015
Source: MorningStar
9.0% 9.4%
7.5%
9.8%
9.4%
8.5%
12.8%
11.3%
10.5%
13.9%
12.0%
11.5%
18.4%
17.6%
0%
3%
6%
9%
12%
15%
18%
21%
Old
Mutual
Real
Income
South
African -
Multi Asset
- Low
Equity
CPI + 2%
p.a.
Old
Mutual
Stable
Growth
Fund
South
African -
Multi Asset
- Low
Equity
CPI + 3%
p.a.
Old
Mutual
Balanced
Fund
South
African -
Multi Asset
- High
Equity
CPI + 5%
p.a.
Old
Mutual
Flexible
Fund
South
African -
Multi Asset
- Flexible
CPI + 6%
p.a.
Old
Mutual SA
Quoted
Property
Fund
South
Africa - RE
-General
25
CONCLUSION
 Multi-asset class solutions solve most client problems
 Inflation is the No. 1 enemy
 One needs to take a long-term view
 Active asset allocation adds value
 MacroSolutions has stood the test of time
26
REGULATORY INFORMATION
Old Mutual Investment Group (Pty) Limited
Physical Address: Mutualpark, Jan Smuts Drive, Pinelands, 7405
Telephone number: +27 21 509 5022
Old Mutual Investment Group (Pty) Limited (Reg No 1993/003023/07) is a licensed financial services provider, FSP 604, approved by the Registrar of Financial Services
Providers (www.fsb.co.za) to provide intermediary services and advice in terms of the Financial Advisory and Intermediary Services Act 37 of 2002.
Market fluctuations and changes in rates of exchange or taxation may have an effect on the value, price or income of investments. Since the performance of financial
markets fluctuates, an investor may not get back the full amount invested. Past performance is not necessarily a guide to future investment performance. The investment
portfolios may be market-linked or policy based. Investors’ rights and obligations are set out in the relevant contracts. In respect of pooled, life wrapped products, the
underlying assets are owned by Old Mutual Life Assurance Company (South Africa) Limited who may elect to exercise any votes on these underlying assets
independently of Old Mutual Investment Group. In respect of these products, no fees or charges will be deducted if the policy is terminated within the first 30 days.
Returns on these products depend on the performance of the underlying assets.
Disclosures: Personal trading by staff is restricted to ensure that there is no conflict of interest. All directors and those staff who are likely to have access to price sensitive
and unpublished information in relation to the Old Mutual Group are further restricted in their dealings in Old Mutual shares. All employees of the Old Mutual Investment
Group are remunerated with salaries and standard incentives. Unless disclosed to the client, no commission or incentives are paid by the Old Mutual Investment Group to
any persons other than its representatives. All inter-group transactions are done on an arms length basis. We outsource investment administration of our local funds to
Curo Fund Services (Pty) Ltd, 50% of which is owned by the Old Mutual Investment Group.
Disclaimer: The contents of this document and, to the extent applicable, the comments by presenters do not constitute advice as defined in FAIS. Although due care has
been taken in compiling this document, Old Mutual Investment Group does not warrant the accuracy of the information contained herein and therefore does not
accept any liability in respect of any loss you may suffer as a result of your reliance thereon. The processes, policies and business practices described may change from
time to time and Old Mutual Investment Group specifically excludes any obligation to communicate such changes to the recipient of this document.
This document is not an advertisement and it is not intended for general public distribution. The recipient is advised to assess the information with the assistance of an
advisor if necessary, with regard to its compatibility with his/her own circumstances in view of any legal, regulatory, tax and other implications. The information herein
does not constitute an offer to sell or a solicitation of an offer to buy any securities. This document is expressly not intended for persons who, due to their nationality or
place of residence, are not permitted access to such information under applicable law.
Old Mutual Investment Group has comprehensive crime and professional indemnity insurance. For more detail, as well as for information on how to contact us and on
how to access information please visit www.oldmutualinvest.com.

Old mutual - Senate Group presentation Nov 2015

  • 1.
  • 2.
    2 PROBLEMS How much offshore doI need? How much income can I draw? How much do I need to retire? Will I run out of money? How do I pay for my kids varsity? What equity exposure should I have?
  • 3.
  • 4.
    4 PROBLEM SOLVING PRINCIPLES Real Returns  Long term perspective  Diversified = Multi asset class  Active asset allocation  Theme and price  Integration
  • 5.
    5 REAL SOLUTIONS Note: Forinflation we used the relevant average inflation since 1990 Expense Cost Today Cost in 10 yrs Cost in 25 yrs Inflation Rate 1st Year Study (Medical Degree) R130 000 R308 000 R1.1m 9% Kidney Dialysis (per year) R150 000 R414 000 R1.9m 10.7% Family Sedan (1300cc engine) R200 000 R348 000 R800 000 5.7%
  • 6.
    6 Annualised real returnsince December 1929 – December 2014 LONG-TERM REAL RETURNS Source: Old Mutual Investment Group, MacroSolutions
  • 7.
  • 8.
    8 EQUITIES FOR THELONG TERM December 1924 to December 2014
  • 9.
    9 December 1924 toDecember 2014 RISK | DRAWDOWN FTSE/JSE ALL SHARE INDEX
  • 10.
    10 December 1924 toDecember 2014 RISK | DRAWDOWN ALL BOND INDEX
  • 11.
    11 TIME Source: Old MutualInvestment Group, MacroSolutions 1 day and 1 week: Rolling total returns, June 1995 to current 1 month to 10 years: Rolling total returns, January 1925 to current
  • 12.
    12 DIVERSIFICATION Source: Old MutualInvestment Group, MacroSolutions
  • 13.
    13 ACTIVE ASSET ALLOCATION Source:Old Mutual Investment Group, MacroSolutions
  • 14.
    14 EXCELLENT ASSET ALLOCATORS Independent endorsement of MacroSolutions being the best in the industry ̶ BNP Paribas/Cadiz Securities study measured asset allocation alpha (relative to peer average) on rolling 1, 2, 3, 4, 5, 10yrs. ̶ MacroSolutions have delivered the best average alpha in almost all these periods, and have done it with the least risk!  Bottom line: This is a different source of alpha that we have been very successful at capturing!
  • 15.
    15 Buy lots Cheap Expensive BottomUp Price:Valuations Reduce Buy some Sellall Deteriorating theme Improving theme Top Down Macro Environment “Integrating top down & bottom up” HOW WE DO IT
  • 16.
    16 THEMES  Global Goldilocks?? ̶Cyclical bounce in Europe  SA suffers – Sub trend growth – Global growers  China transition – Consumption > Investment  Low return world – Absolute return – Dividend yield
  • 17.
    17 GLOBAL GROWTH -2 0 2 4 -4 6 05 0711 13 -2 0 2 4 -4 6 1509 World growth 1990 – 2014 ave Excl 2008/9 Source: Old Mutual Investment Group
  • 18.
    18 CHINA TRANSITION |GDPGROWTH AFTER INVESTMENT RATE PEAKS Source: Old Mutual Investment Group, MacroSolutions, Trailing 10y average GDP rates around the peak in the investment to GDP ratio 0 2 4 6 8 10 12 Japan - peak in 1973 USA - peak in 1979 Korea - peak in 1991 China - peak in 2010 10yr prior to peak At peak 10yr after peak 20yr after peak 30yr after peak
  • 19.
    19 SA SUFFERS SA suffe rs − Inflation −Growth − Employment − Deficits − Policy
  • 20.
    20 PRICE: LOW RETURNWORLD SA Equity Property Bonds Cash Global* Equity Bonds Cash Real return View 5.0% 4.5% 2.5% 0.5% 5.0% -1.0% -1.0% Neutral Neutral – Neutral + – – More balanced outlook Key risk is earnings delivery as economy battles Growing risk following huge bull market Lack of alternatives makes SA bonds attractive Hawkish Reserve Bank helping boost returns Maintain diversification for risk management Best risk adjusted returns Record low yields = low returns Cash is trash Source: Old Mutual Investment Group | NB: These are long-term, real returns expected over the next five years, as at 15 July 2015 * The international return expectations above are in US Dollar terms; any rand depreciation will add to returns in rands. Comment Neutral + –
  • 21.
    21 0% 20% 40% 60% 80% 100% Real Income Fund Stable Growth Fund Moderate Balanced Balanced Fund Edge 28 Flexible Fund Maxreturn Other (Multi Asset Class) Commodities Cash Bonds Alternatives Property Equities ASSET ALLOCATION Effective exposure as at 30 September 2015 Source: Old Mutual Investment Group
  • 22.
  • 23.
    23 ANNUALISED RETURNS VSVOLATILITY OVER 20 YEARS Source: Old Mutual Investment Group, MacroSolutions 10% 11% 12% 13% 14% 15% 16% 17% 18% 0% 2% 4% 6% 8% 10% 12% 14% 16% 18% 20% RISK RETURN Profile Capital Profile Stable Growth Profile Balanced Profile Pinnacle Money Market SA Bonds Global Equity SA Equity
  • 24.
    24 PERFORMANCE RELATIVE TOPEERS 5 Years to 30 September 2015 Source: MorningStar 9.0% 9.4% 7.5% 9.8% 9.4% 8.5% 12.8% 11.3% 10.5% 13.9% 12.0% 11.5% 18.4% 17.6% 0% 3% 6% 9% 12% 15% 18% 21% Old Mutual Real Income South African - Multi Asset - Low Equity CPI + 2% p.a. Old Mutual Stable Growth Fund South African - Multi Asset - Low Equity CPI + 3% p.a. Old Mutual Balanced Fund South African - Multi Asset - High Equity CPI + 5% p.a. Old Mutual Flexible Fund South African - Multi Asset - Flexible CPI + 6% p.a. Old Mutual SA Quoted Property Fund South Africa - RE -General
  • 25.
    25 CONCLUSION  Multi-asset classsolutions solve most client problems  Inflation is the No. 1 enemy  One needs to take a long-term view  Active asset allocation adds value  MacroSolutions has stood the test of time
  • 26.
    26 REGULATORY INFORMATION Old MutualInvestment Group (Pty) Limited Physical Address: Mutualpark, Jan Smuts Drive, Pinelands, 7405 Telephone number: +27 21 509 5022 Old Mutual Investment Group (Pty) Limited (Reg No 1993/003023/07) is a licensed financial services provider, FSP 604, approved by the Registrar of Financial Services Providers (www.fsb.co.za) to provide intermediary services and advice in terms of the Financial Advisory and Intermediary Services Act 37 of 2002. Market fluctuations and changes in rates of exchange or taxation may have an effect on the value, price or income of investments. Since the performance of financial markets fluctuates, an investor may not get back the full amount invested. Past performance is not necessarily a guide to future investment performance. The investment portfolios may be market-linked or policy based. Investors’ rights and obligations are set out in the relevant contracts. In respect of pooled, life wrapped products, the underlying assets are owned by Old Mutual Life Assurance Company (South Africa) Limited who may elect to exercise any votes on these underlying assets independently of Old Mutual Investment Group. In respect of these products, no fees or charges will be deducted if the policy is terminated within the first 30 days. Returns on these products depend on the performance of the underlying assets. Disclosures: Personal trading by staff is restricted to ensure that there is no conflict of interest. All directors and those staff who are likely to have access to price sensitive and unpublished information in relation to the Old Mutual Group are further restricted in their dealings in Old Mutual shares. All employees of the Old Mutual Investment Group are remunerated with salaries and standard incentives. Unless disclosed to the client, no commission or incentives are paid by the Old Mutual Investment Group to any persons other than its representatives. All inter-group transactions are done on an arms length basis. We outsource investment administration of our local funds to Curo Fund Services (Pty) Ltd, 50% of which is owned by the Old Mutual Investment Group. Disclaimer: The contents of this document and, to the extent applicable, the comments by presenters do not constitute advice as defined in FAIS. Although due care has been taken in compiling this document, Old Mutual Investment Group does not warrant the accuracy of the information contained herein and therefore does not accept any liability in respect of any loss you may suffer as a result of your reliance thereon. The processes, policies and business practices described may change from time to time and Old Mutual Investment Group specifically excludes any obligation to communicate such changes to the recipient of this document. This document is not an advertisement and it is not intended for general public distribution. The recipient is advised to assess the information with the assistance of an advisor if necessary, with regard to its compatibility with his/her own circumstances in view of any legal, regulatory, tax and other implications. The information herein does not constitute an offer to sell or a solicitation of an offer to buy any securities. This document is expressly not intended for persons who, due to their nationality or place of residence, are not permitted access to such information under applicable law. Old Mutual Investment Group has comprehensive crime and professional indemnity insurance. For more detail, as well as for information on how to contact us and on how to access information please visit www.oldmutualinvest.com.