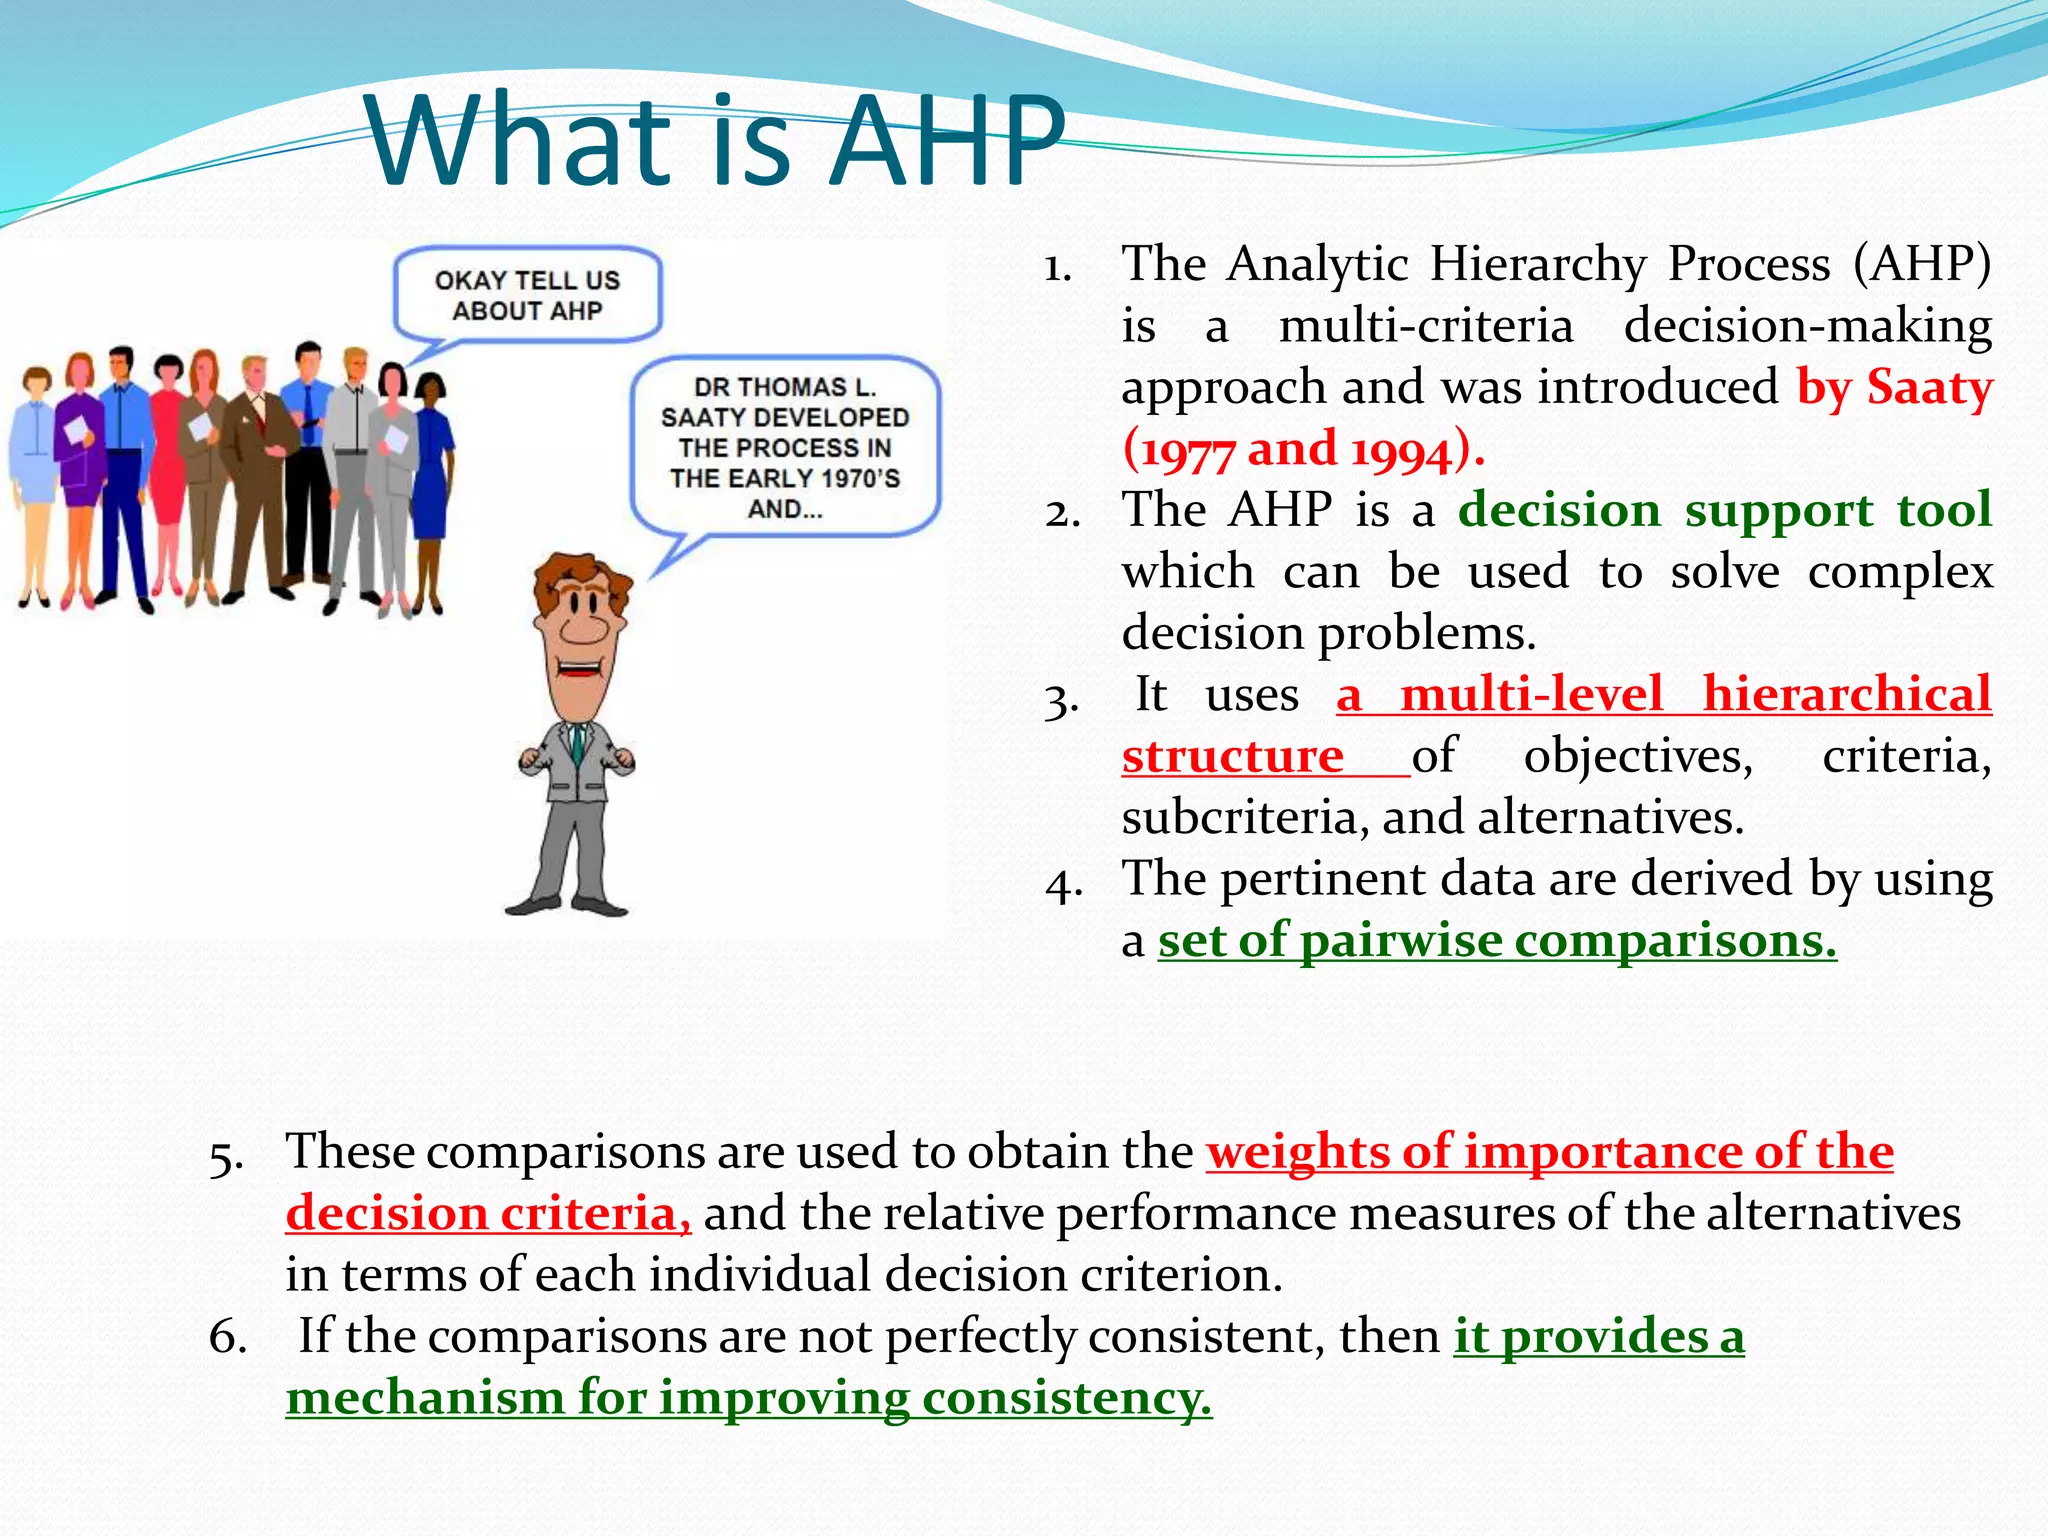
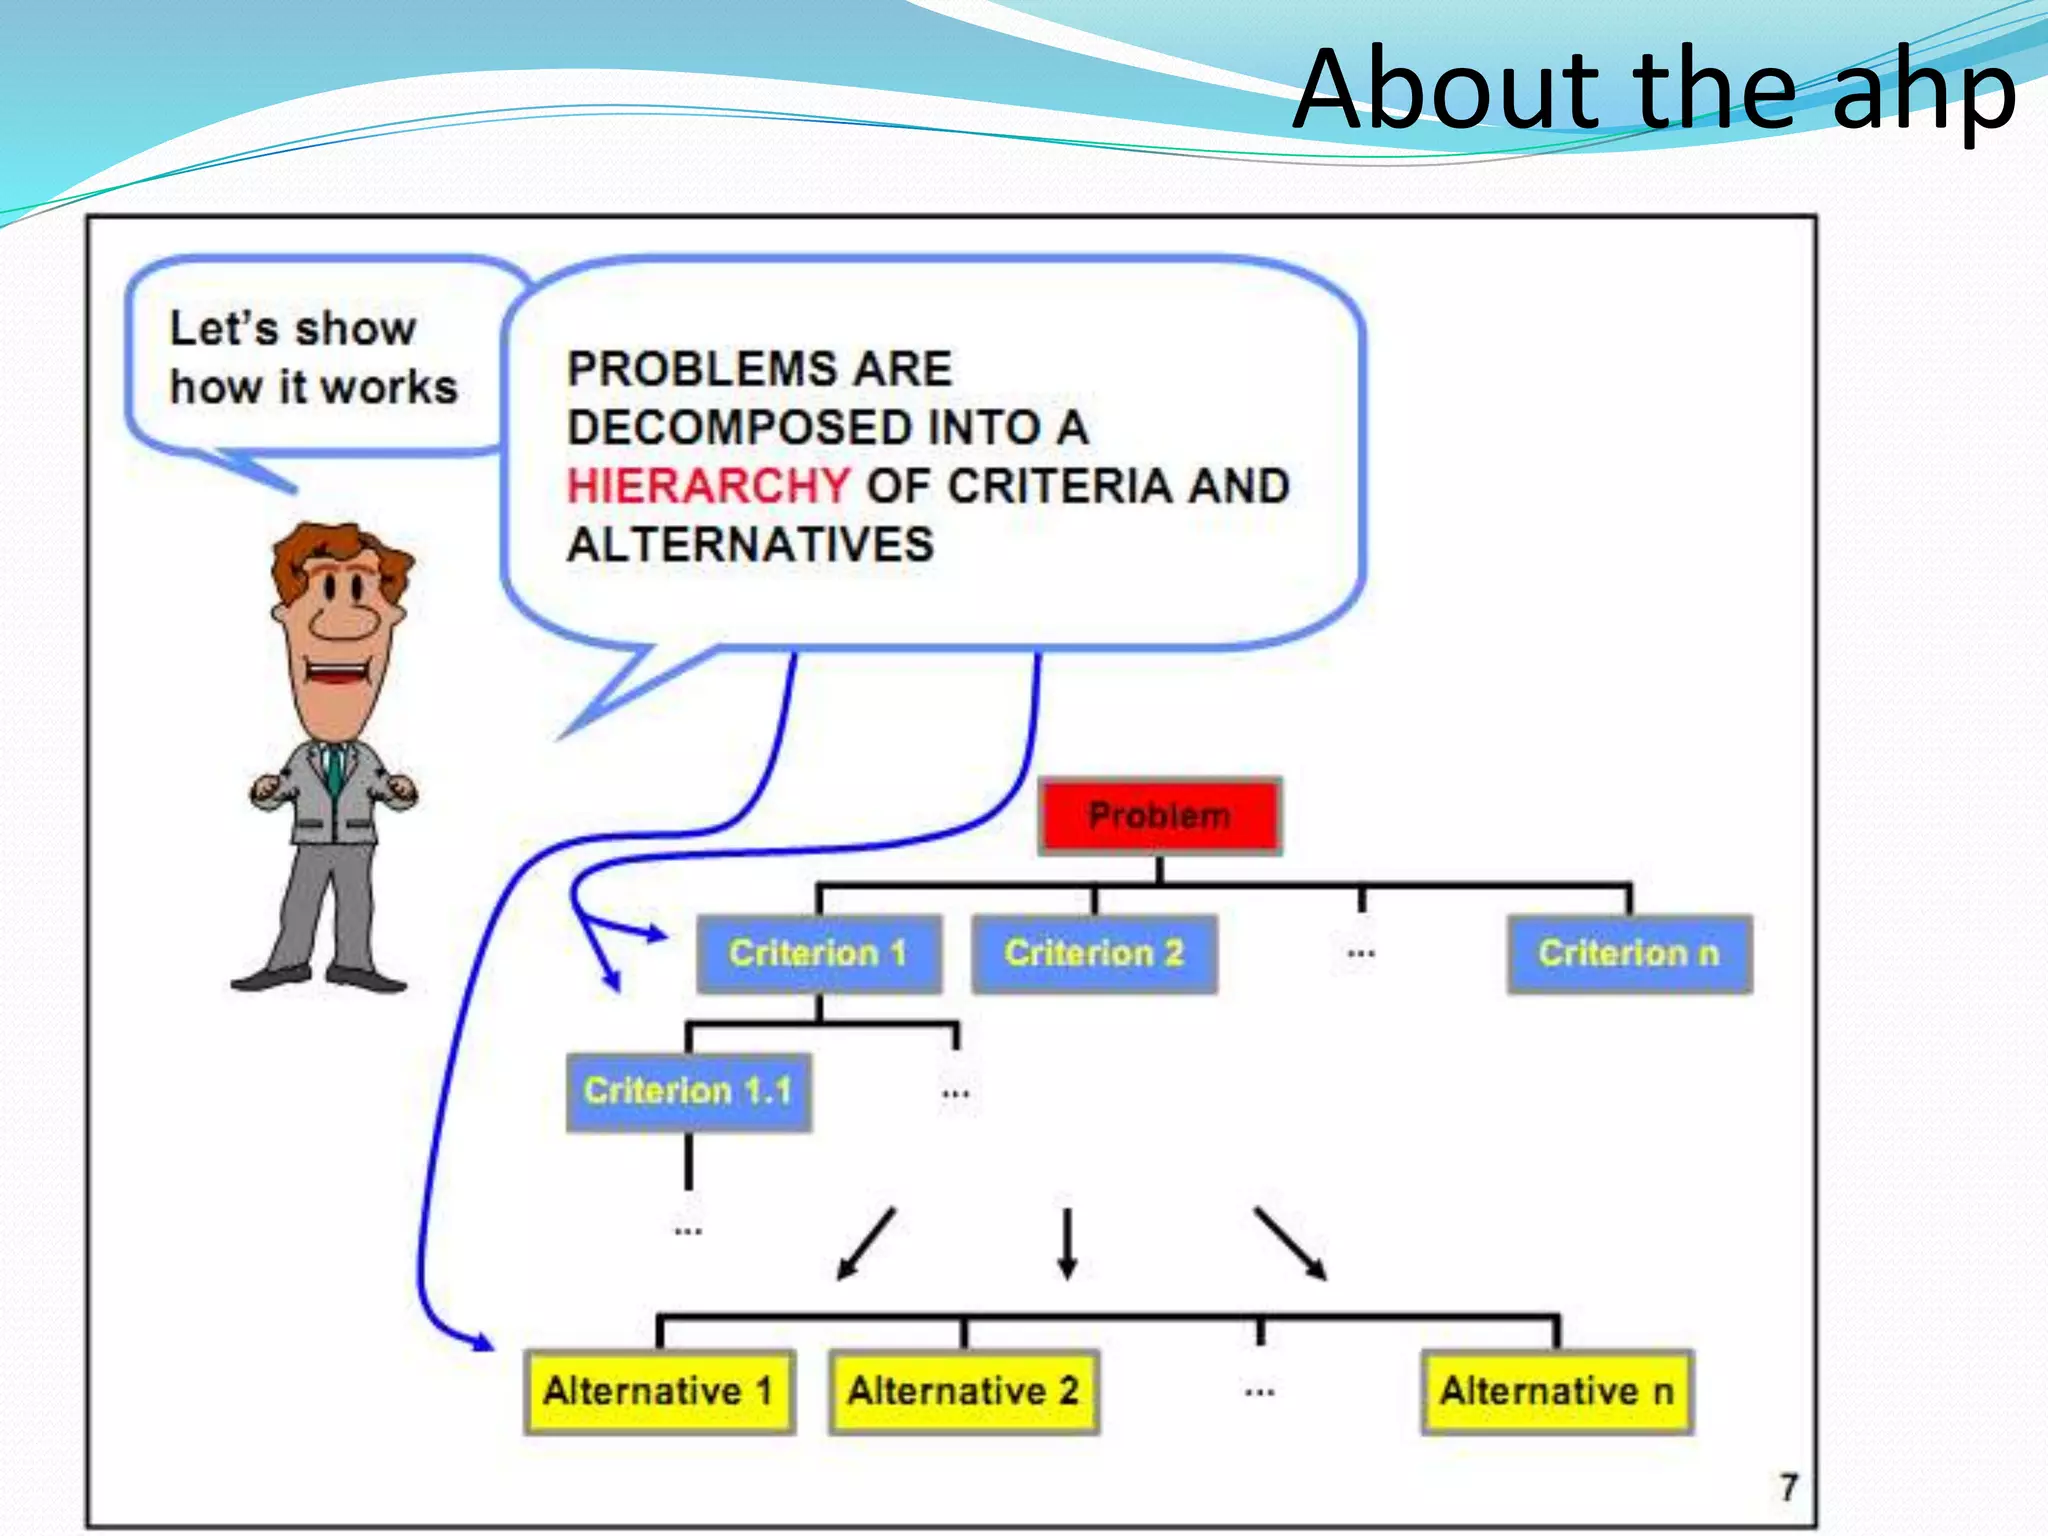
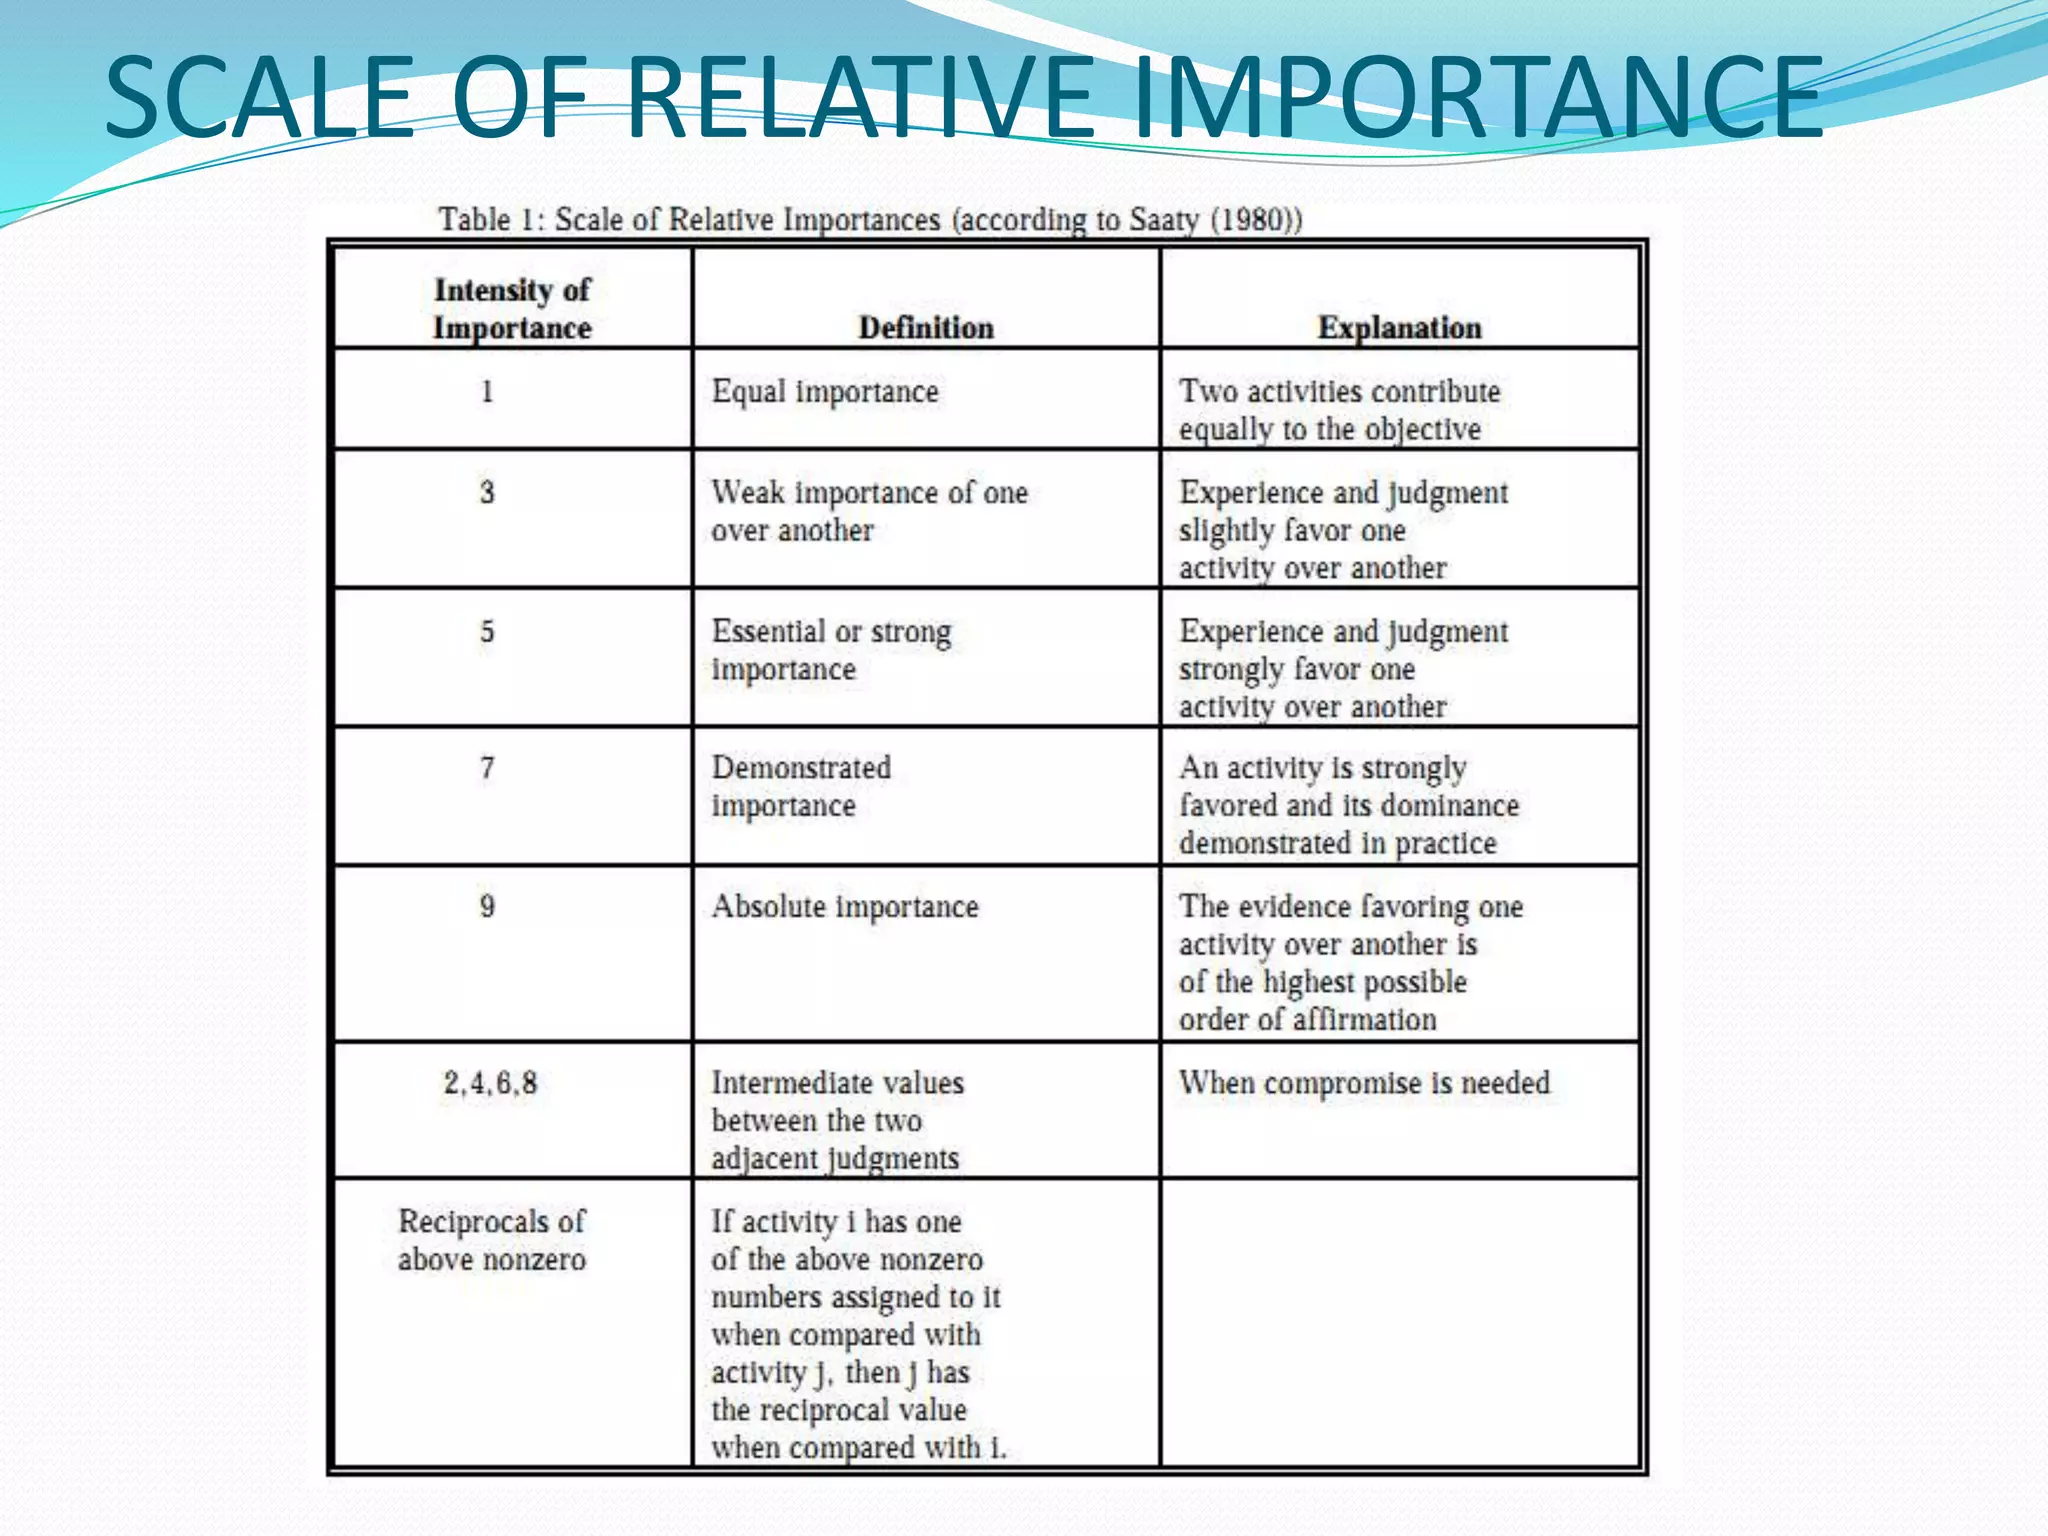
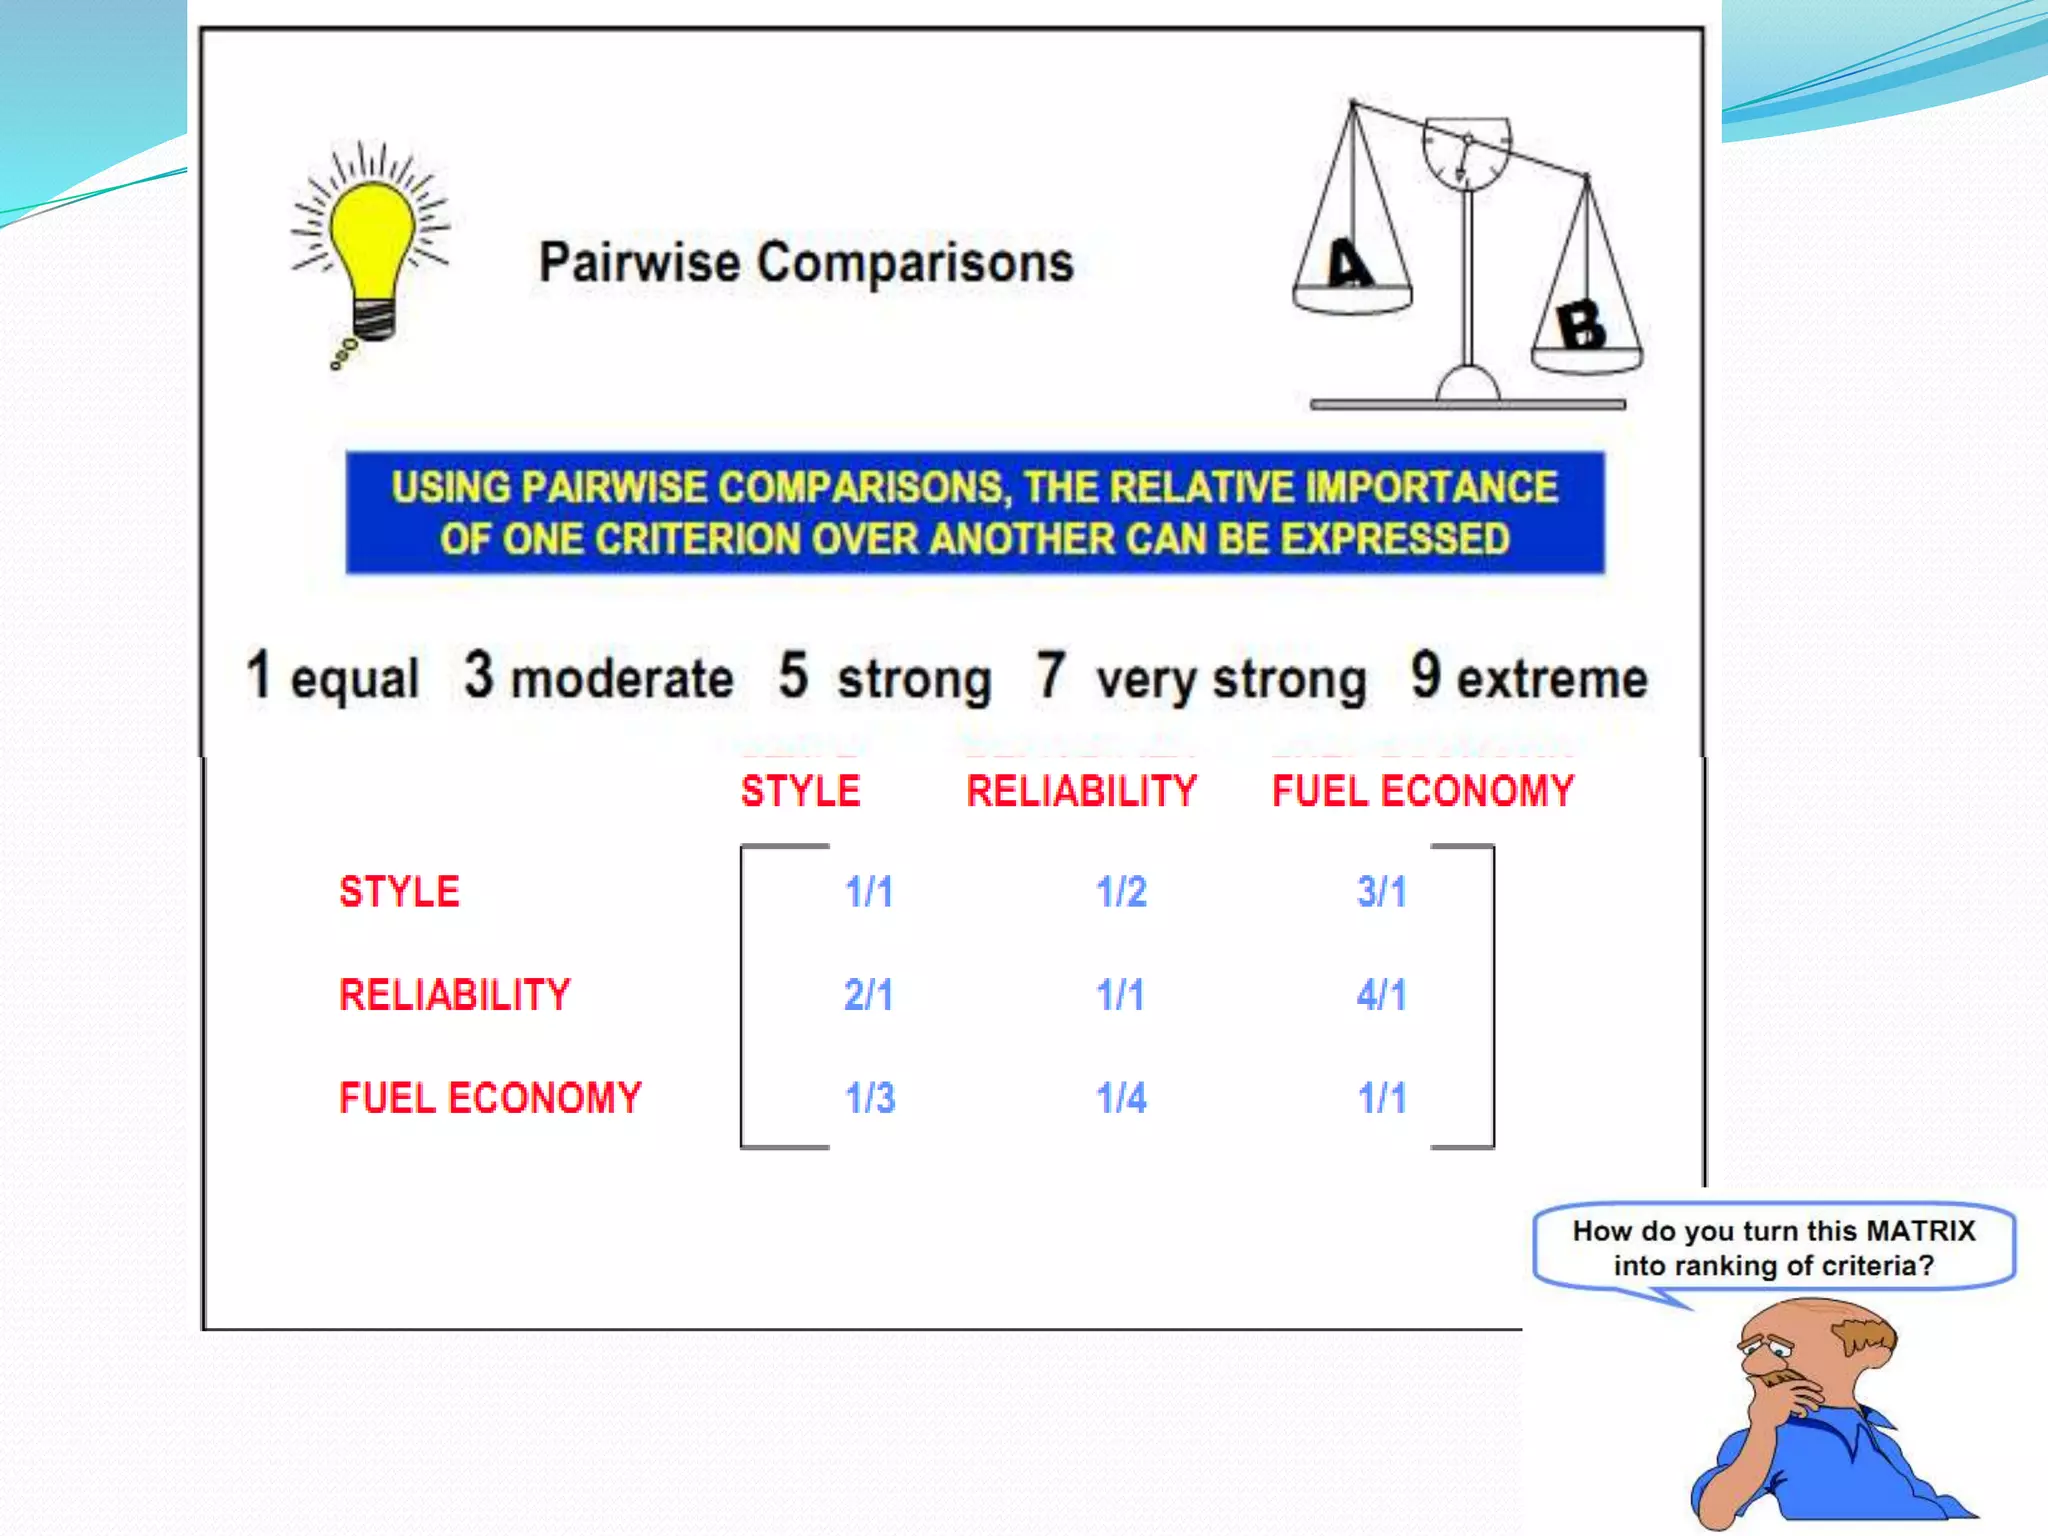
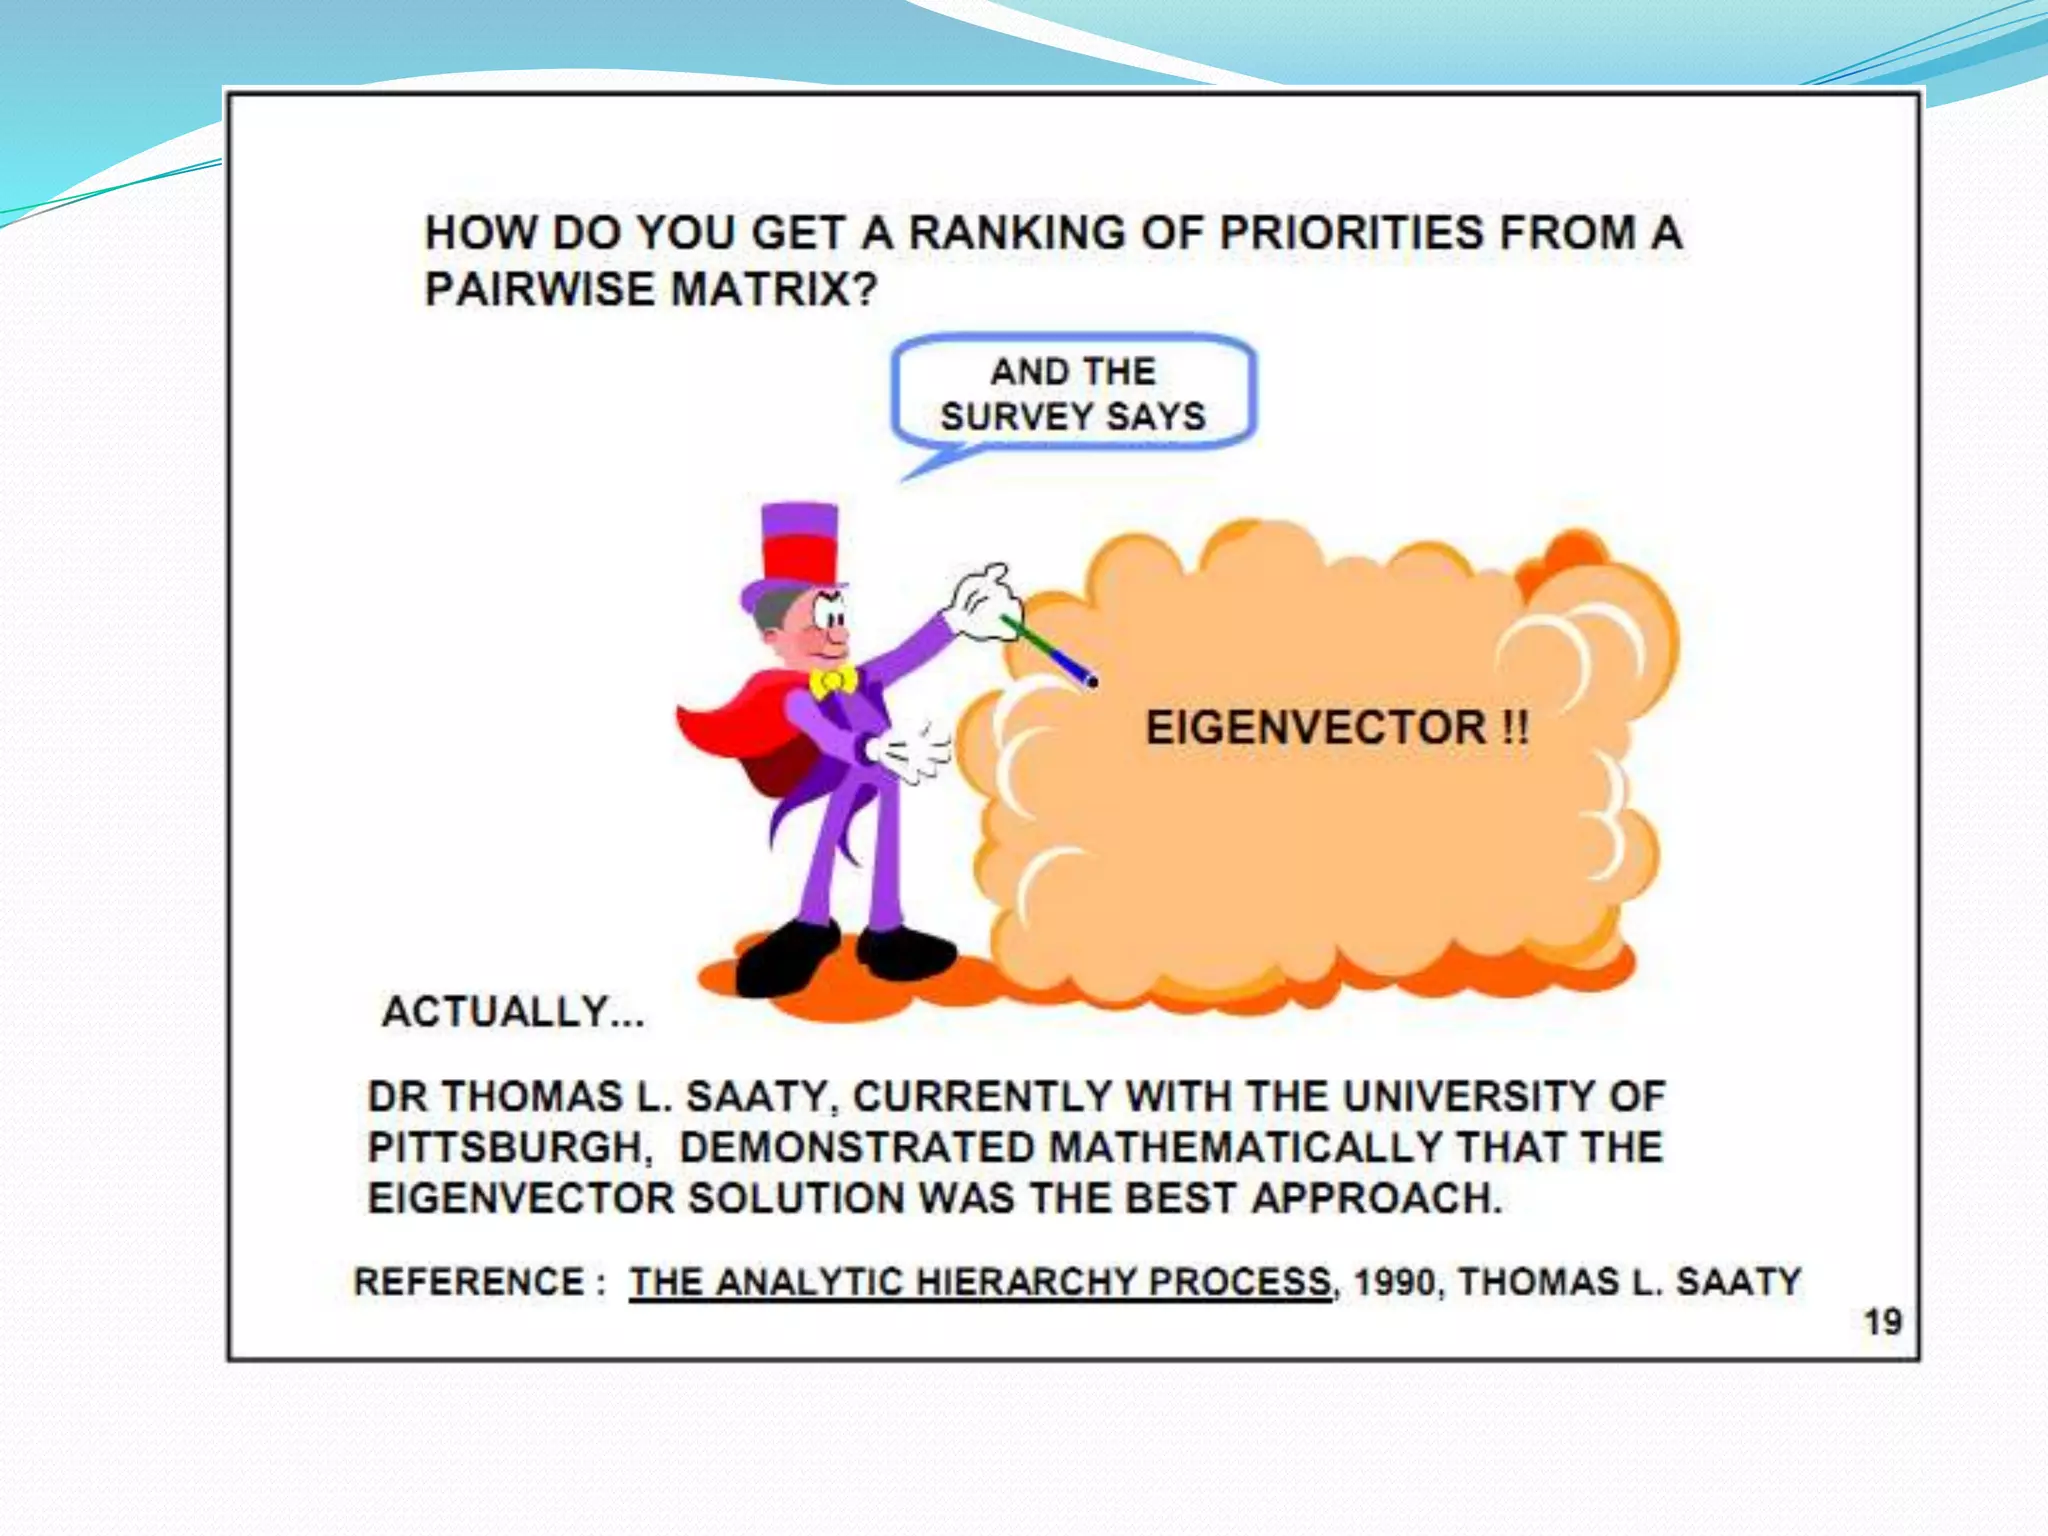
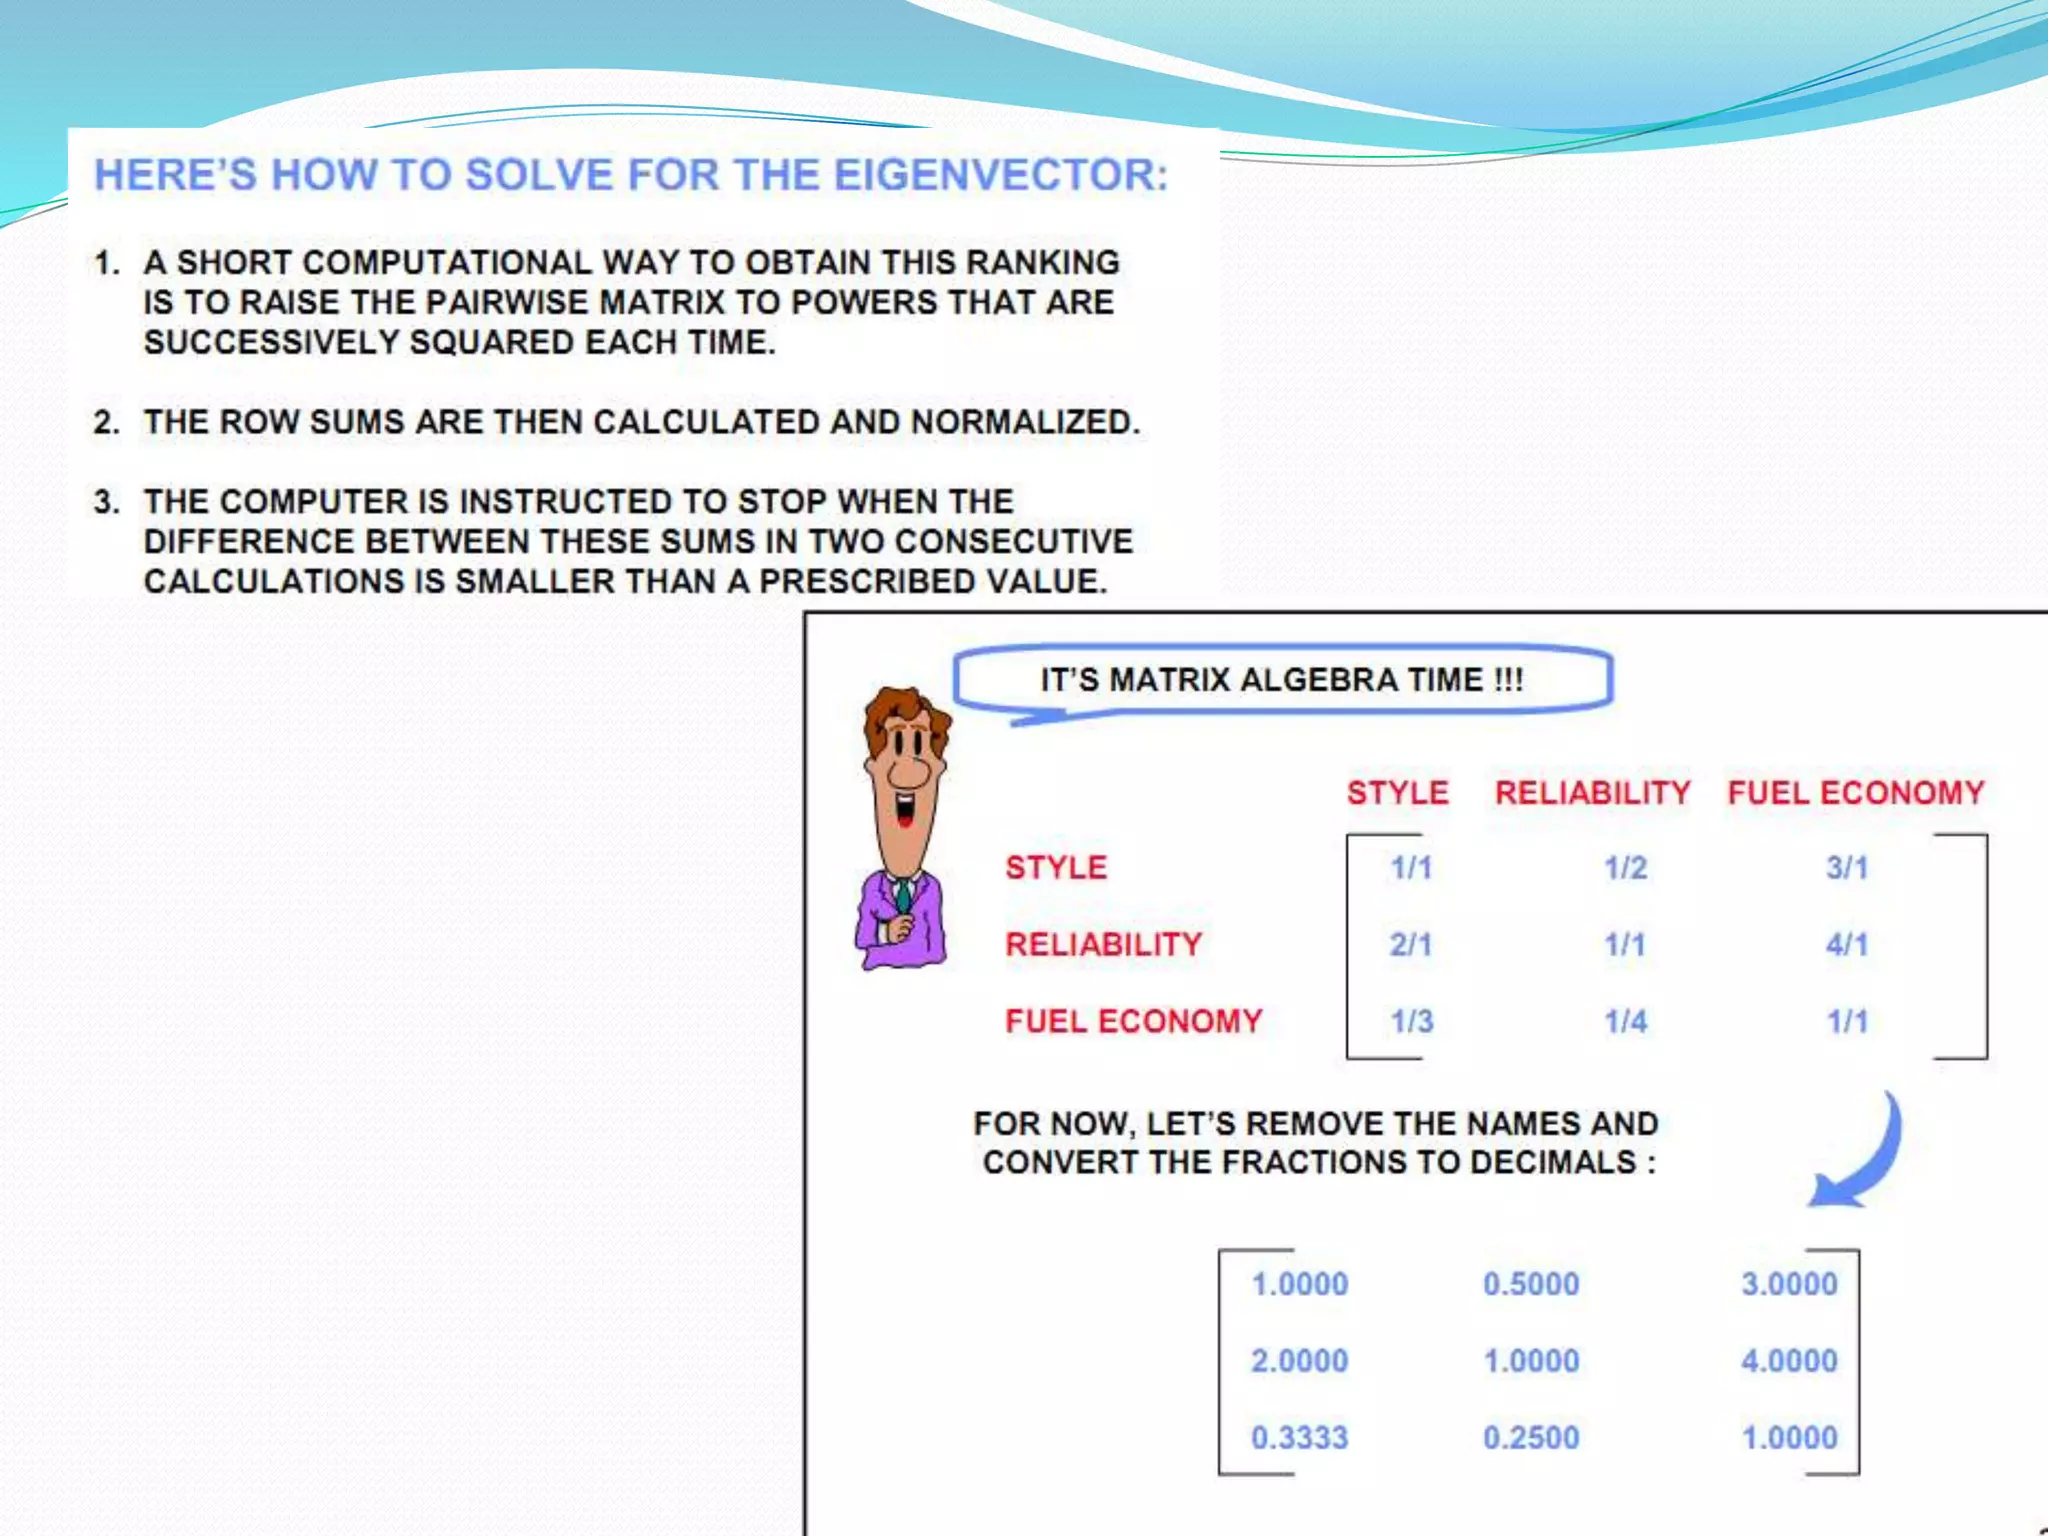
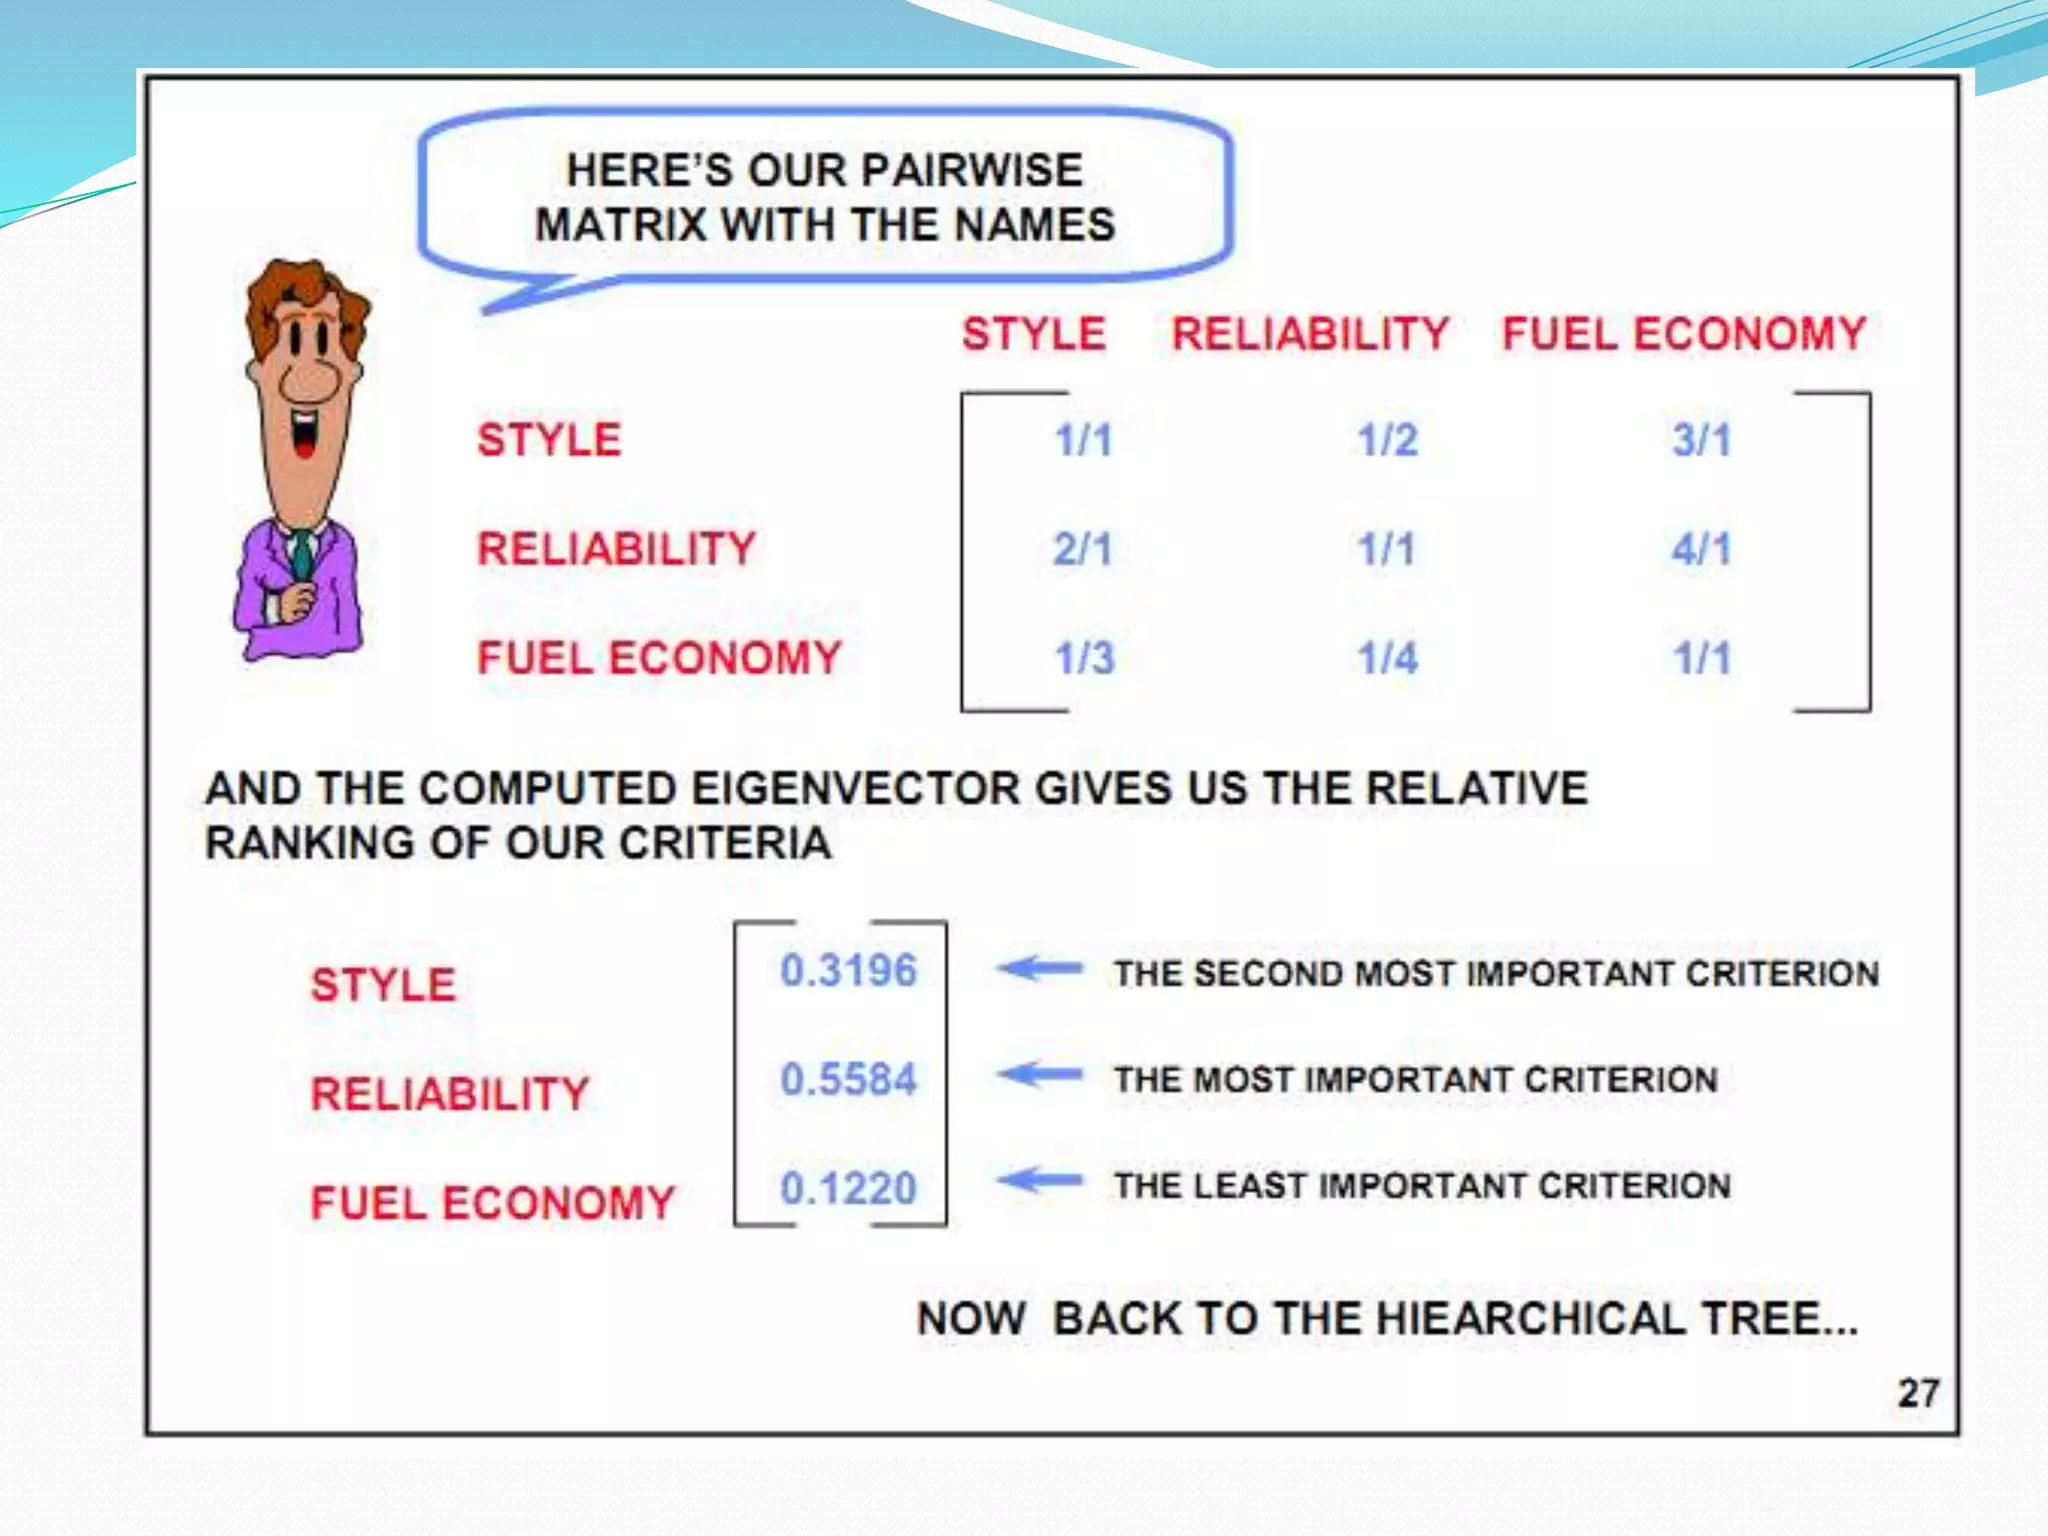
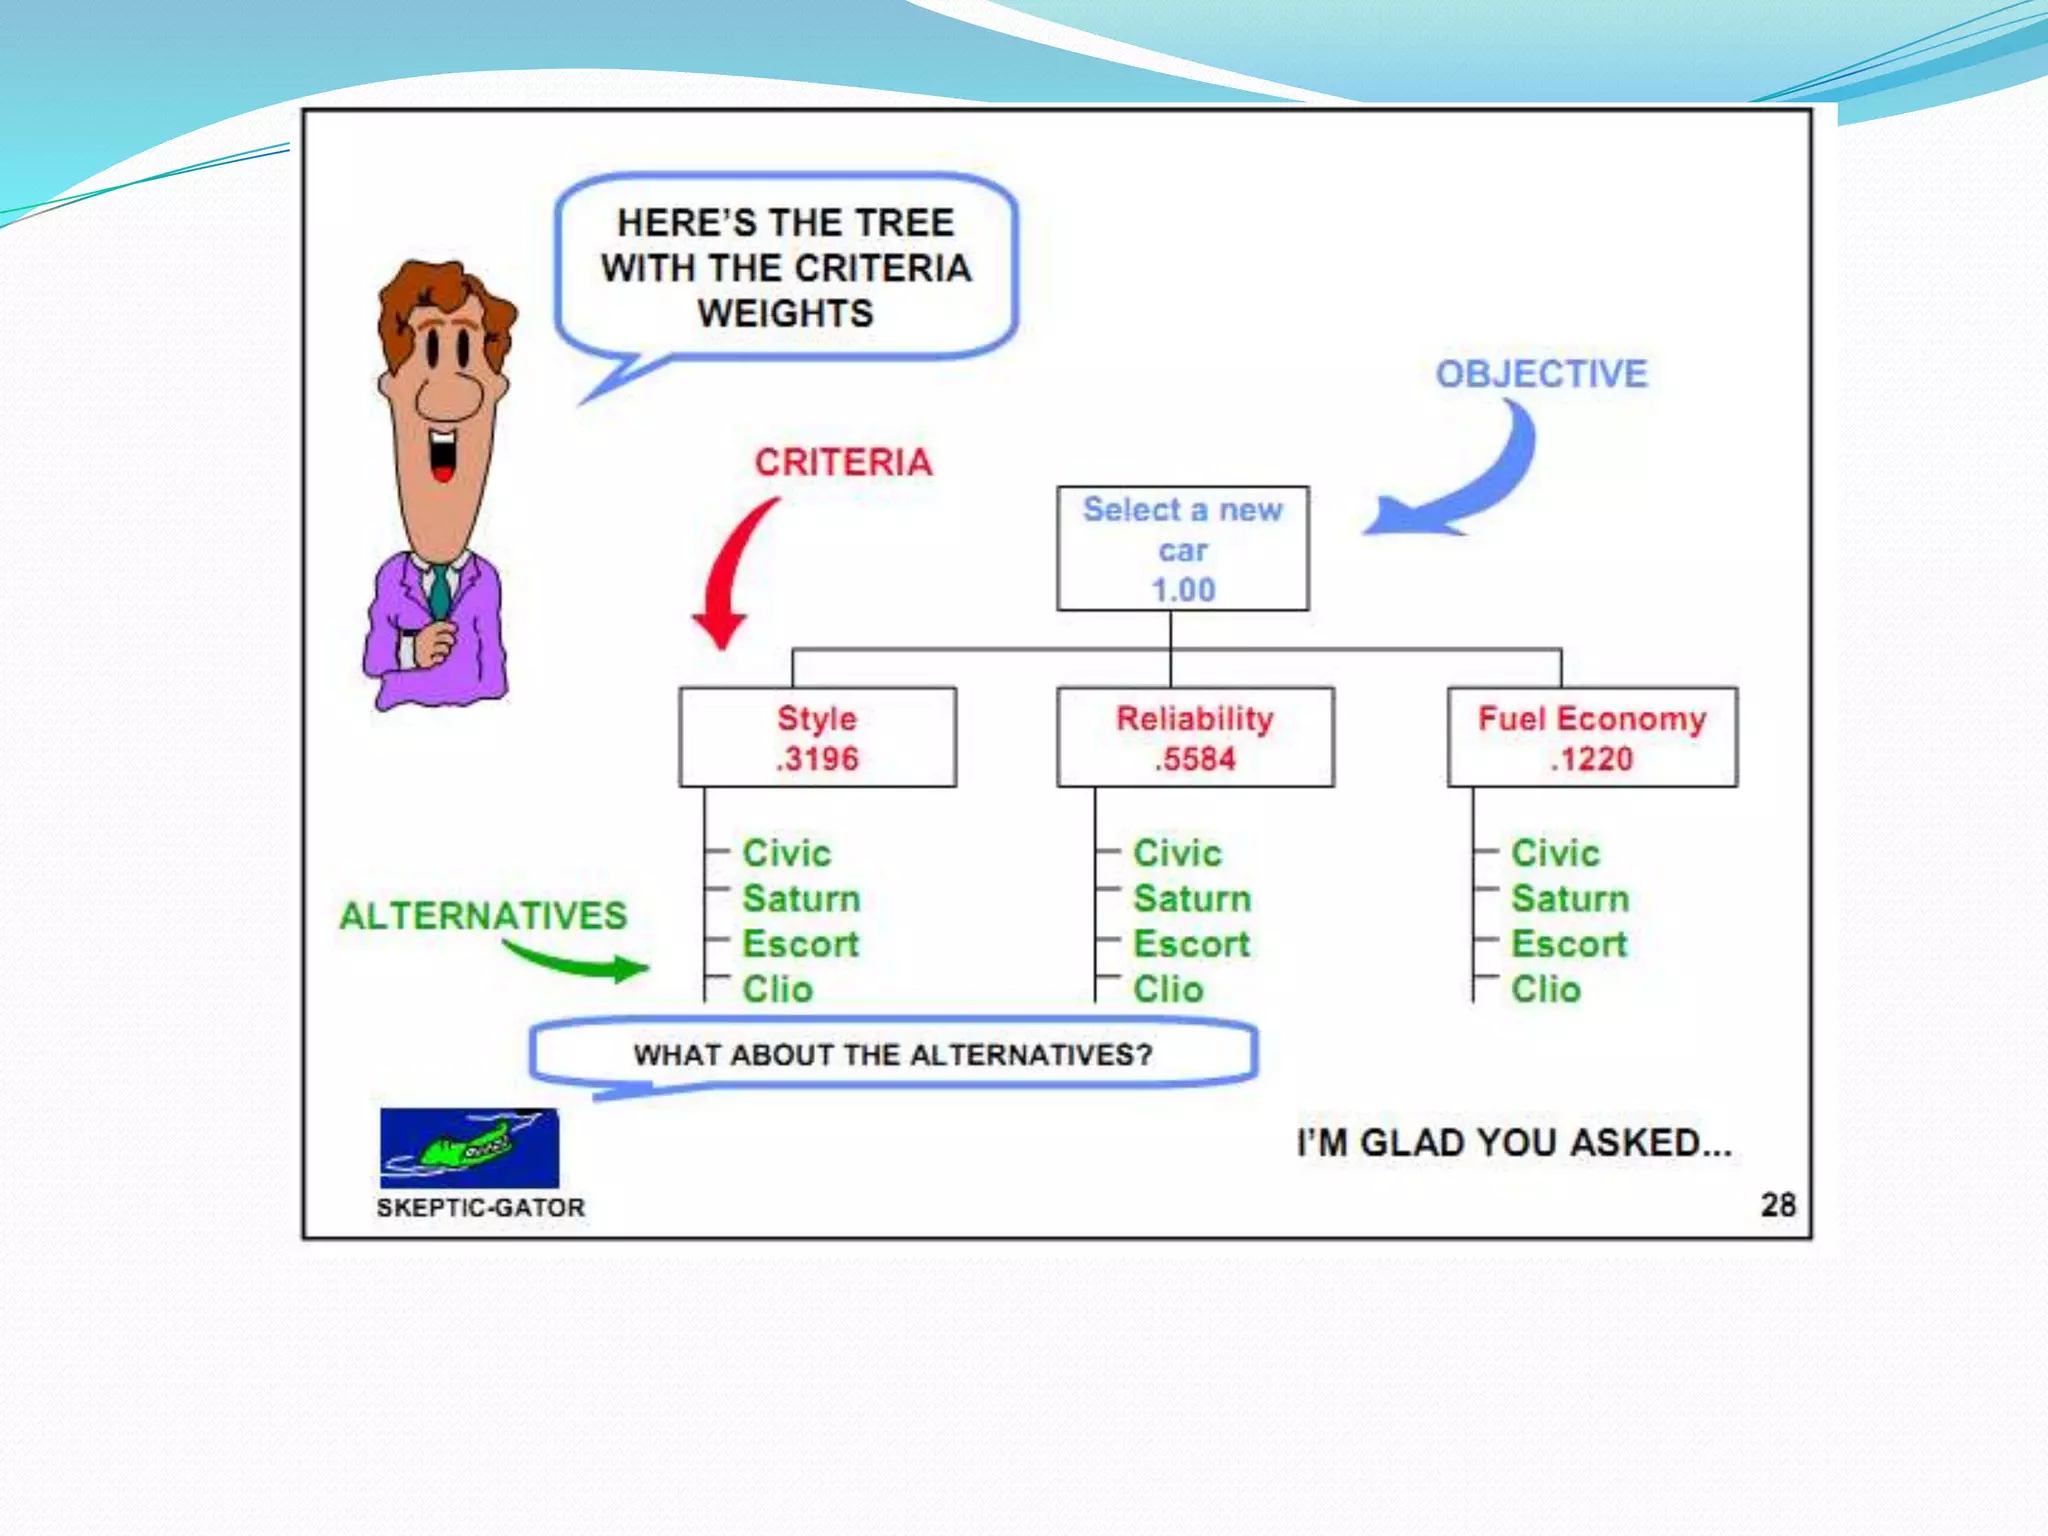
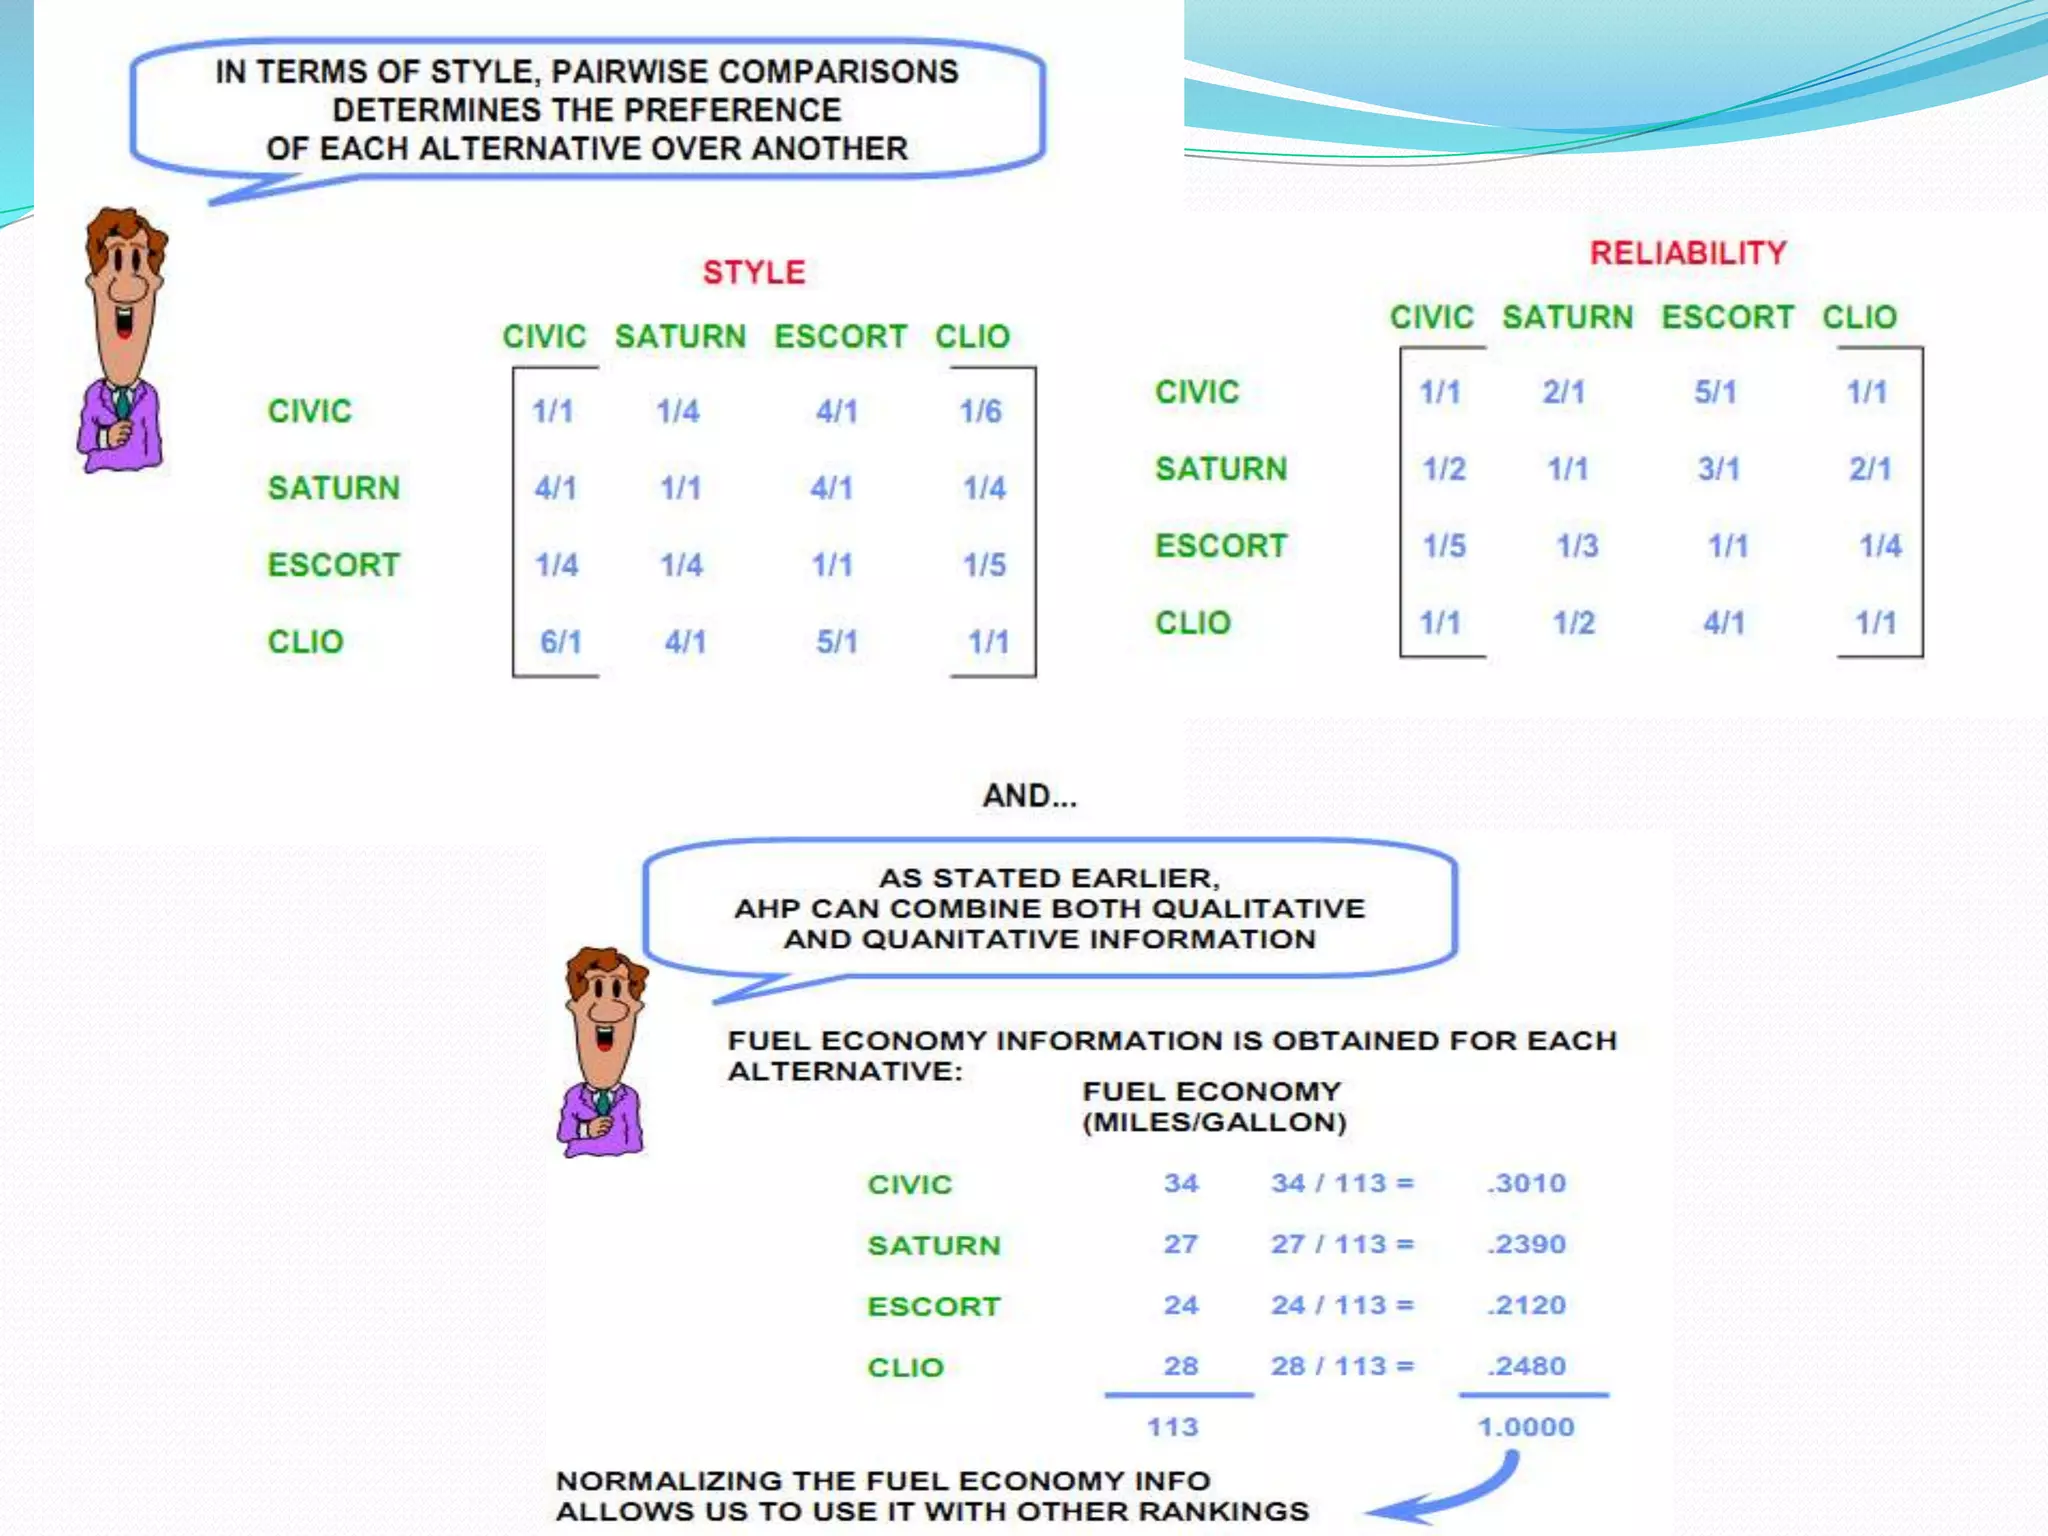
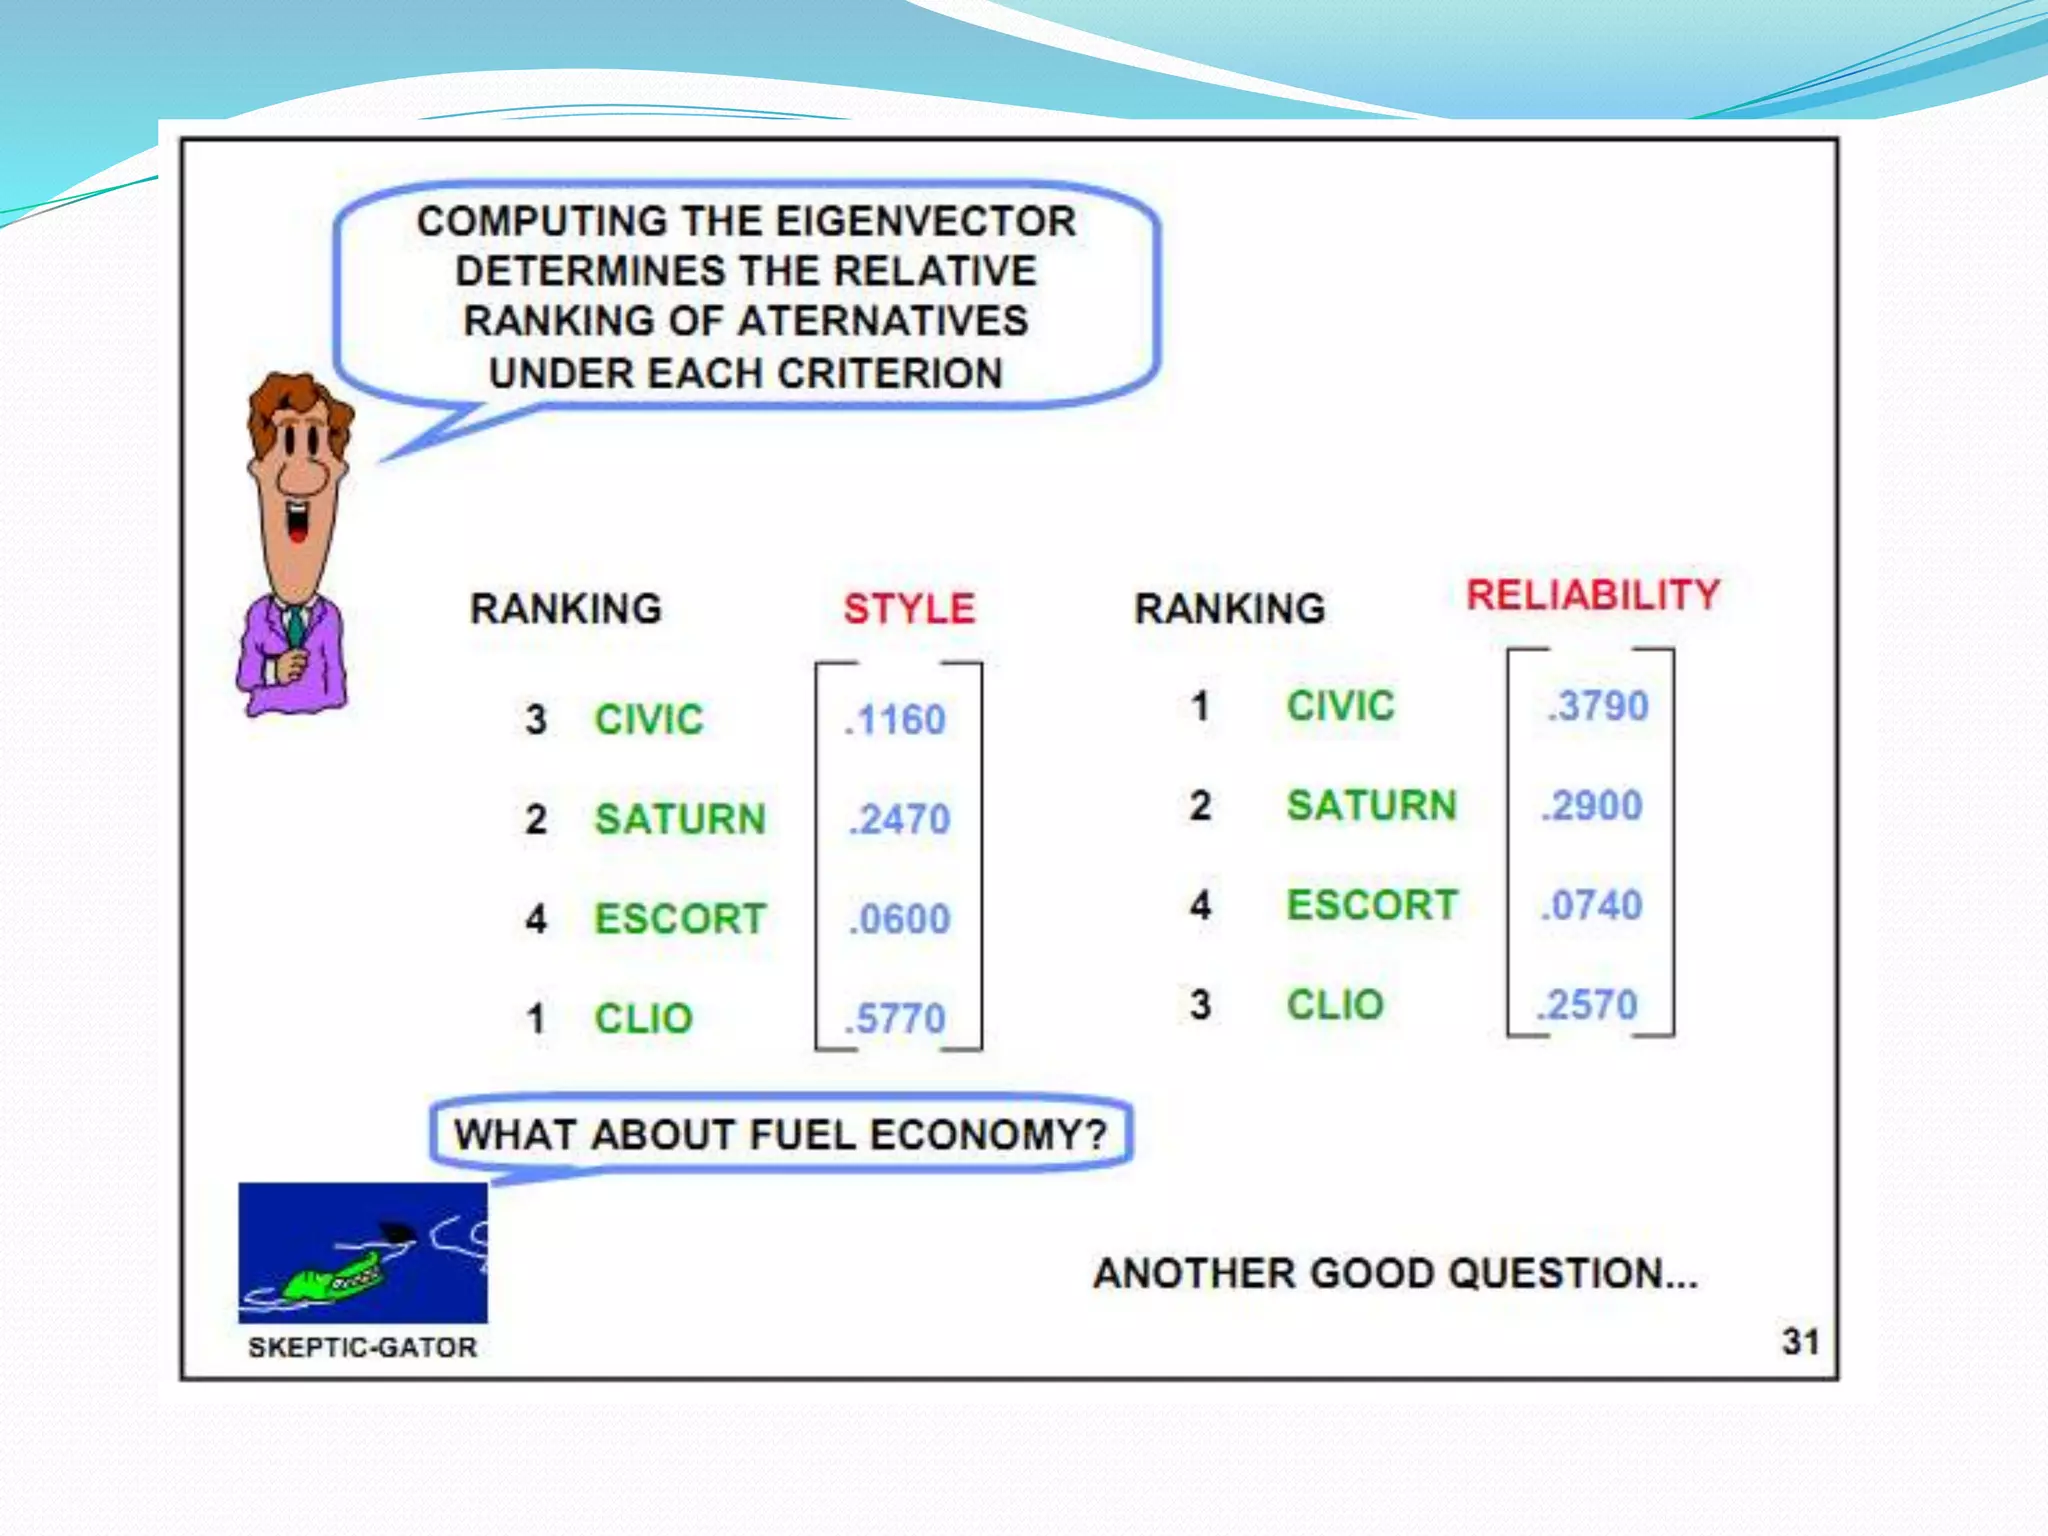
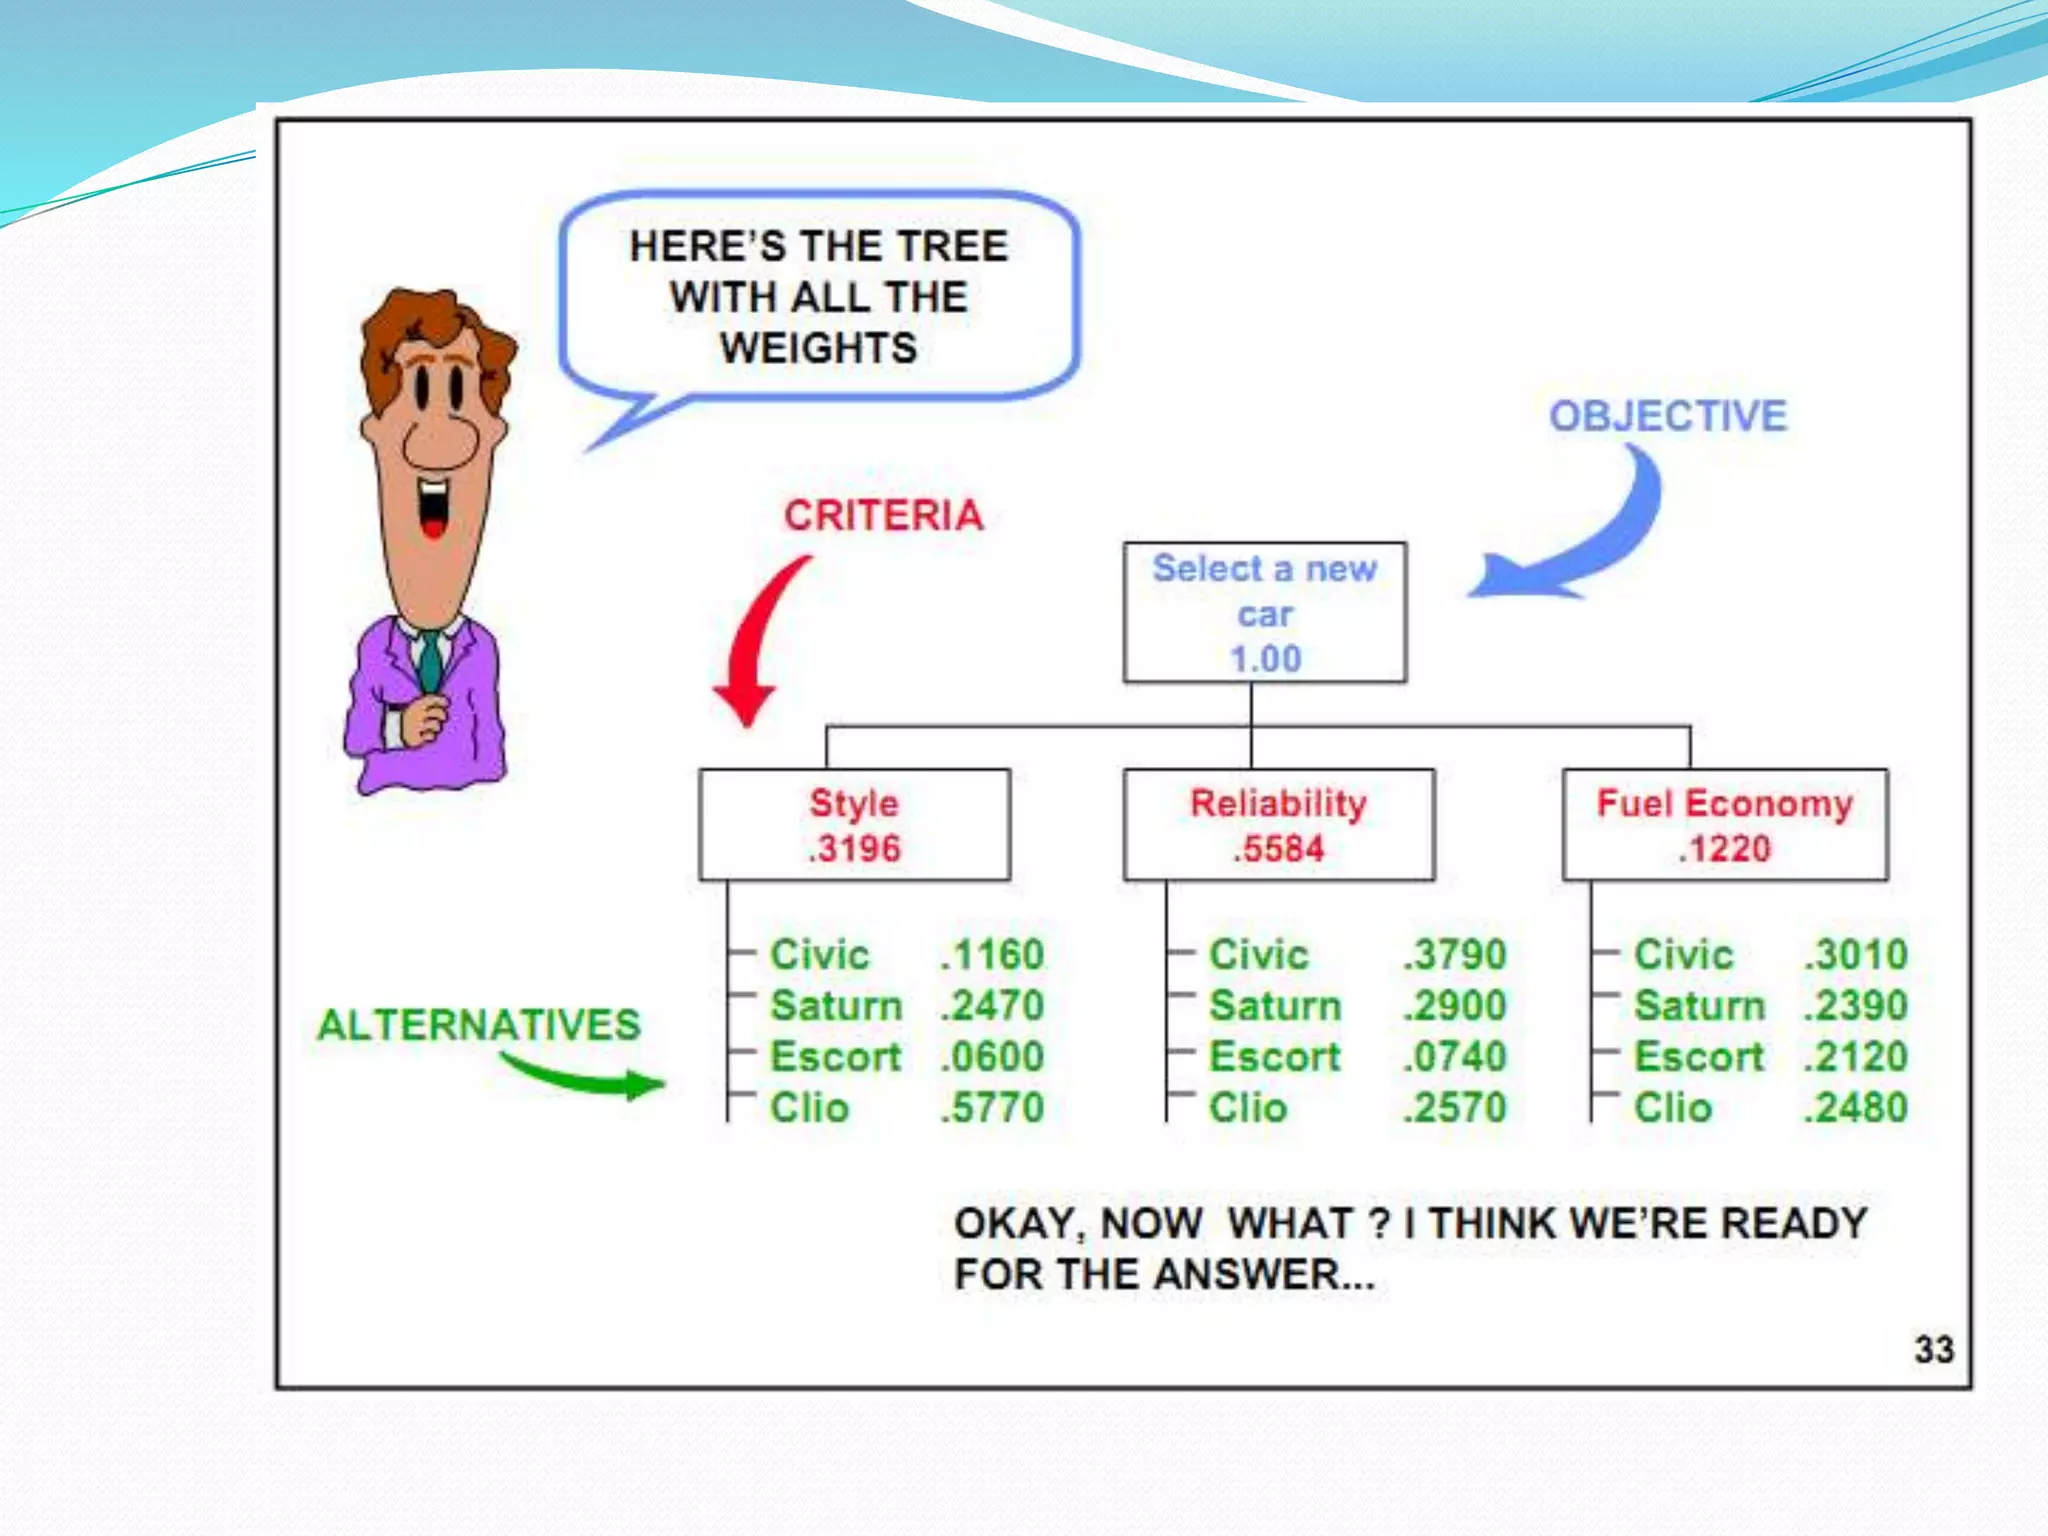
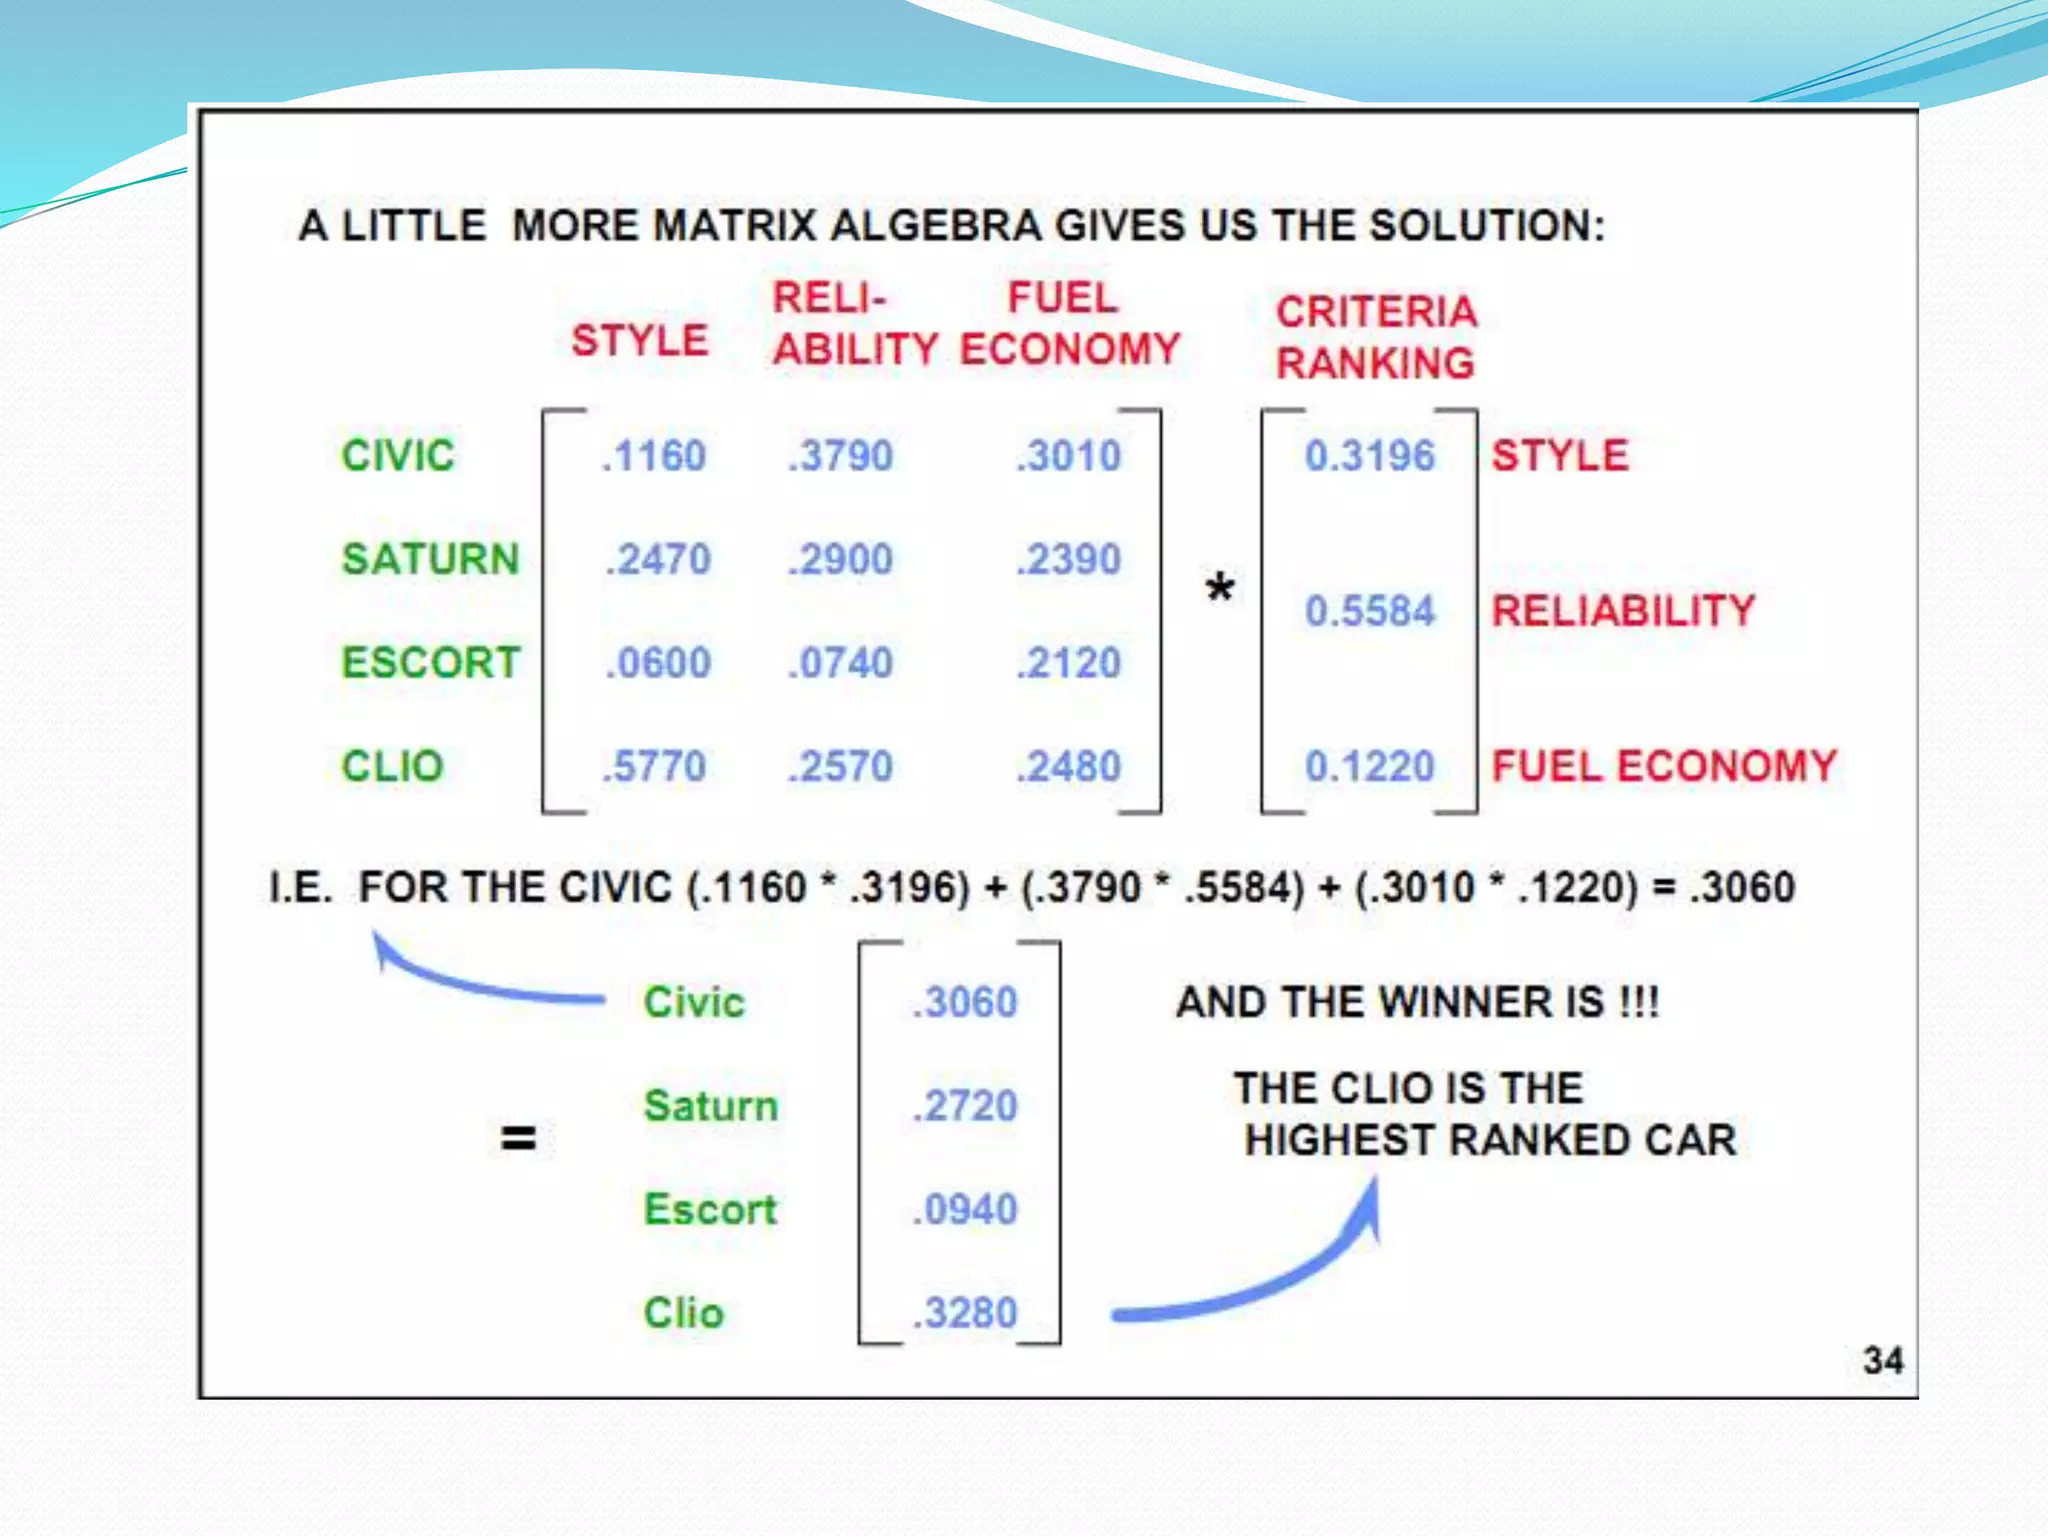
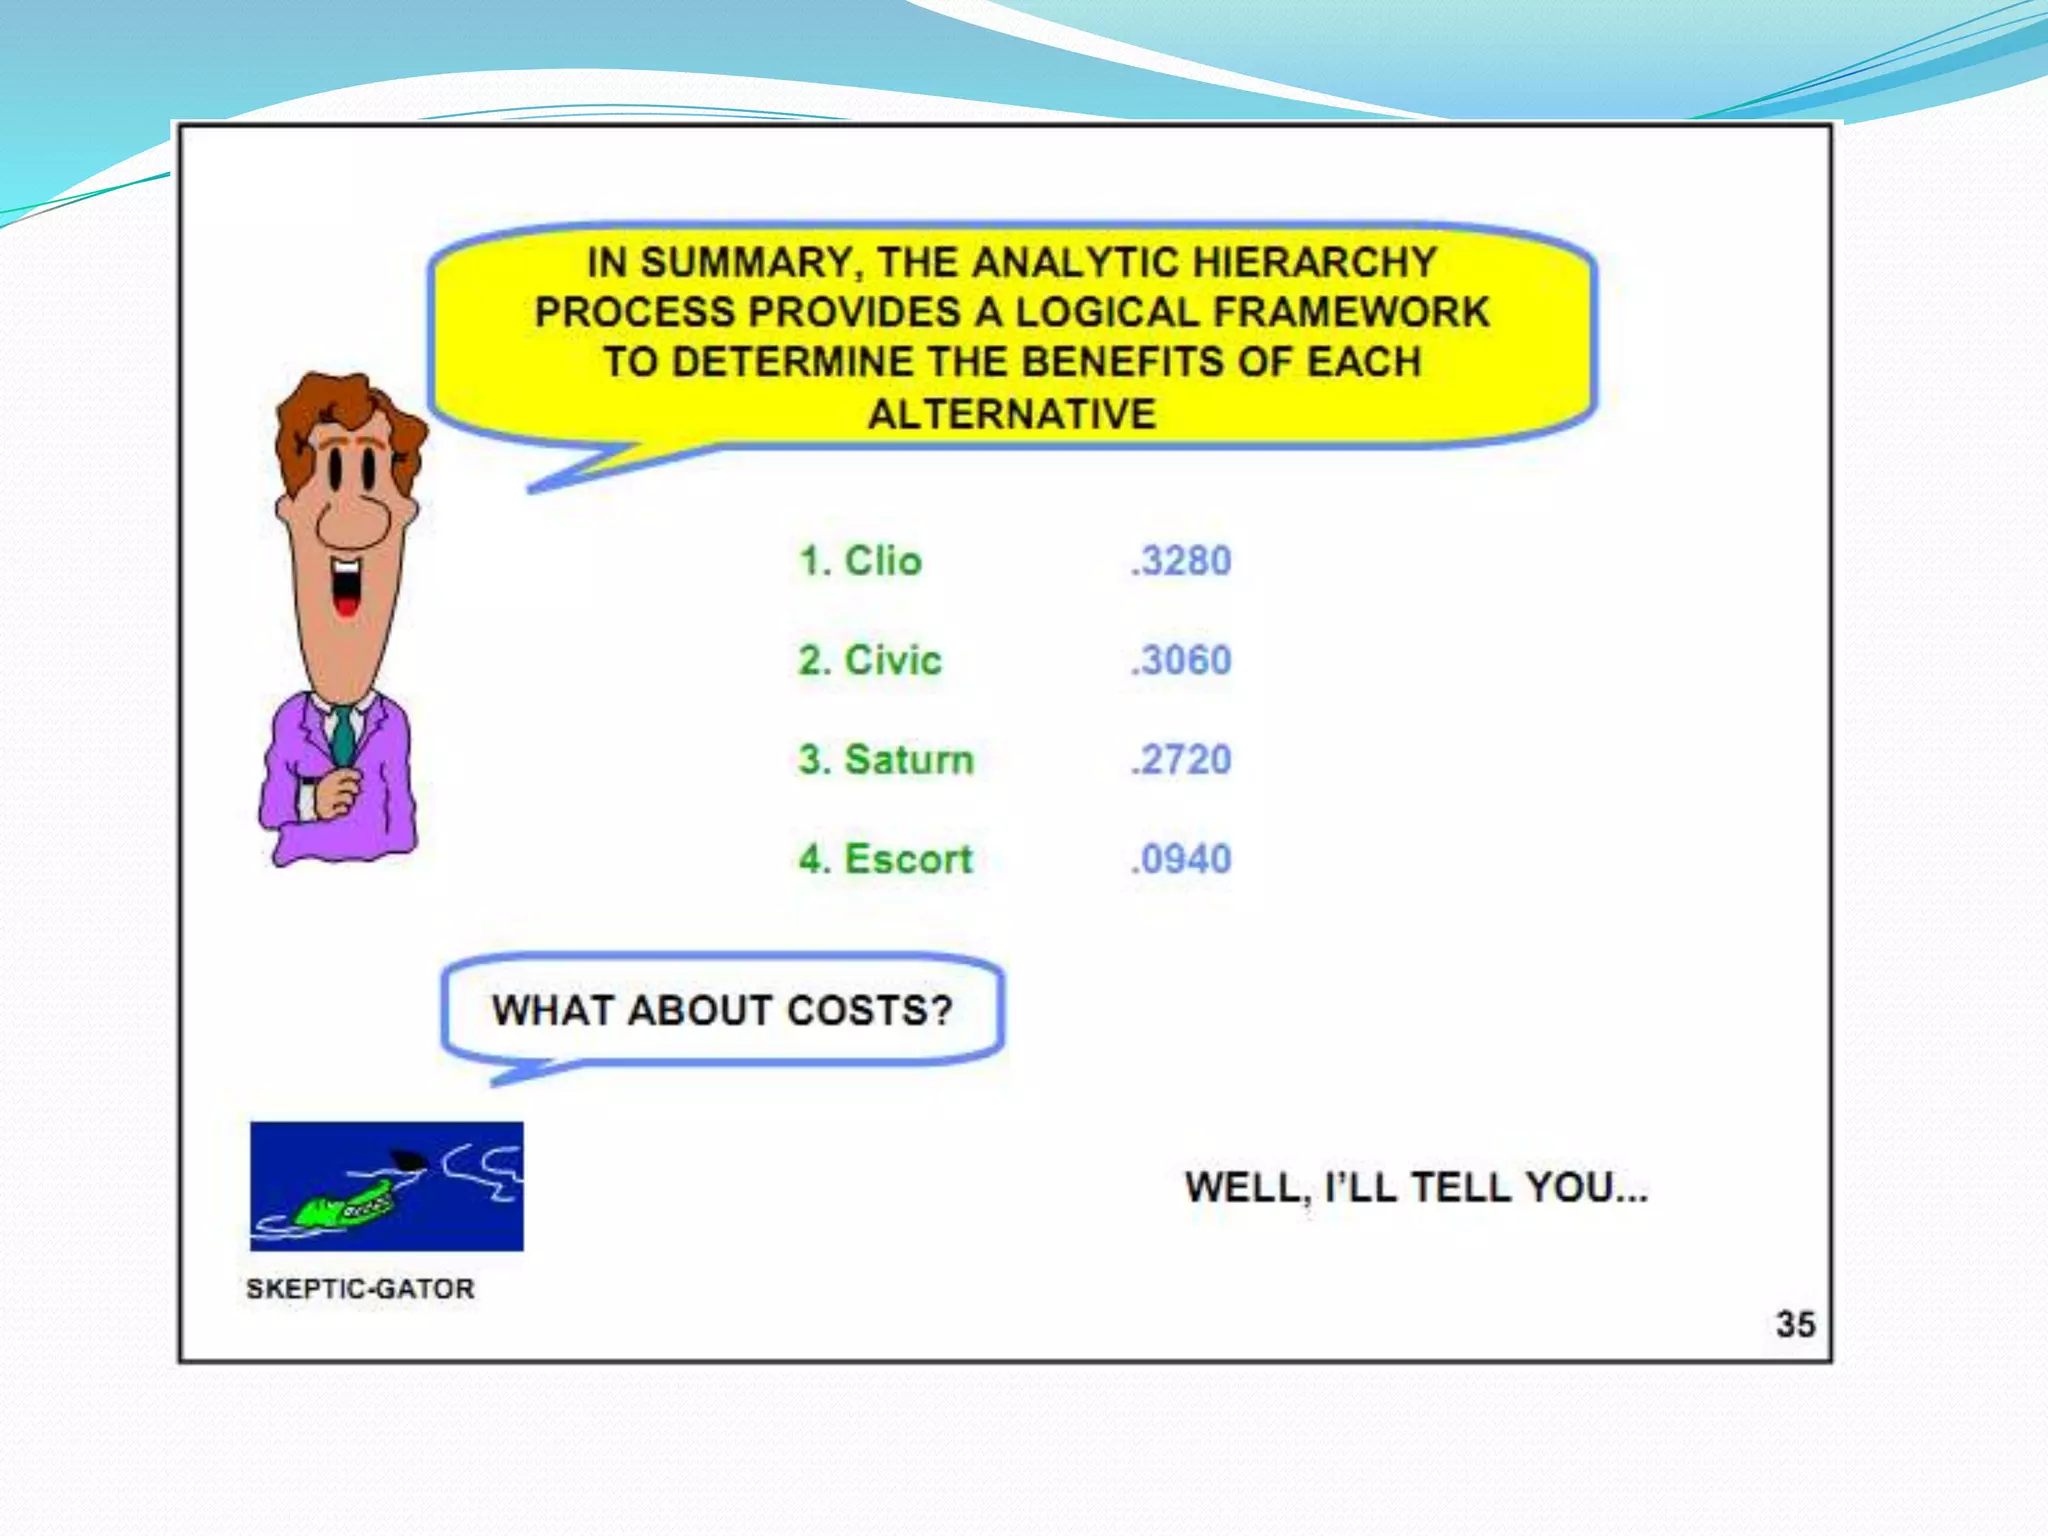
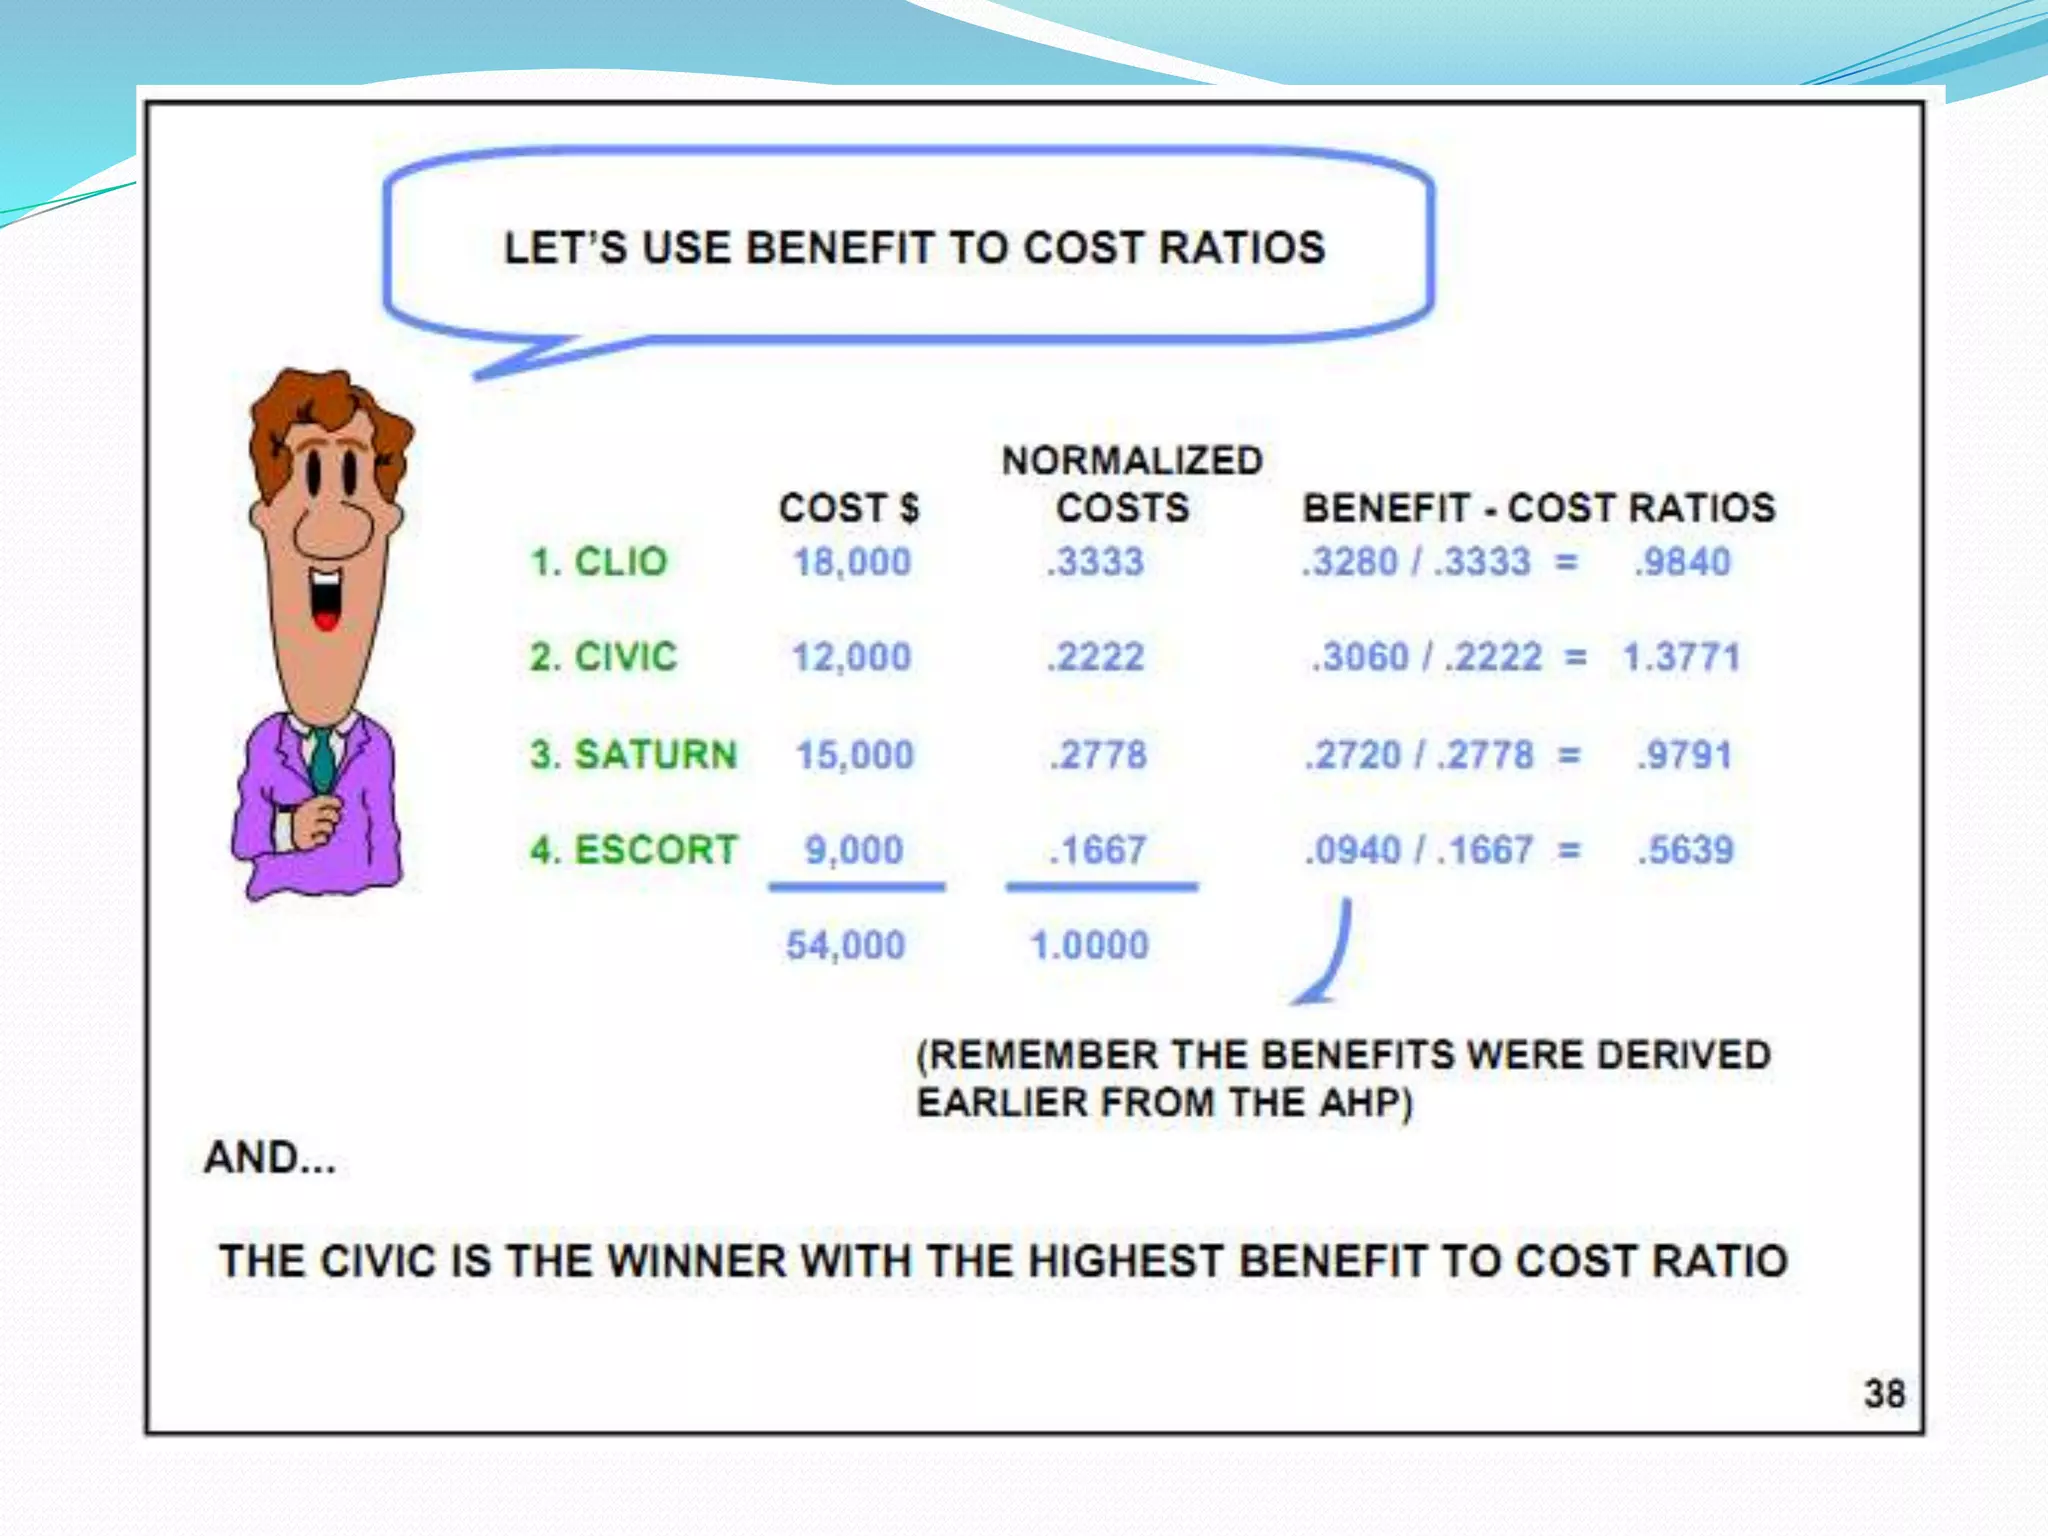
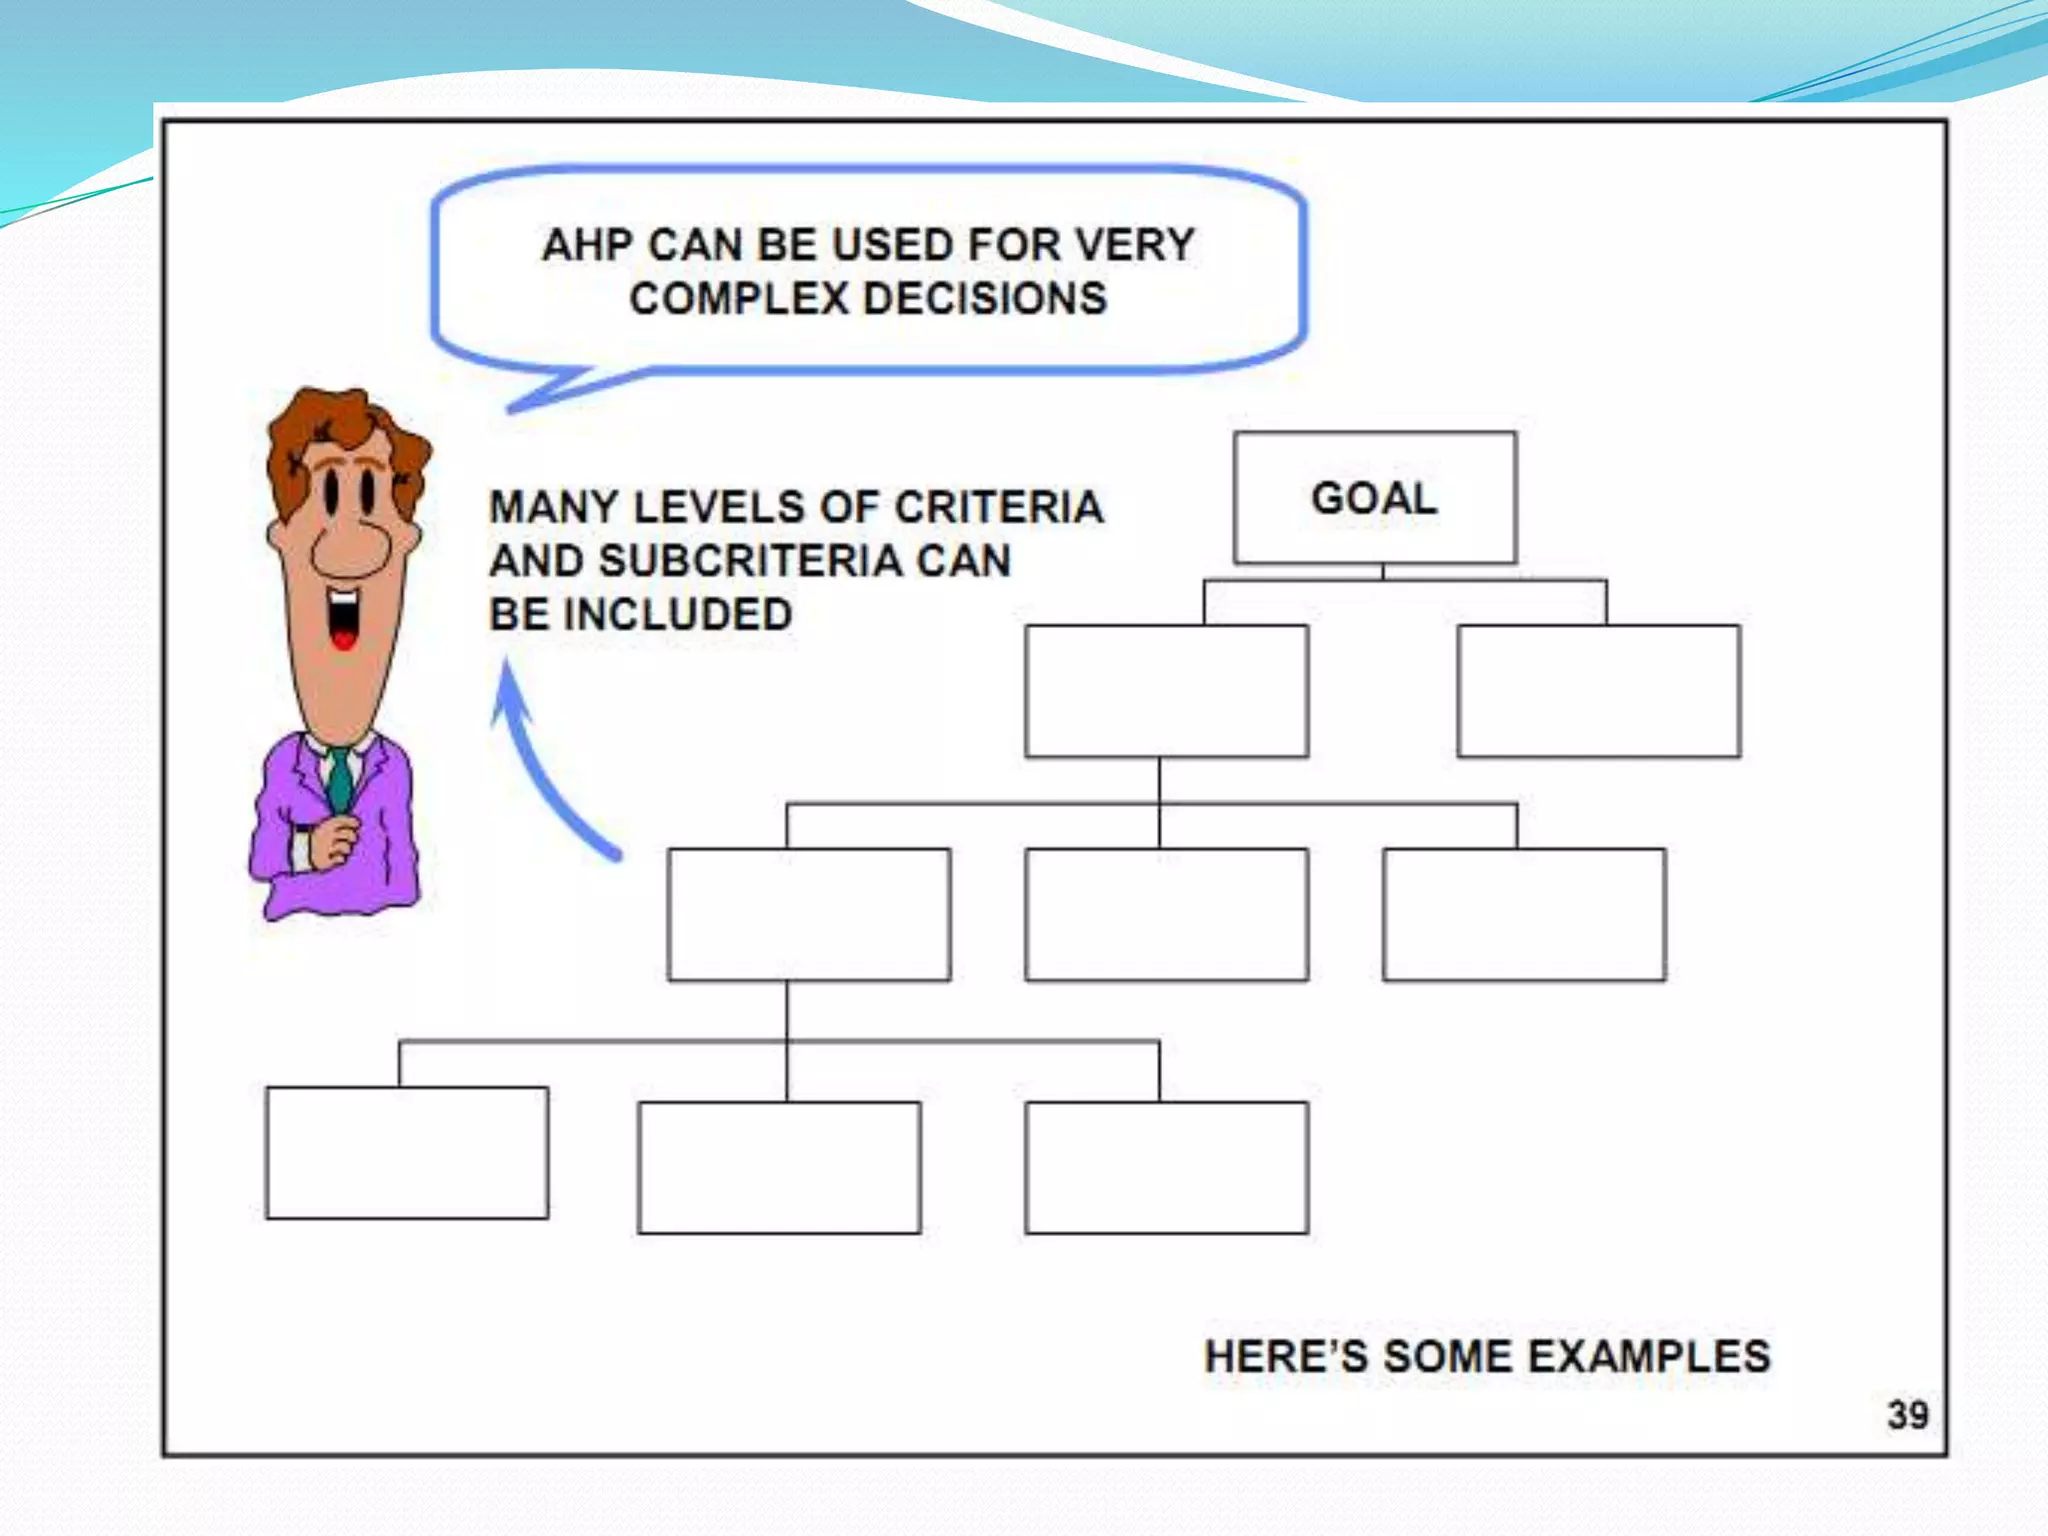
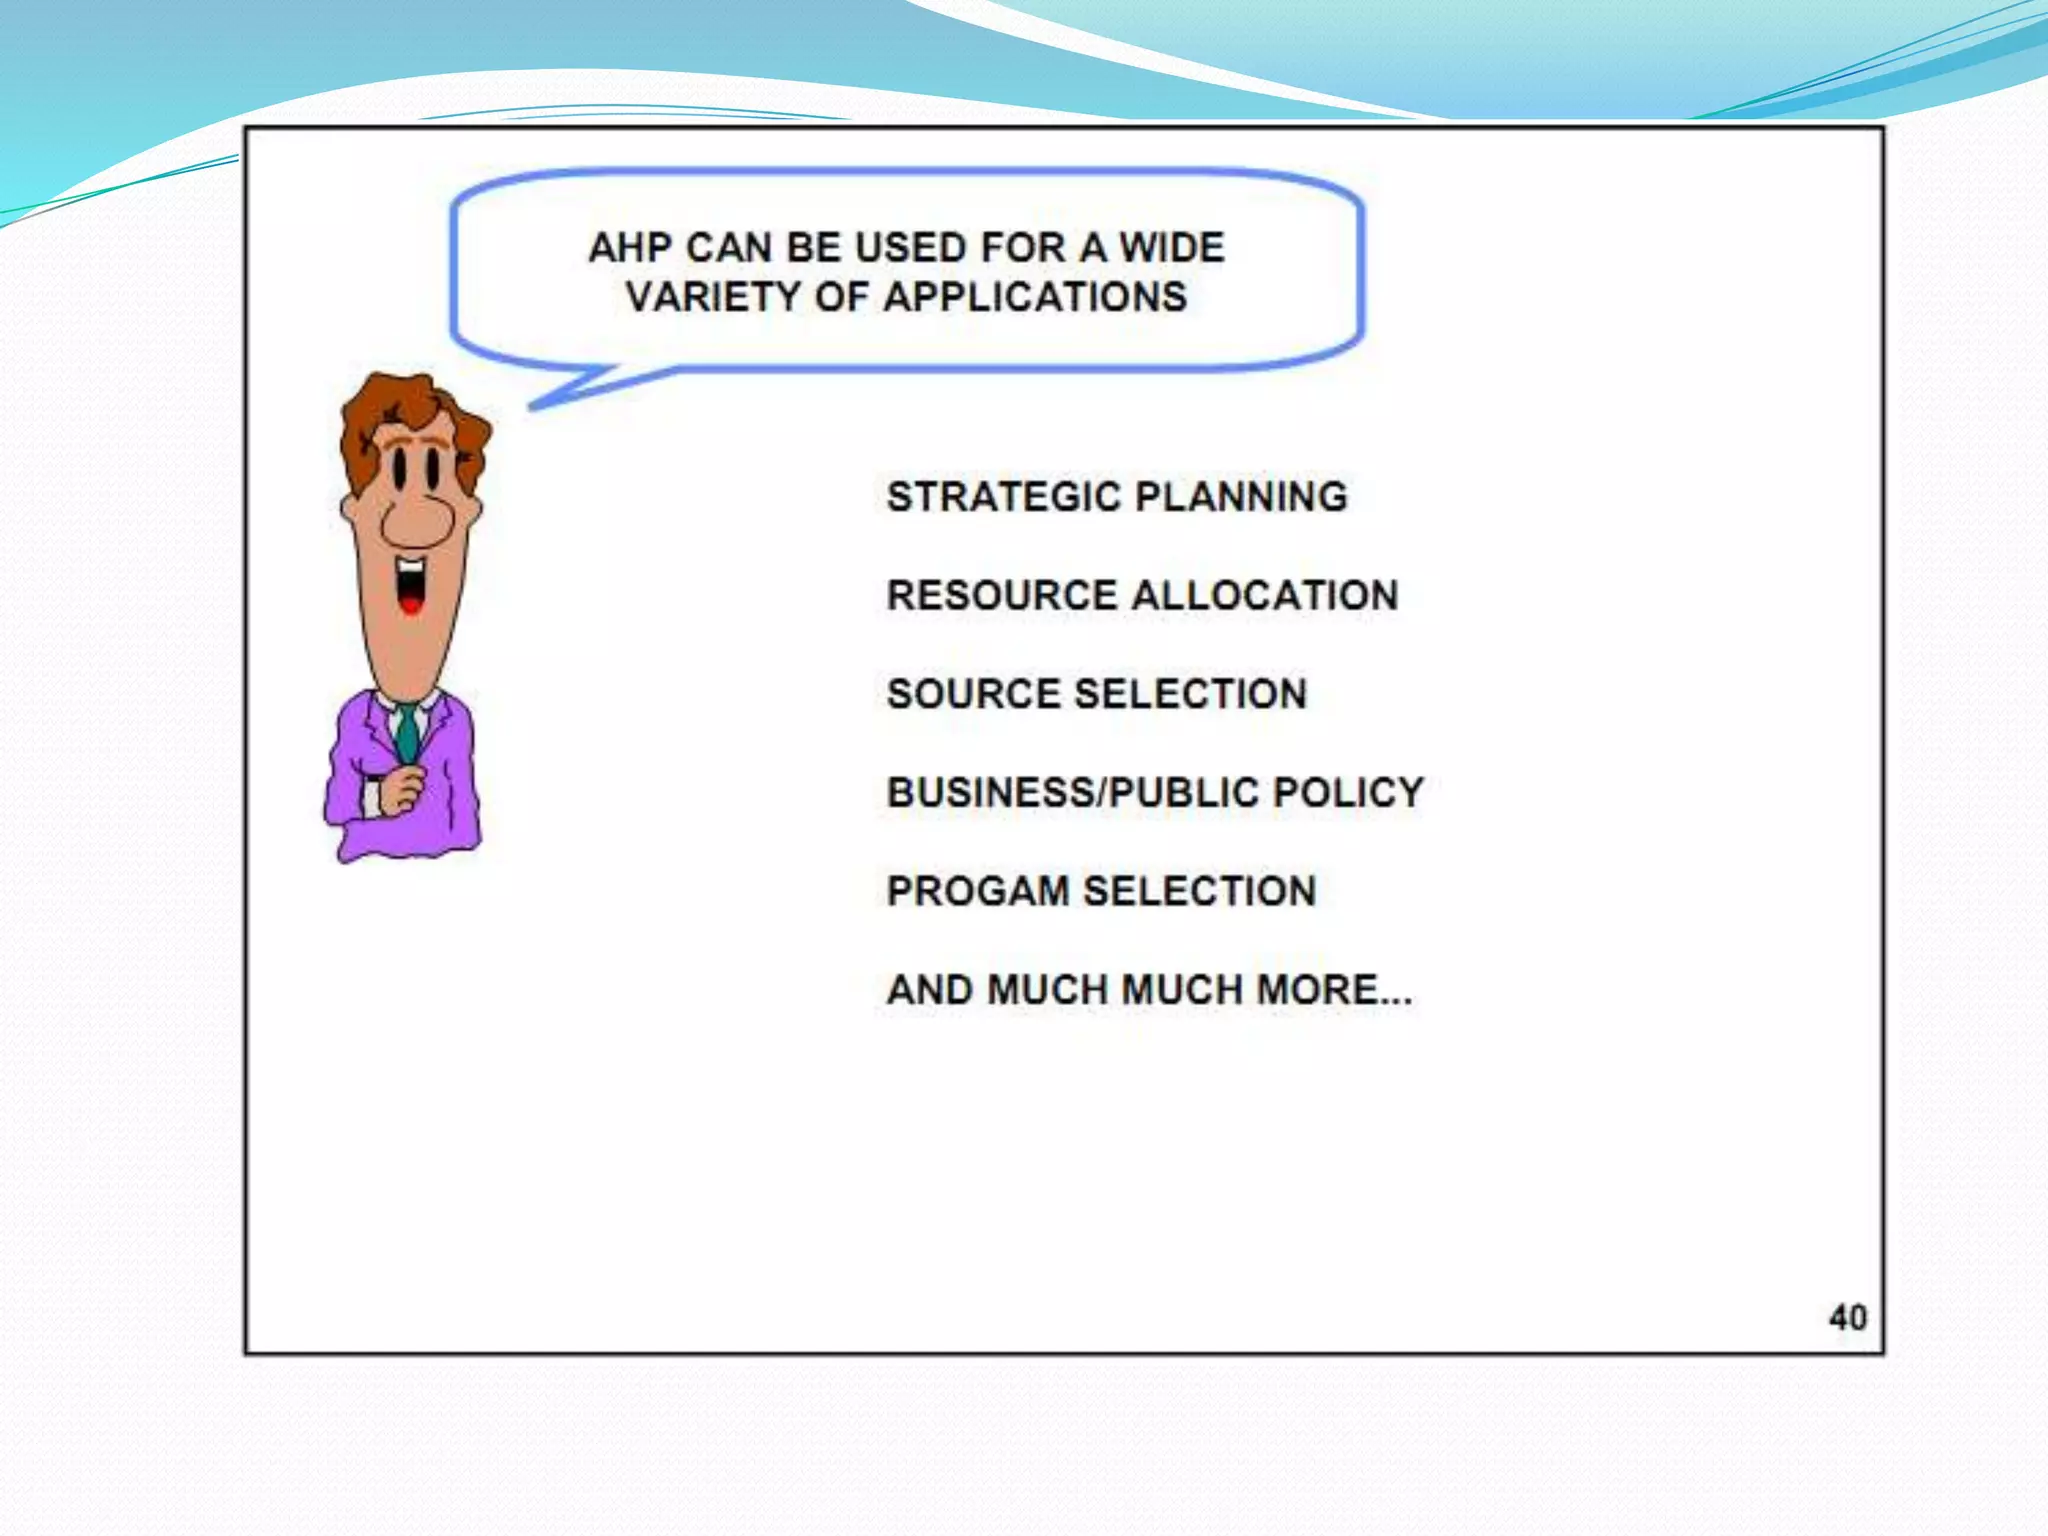
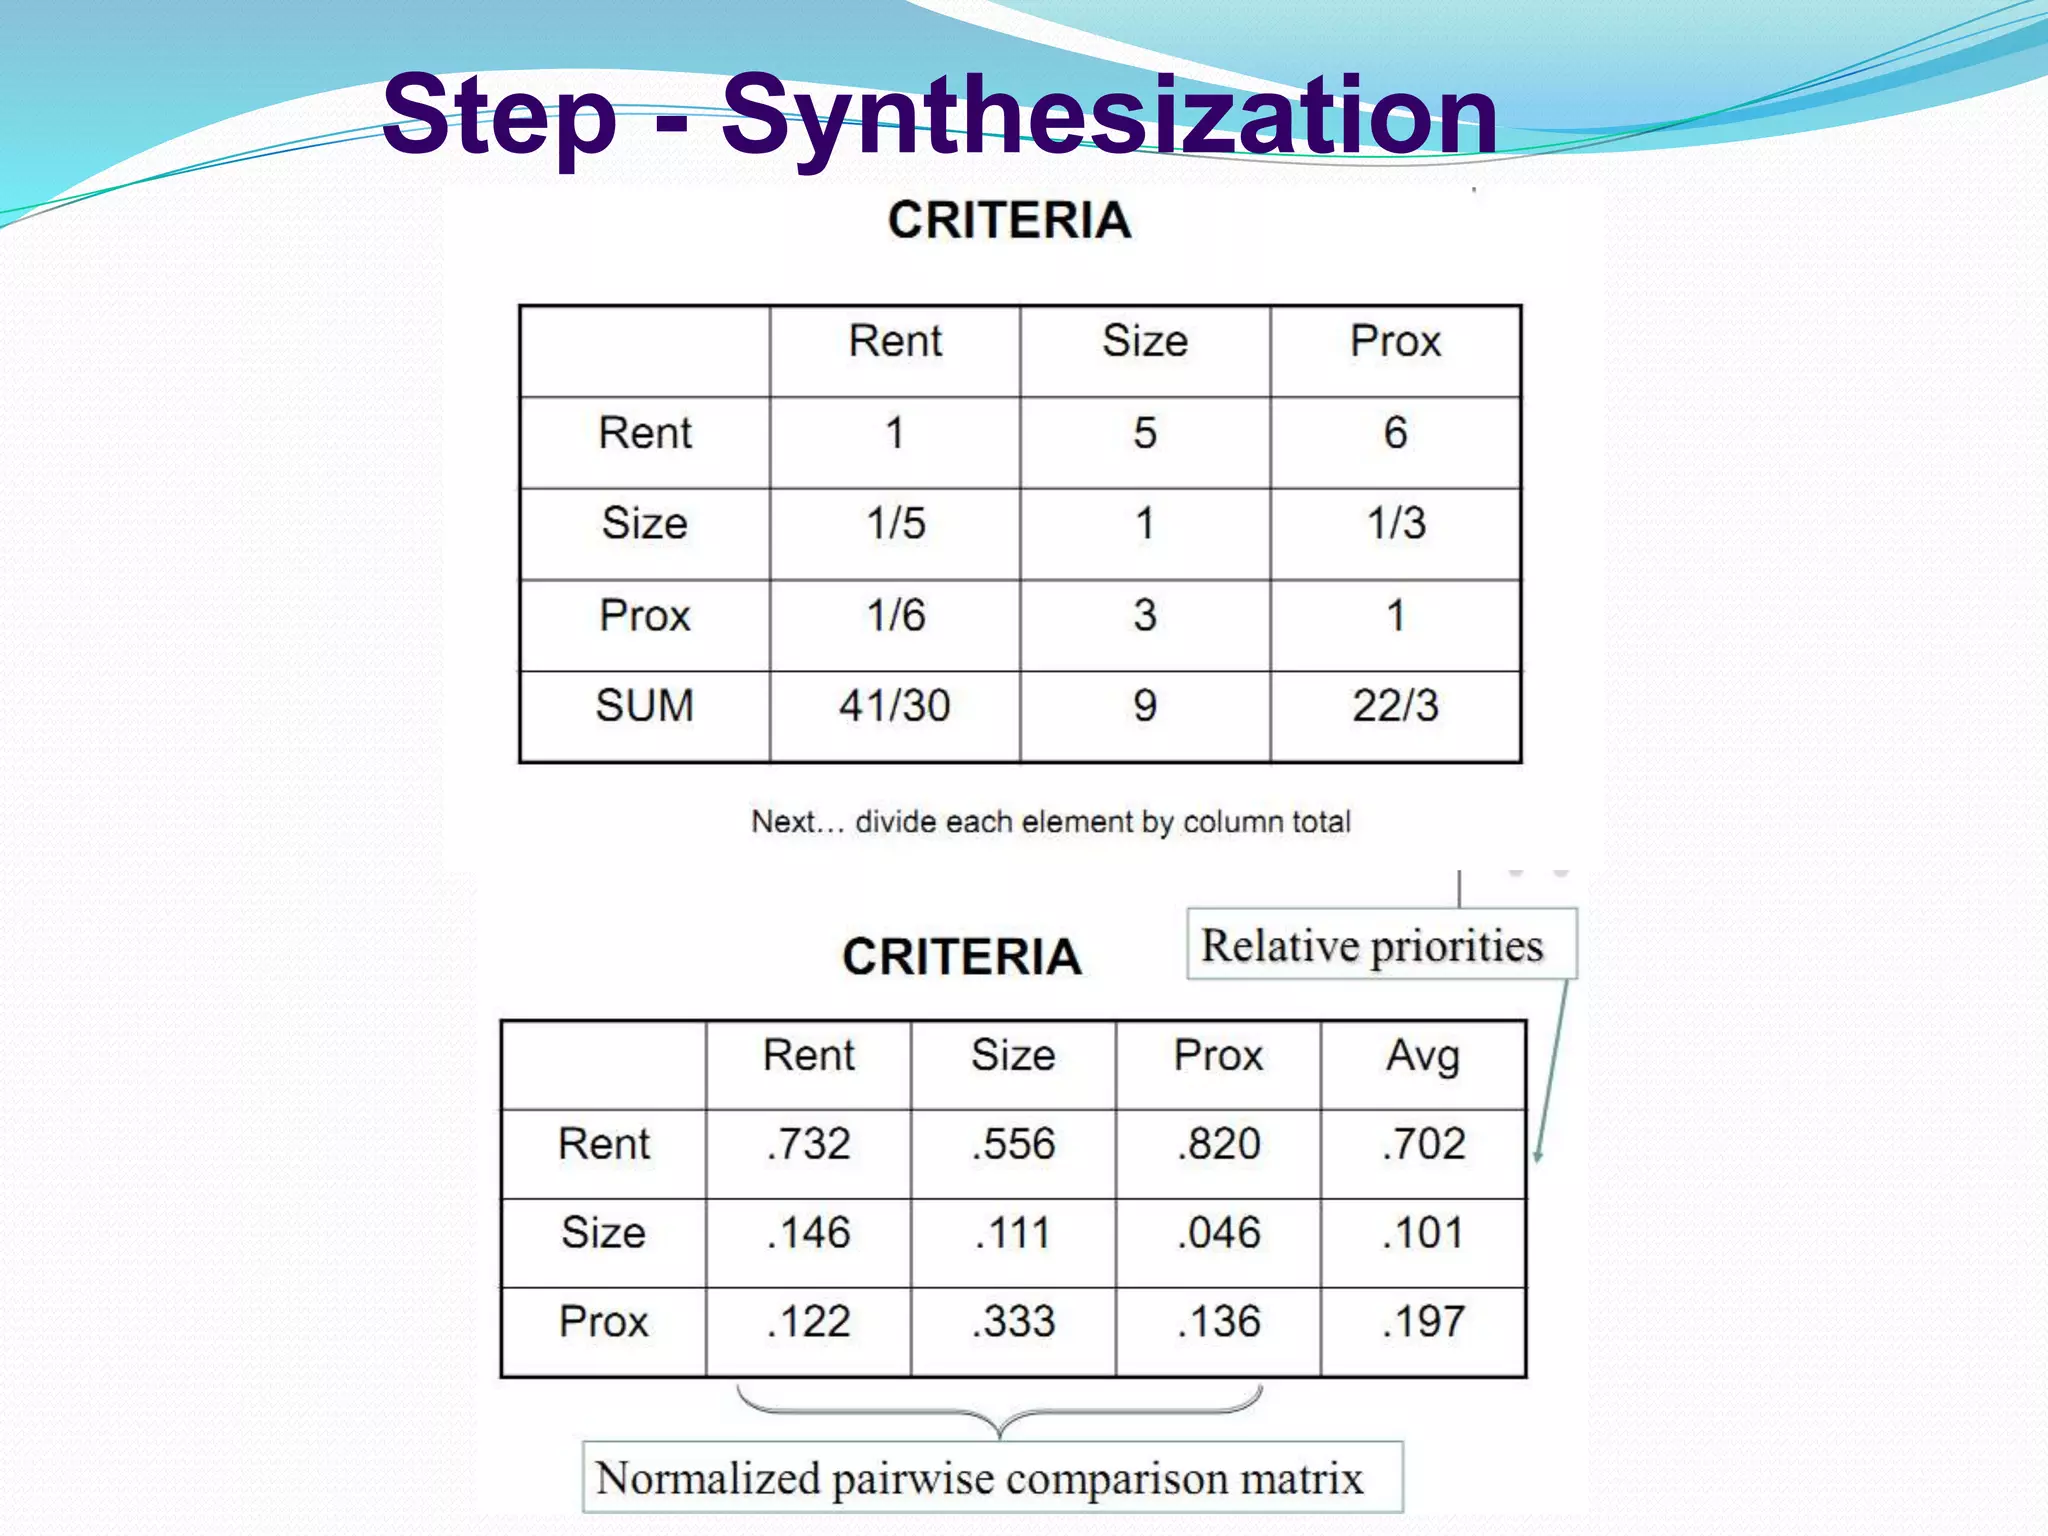
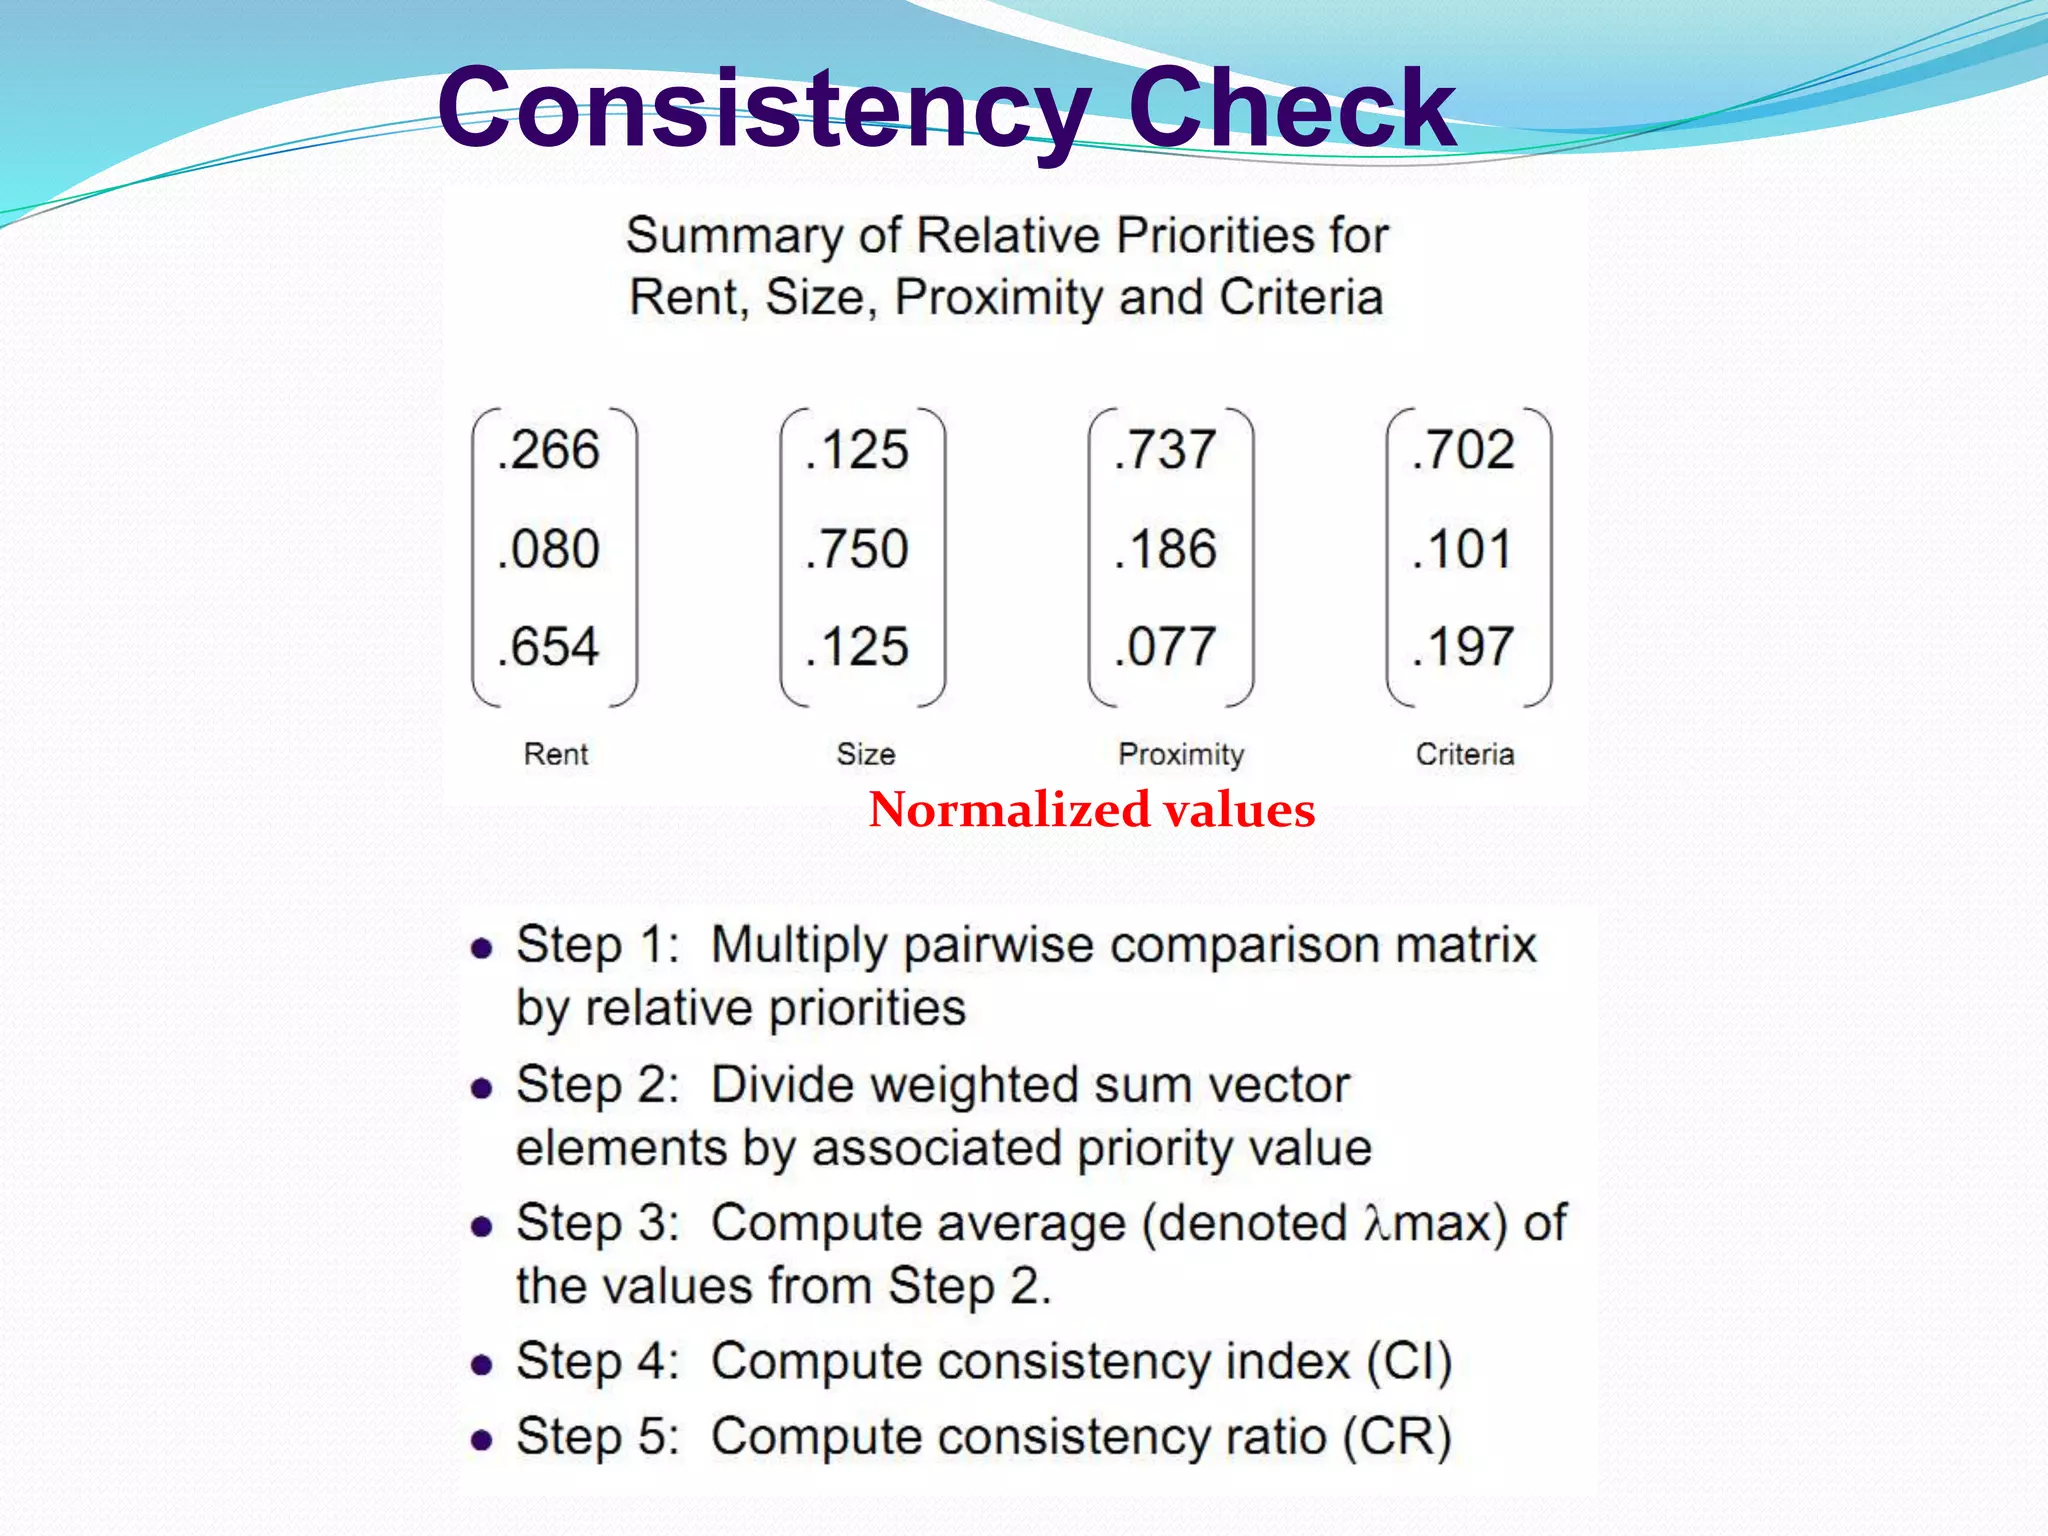
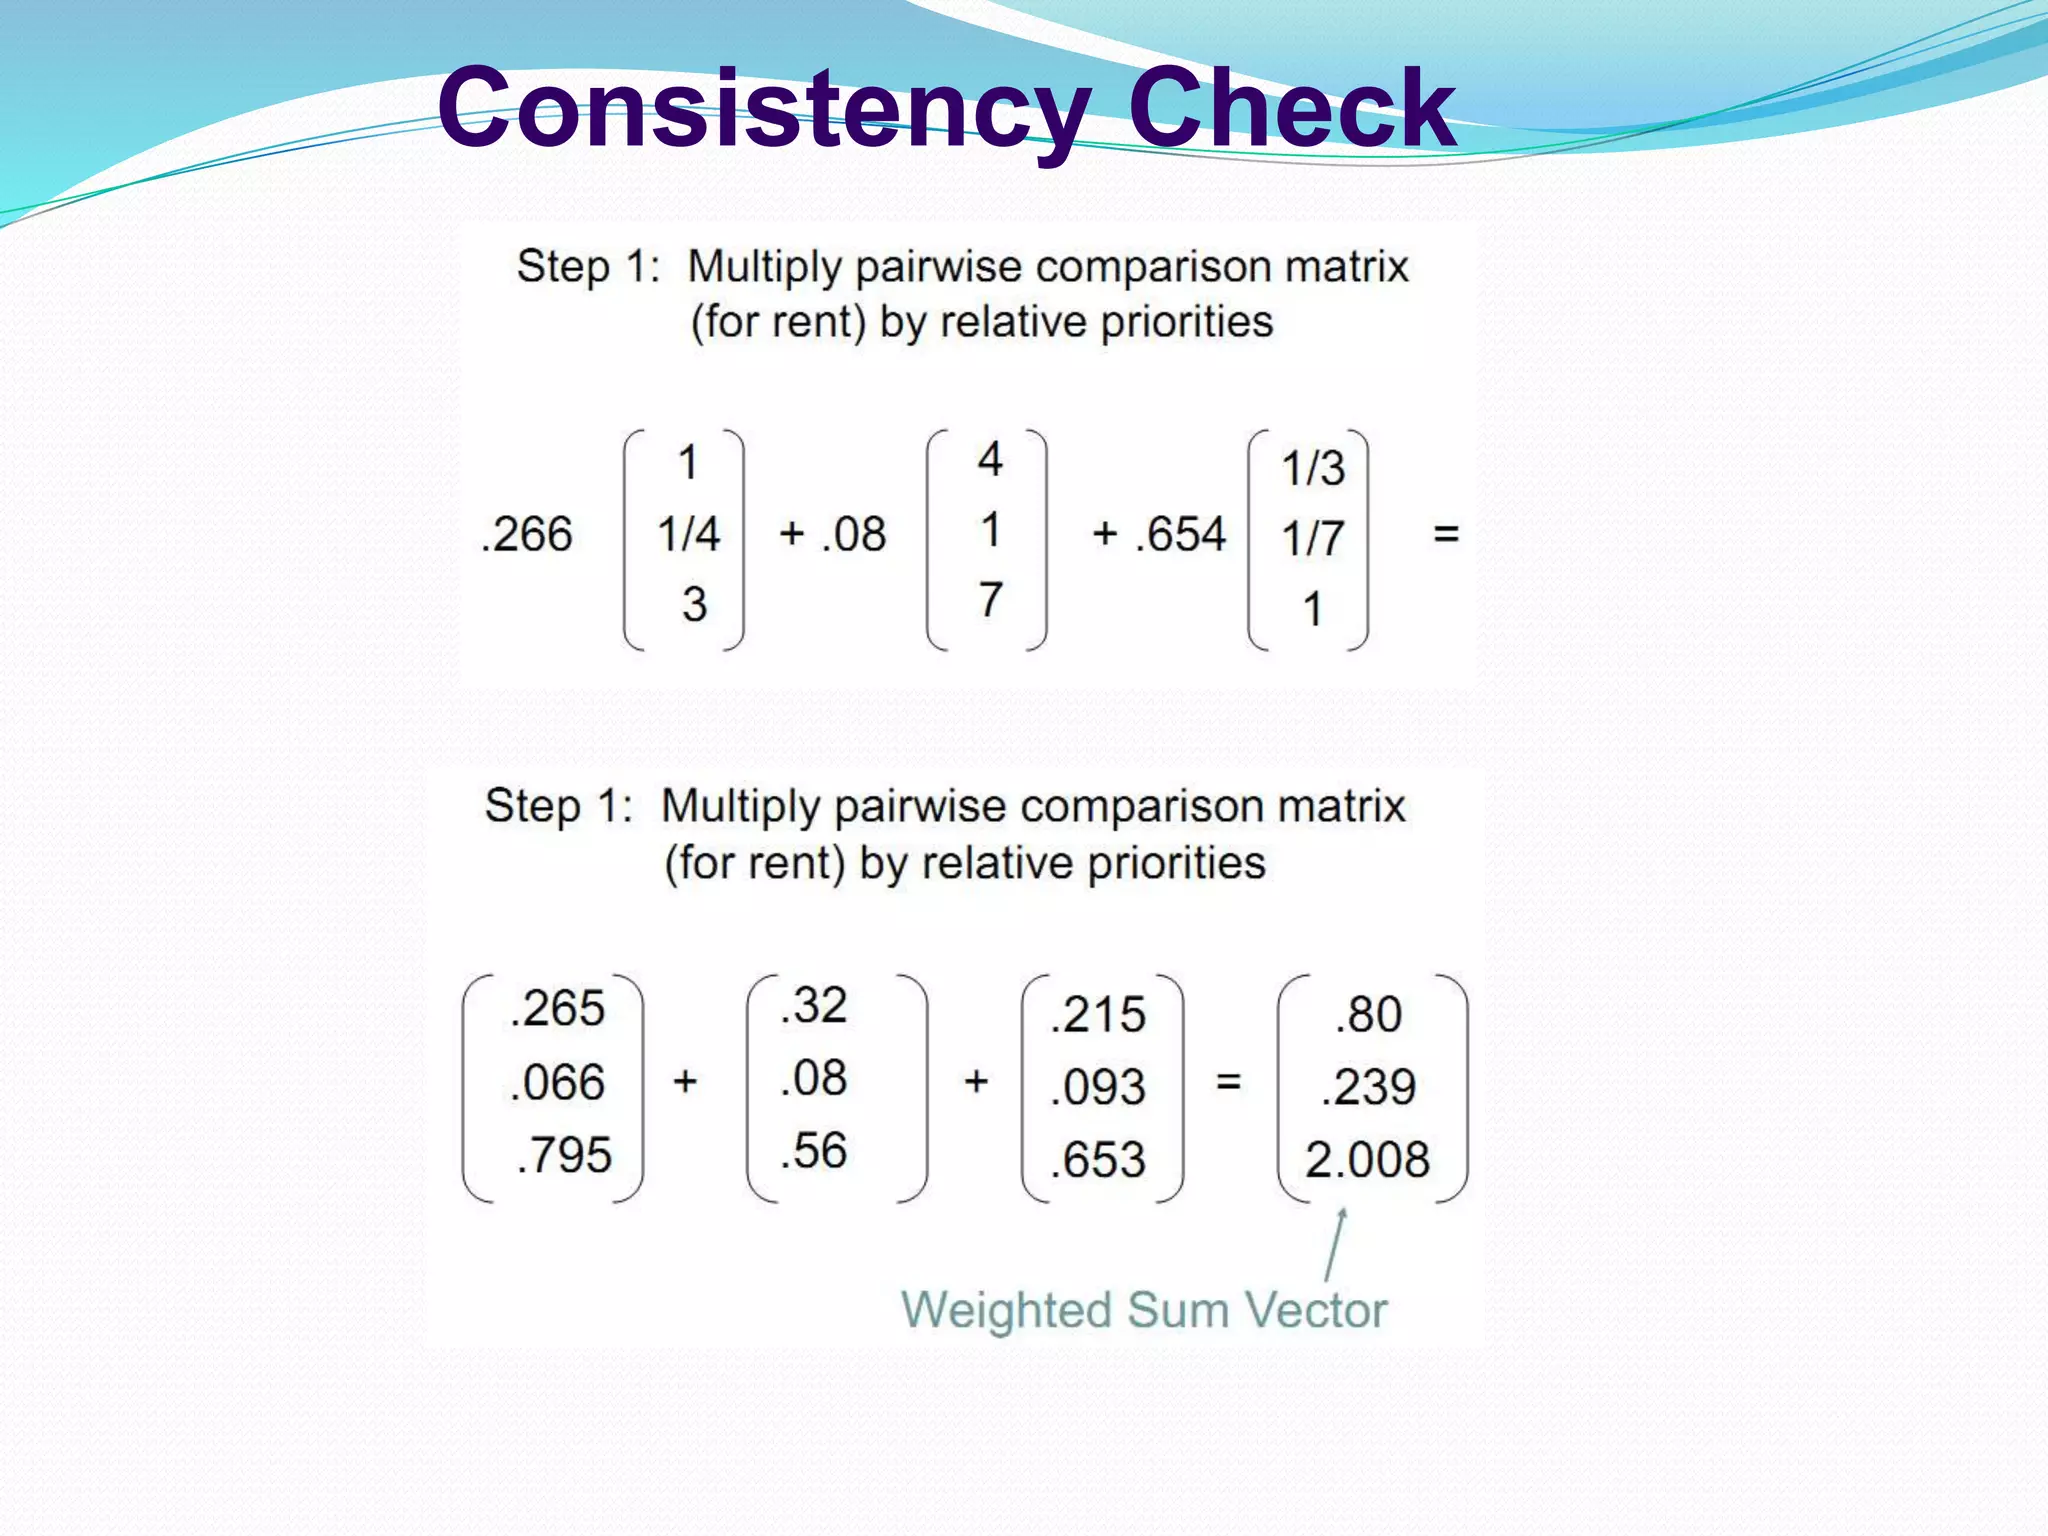
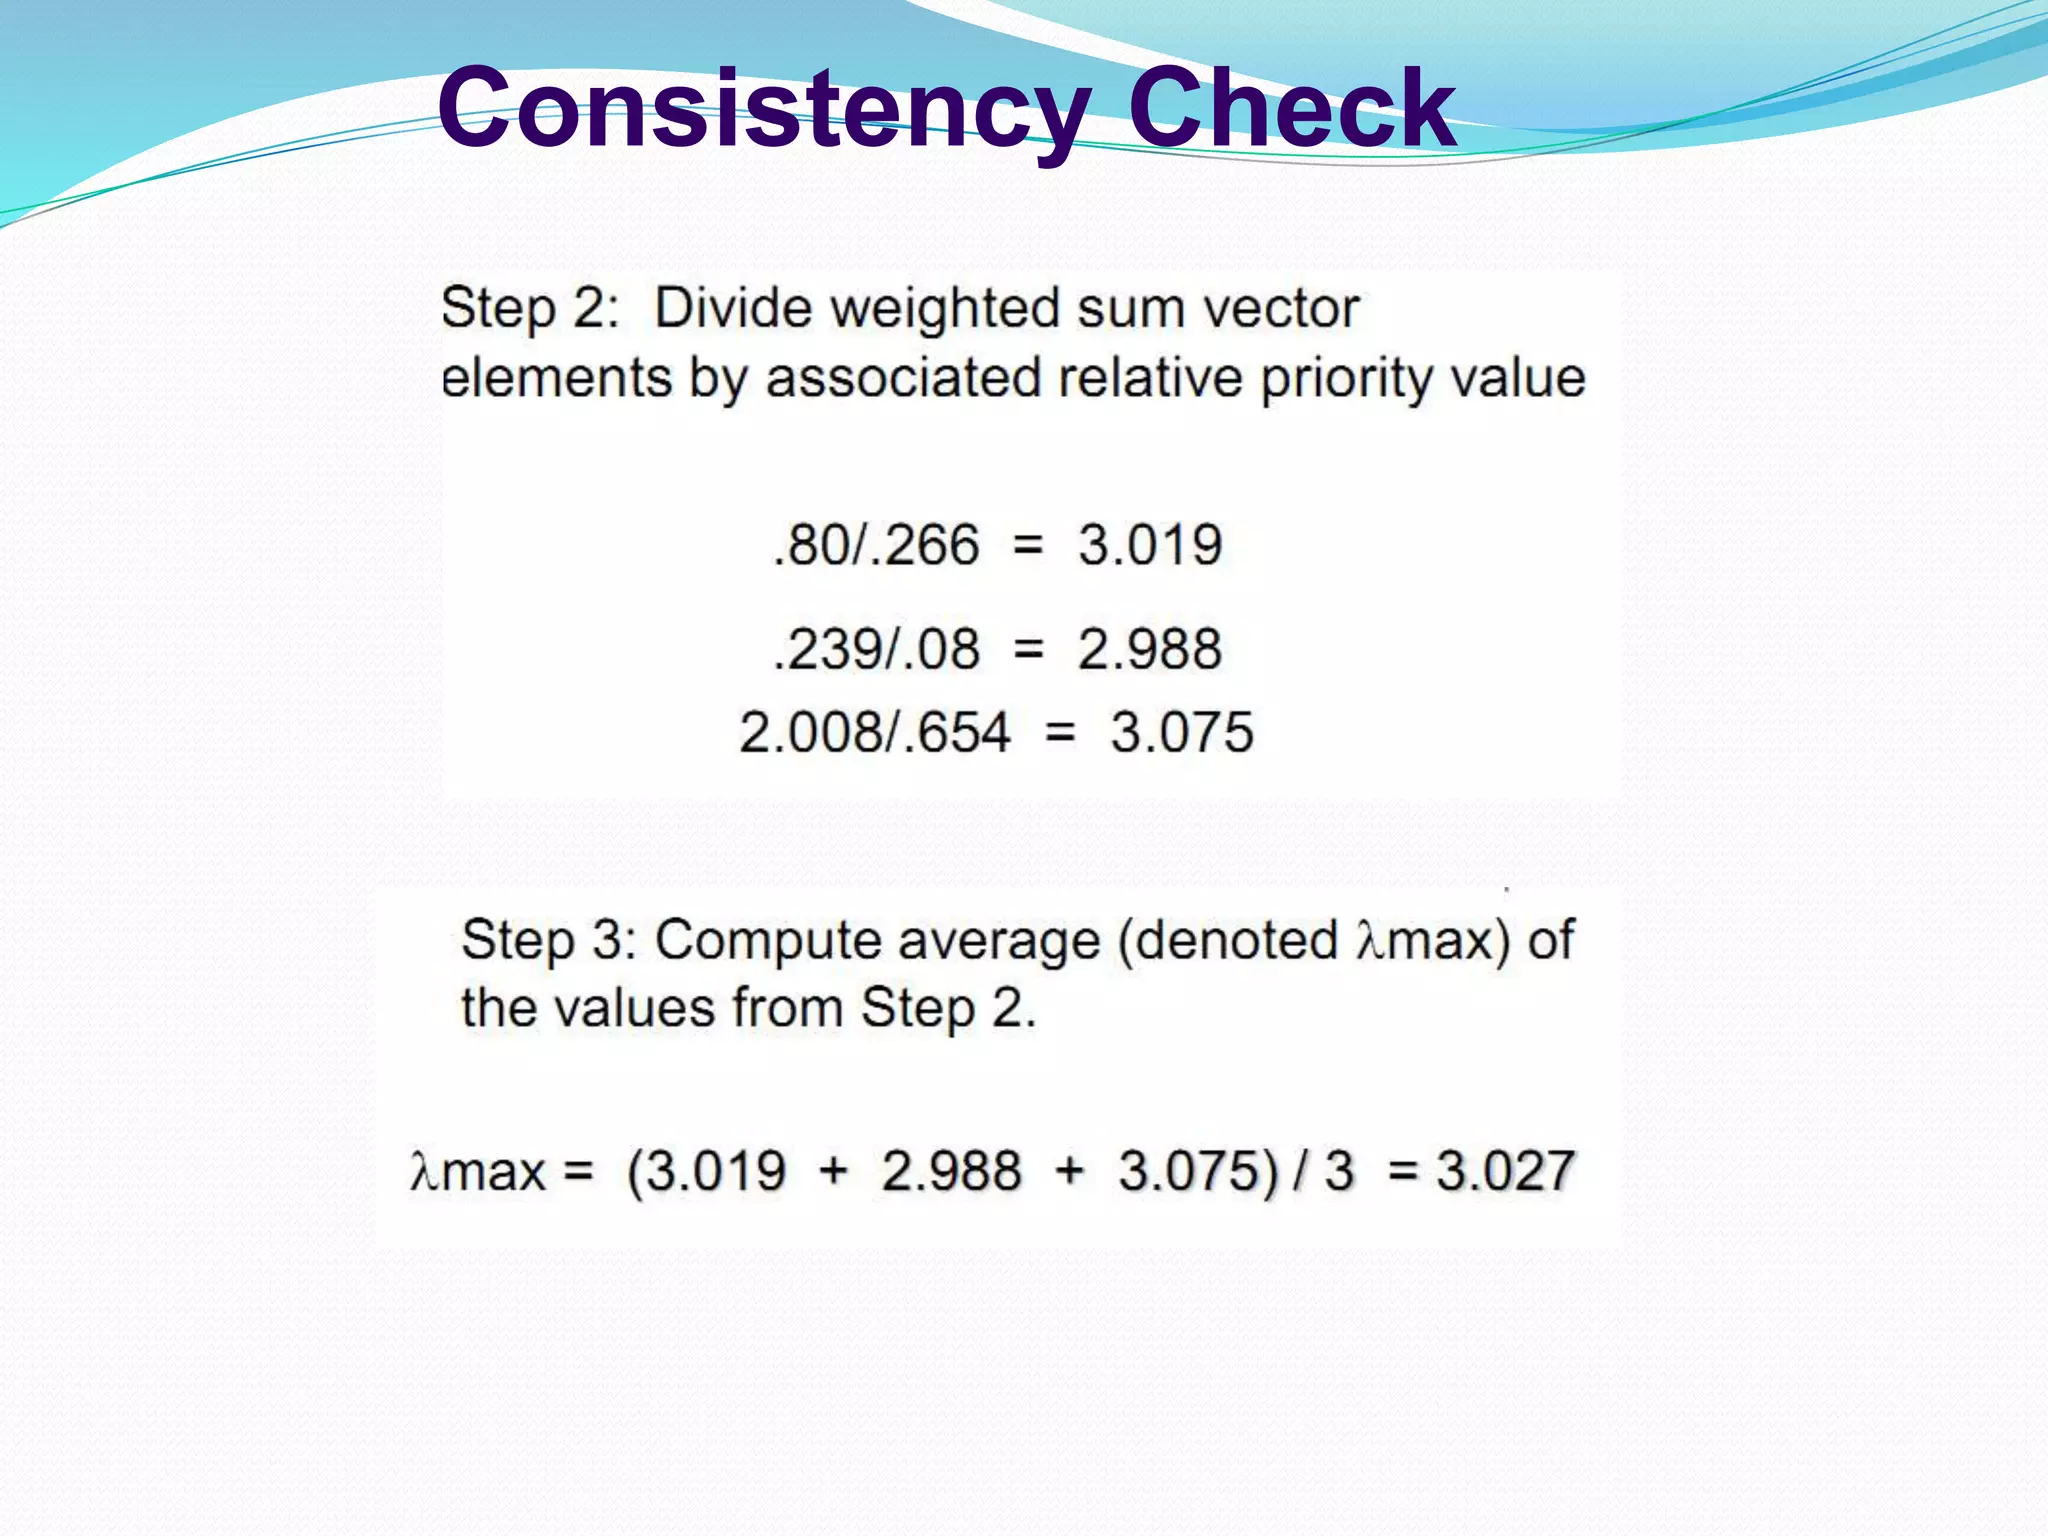
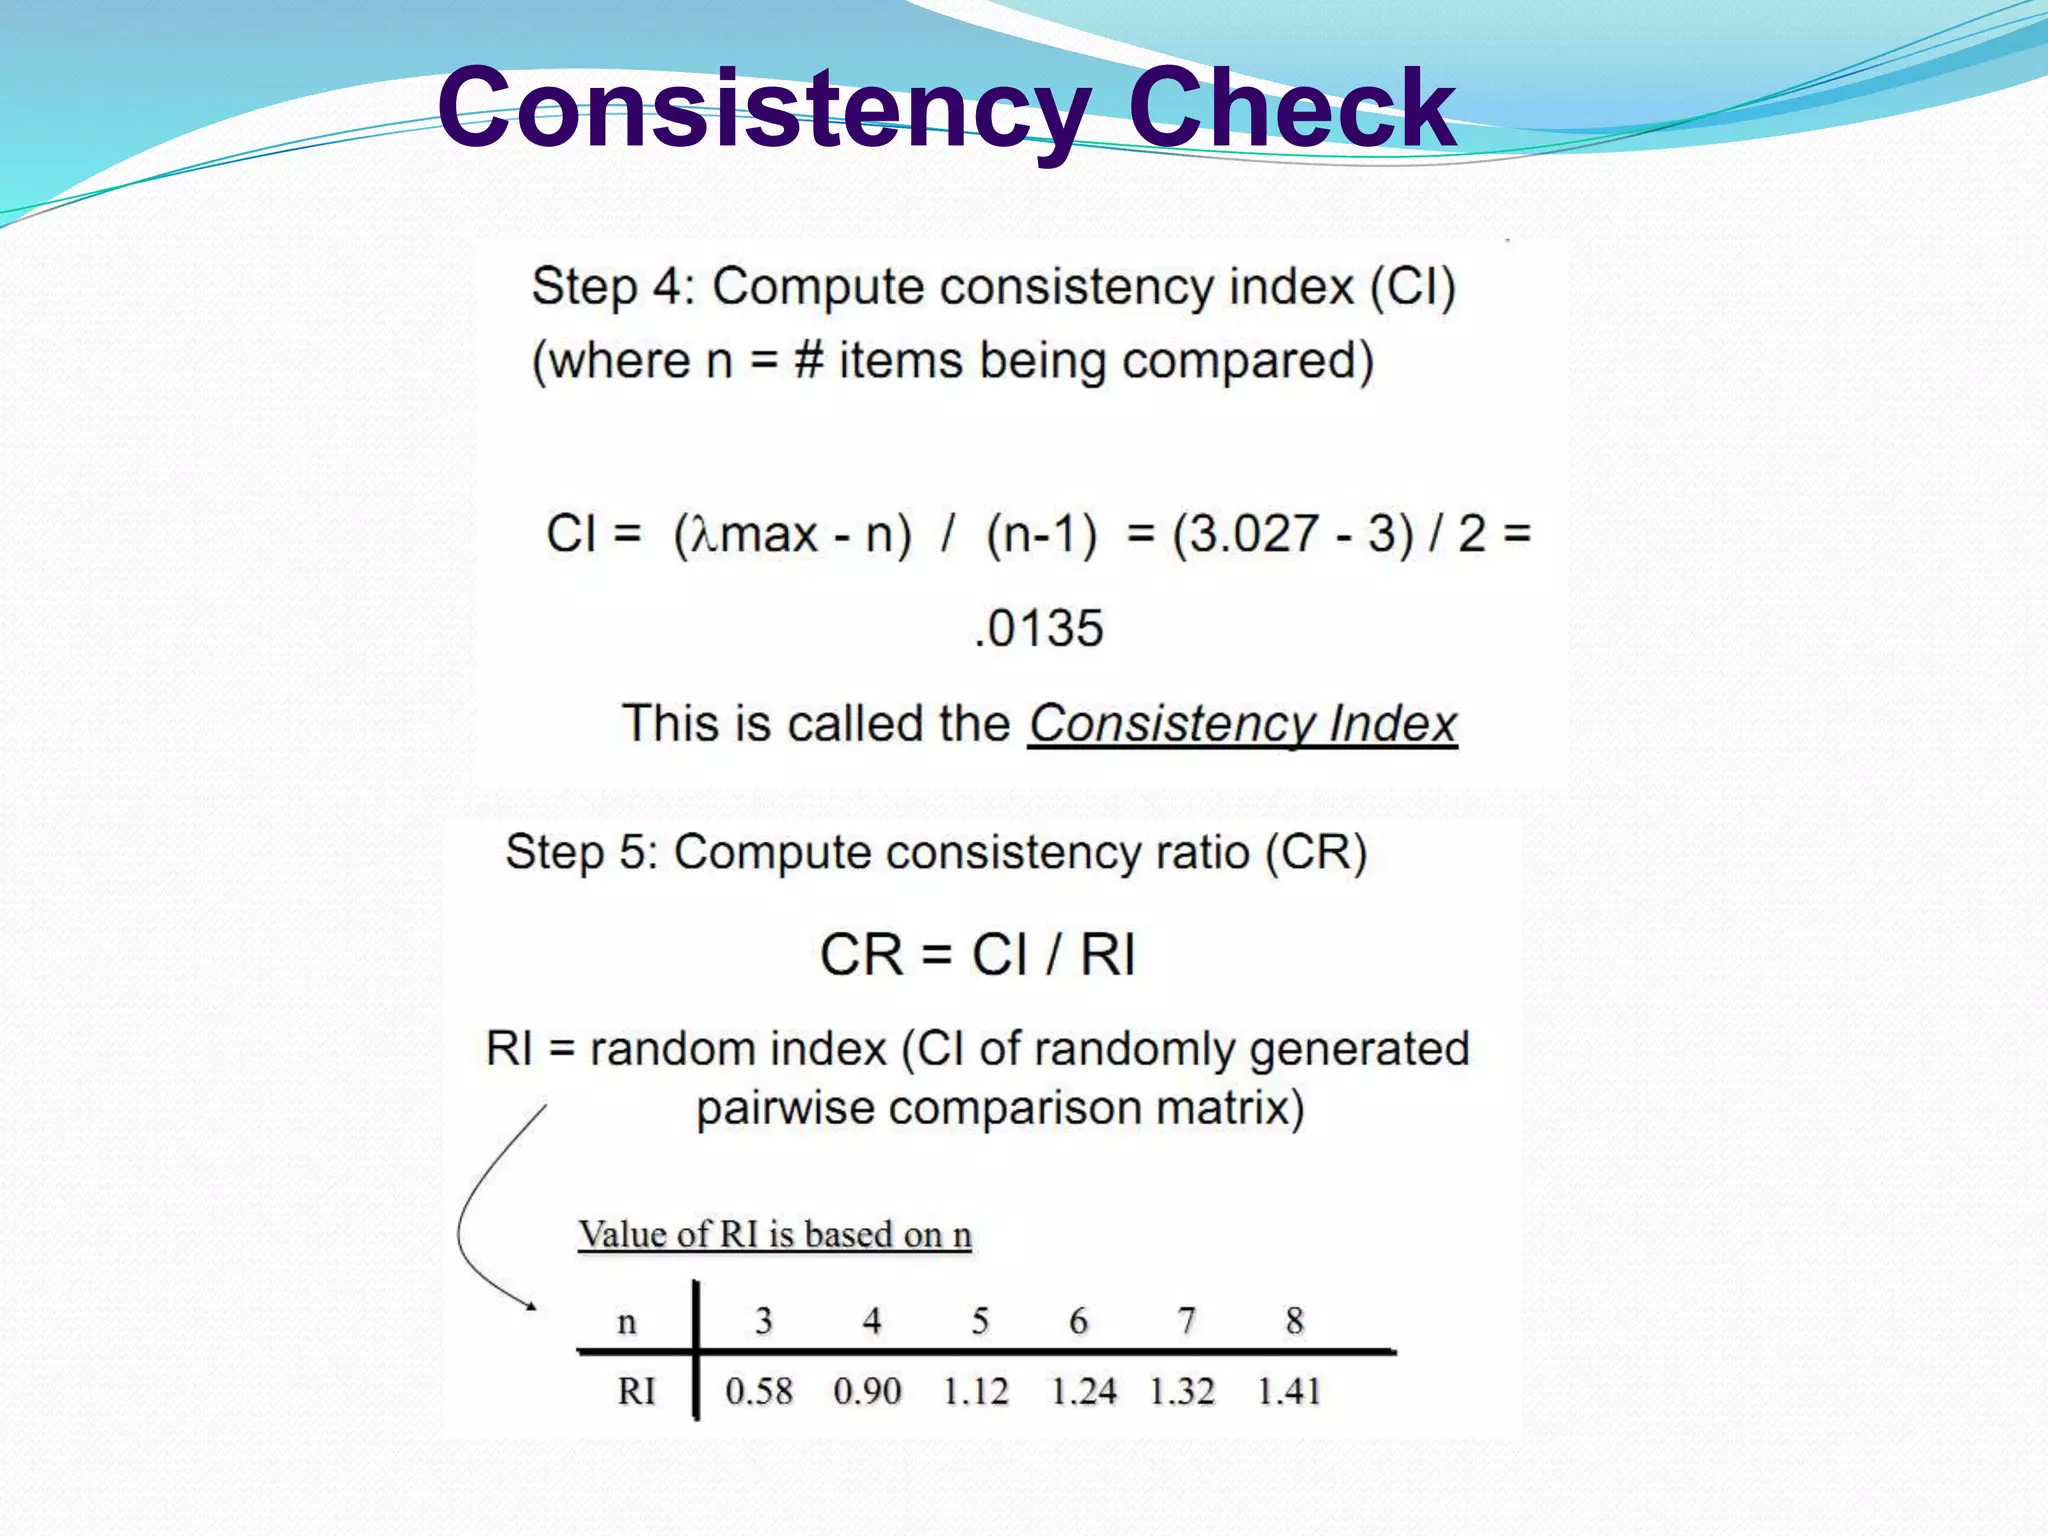
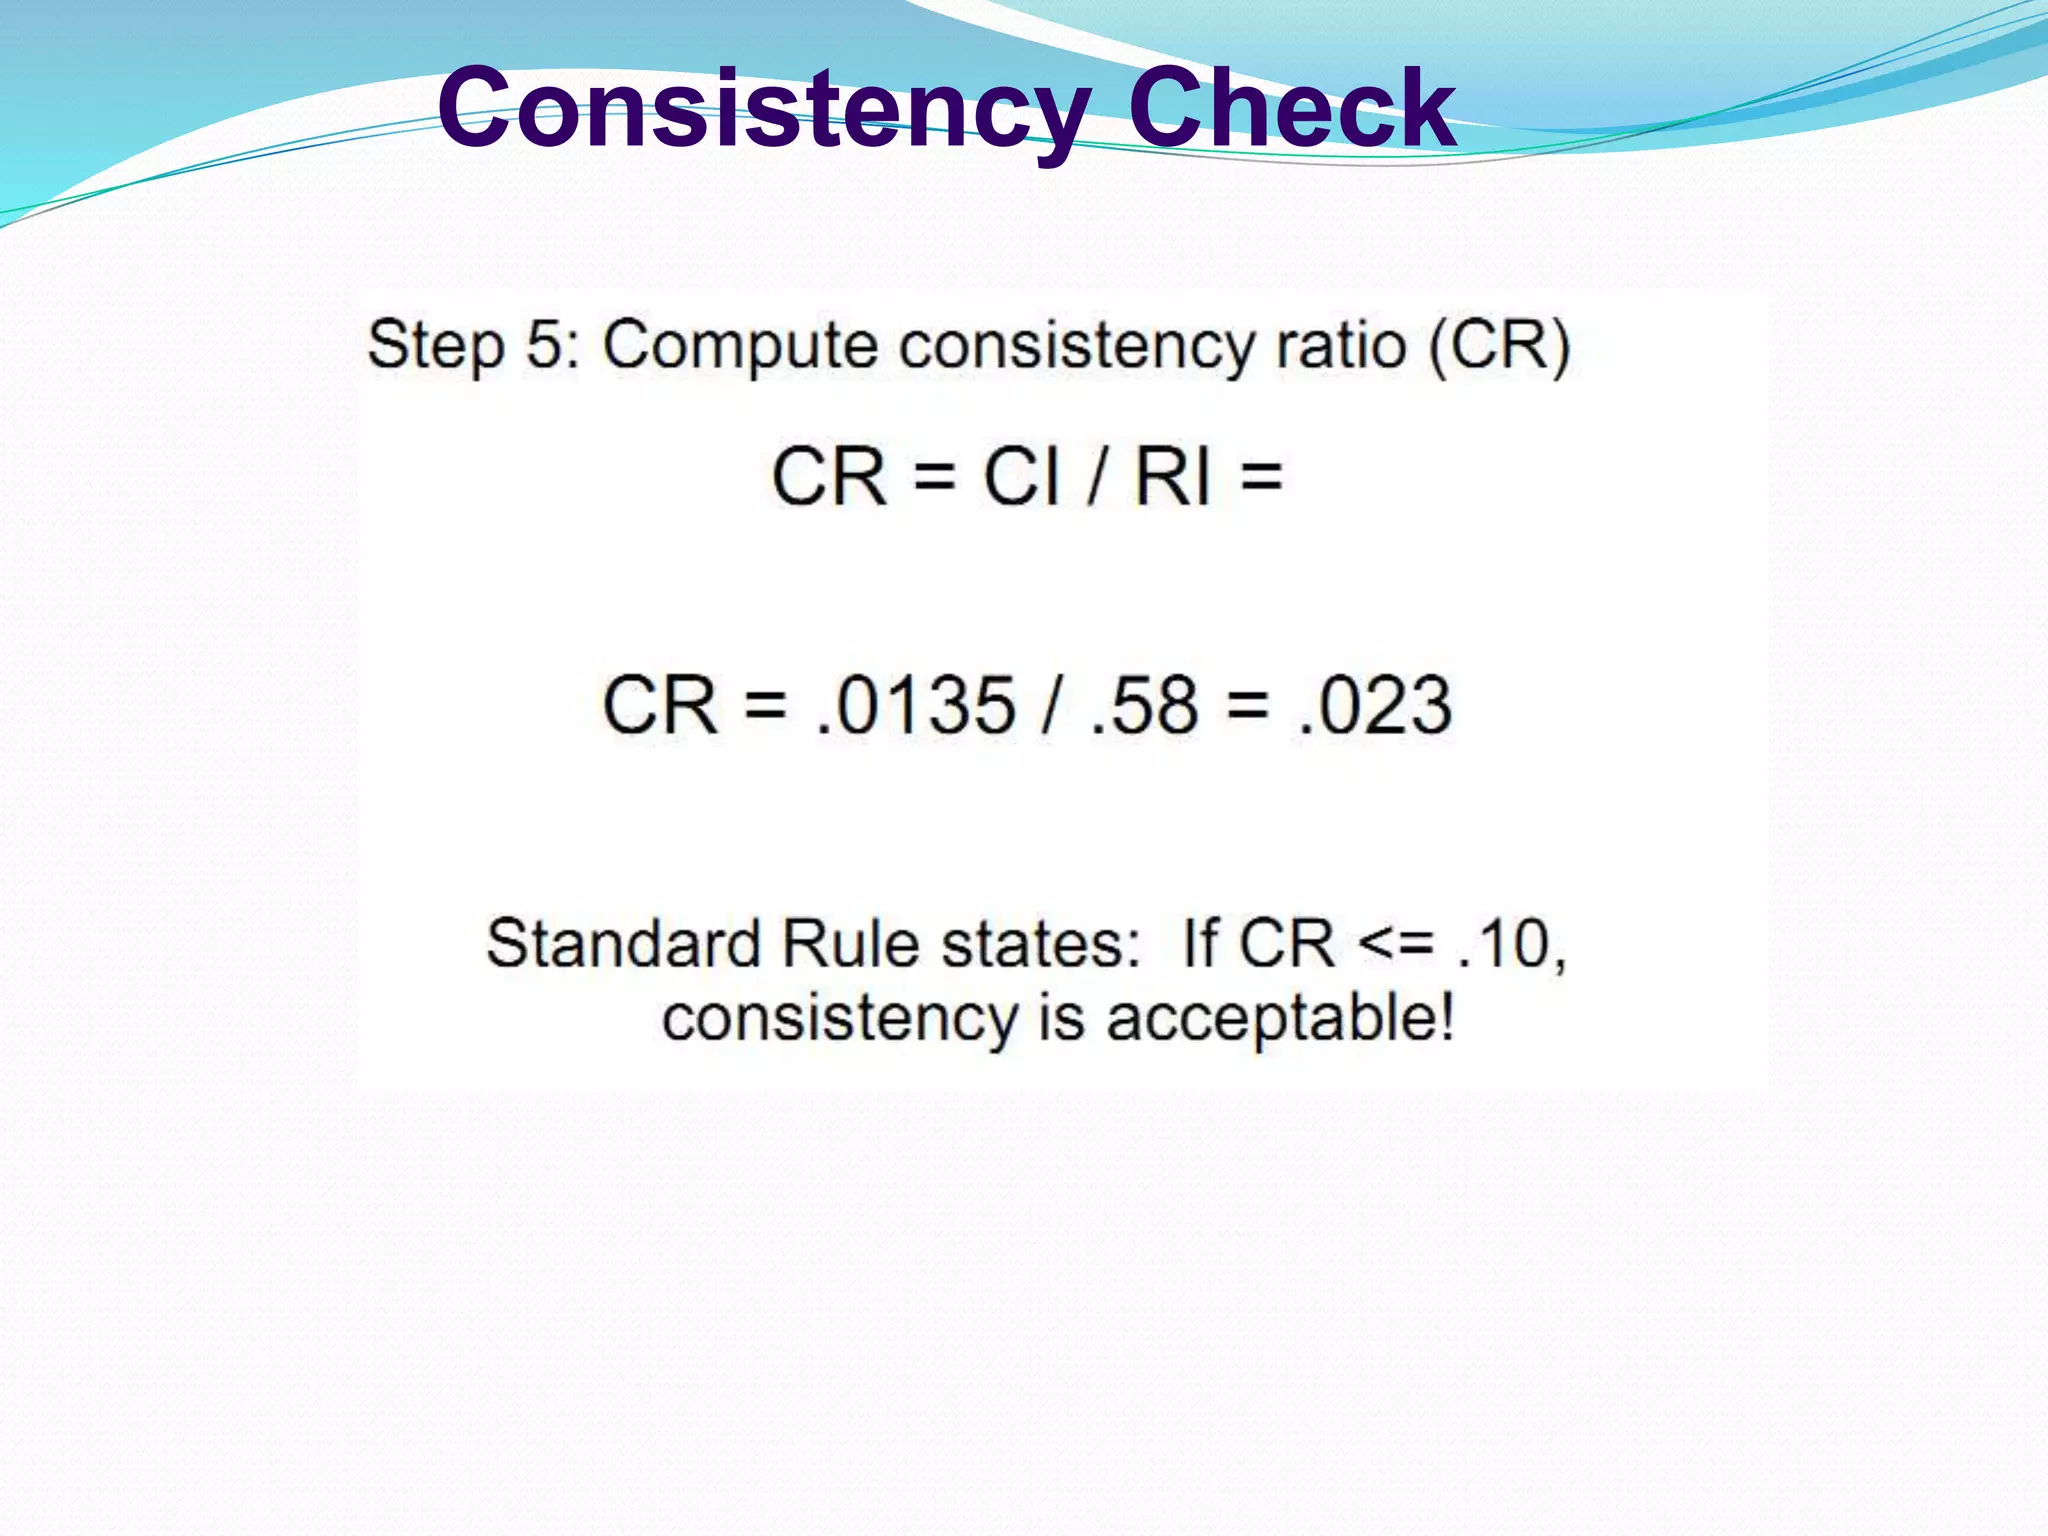
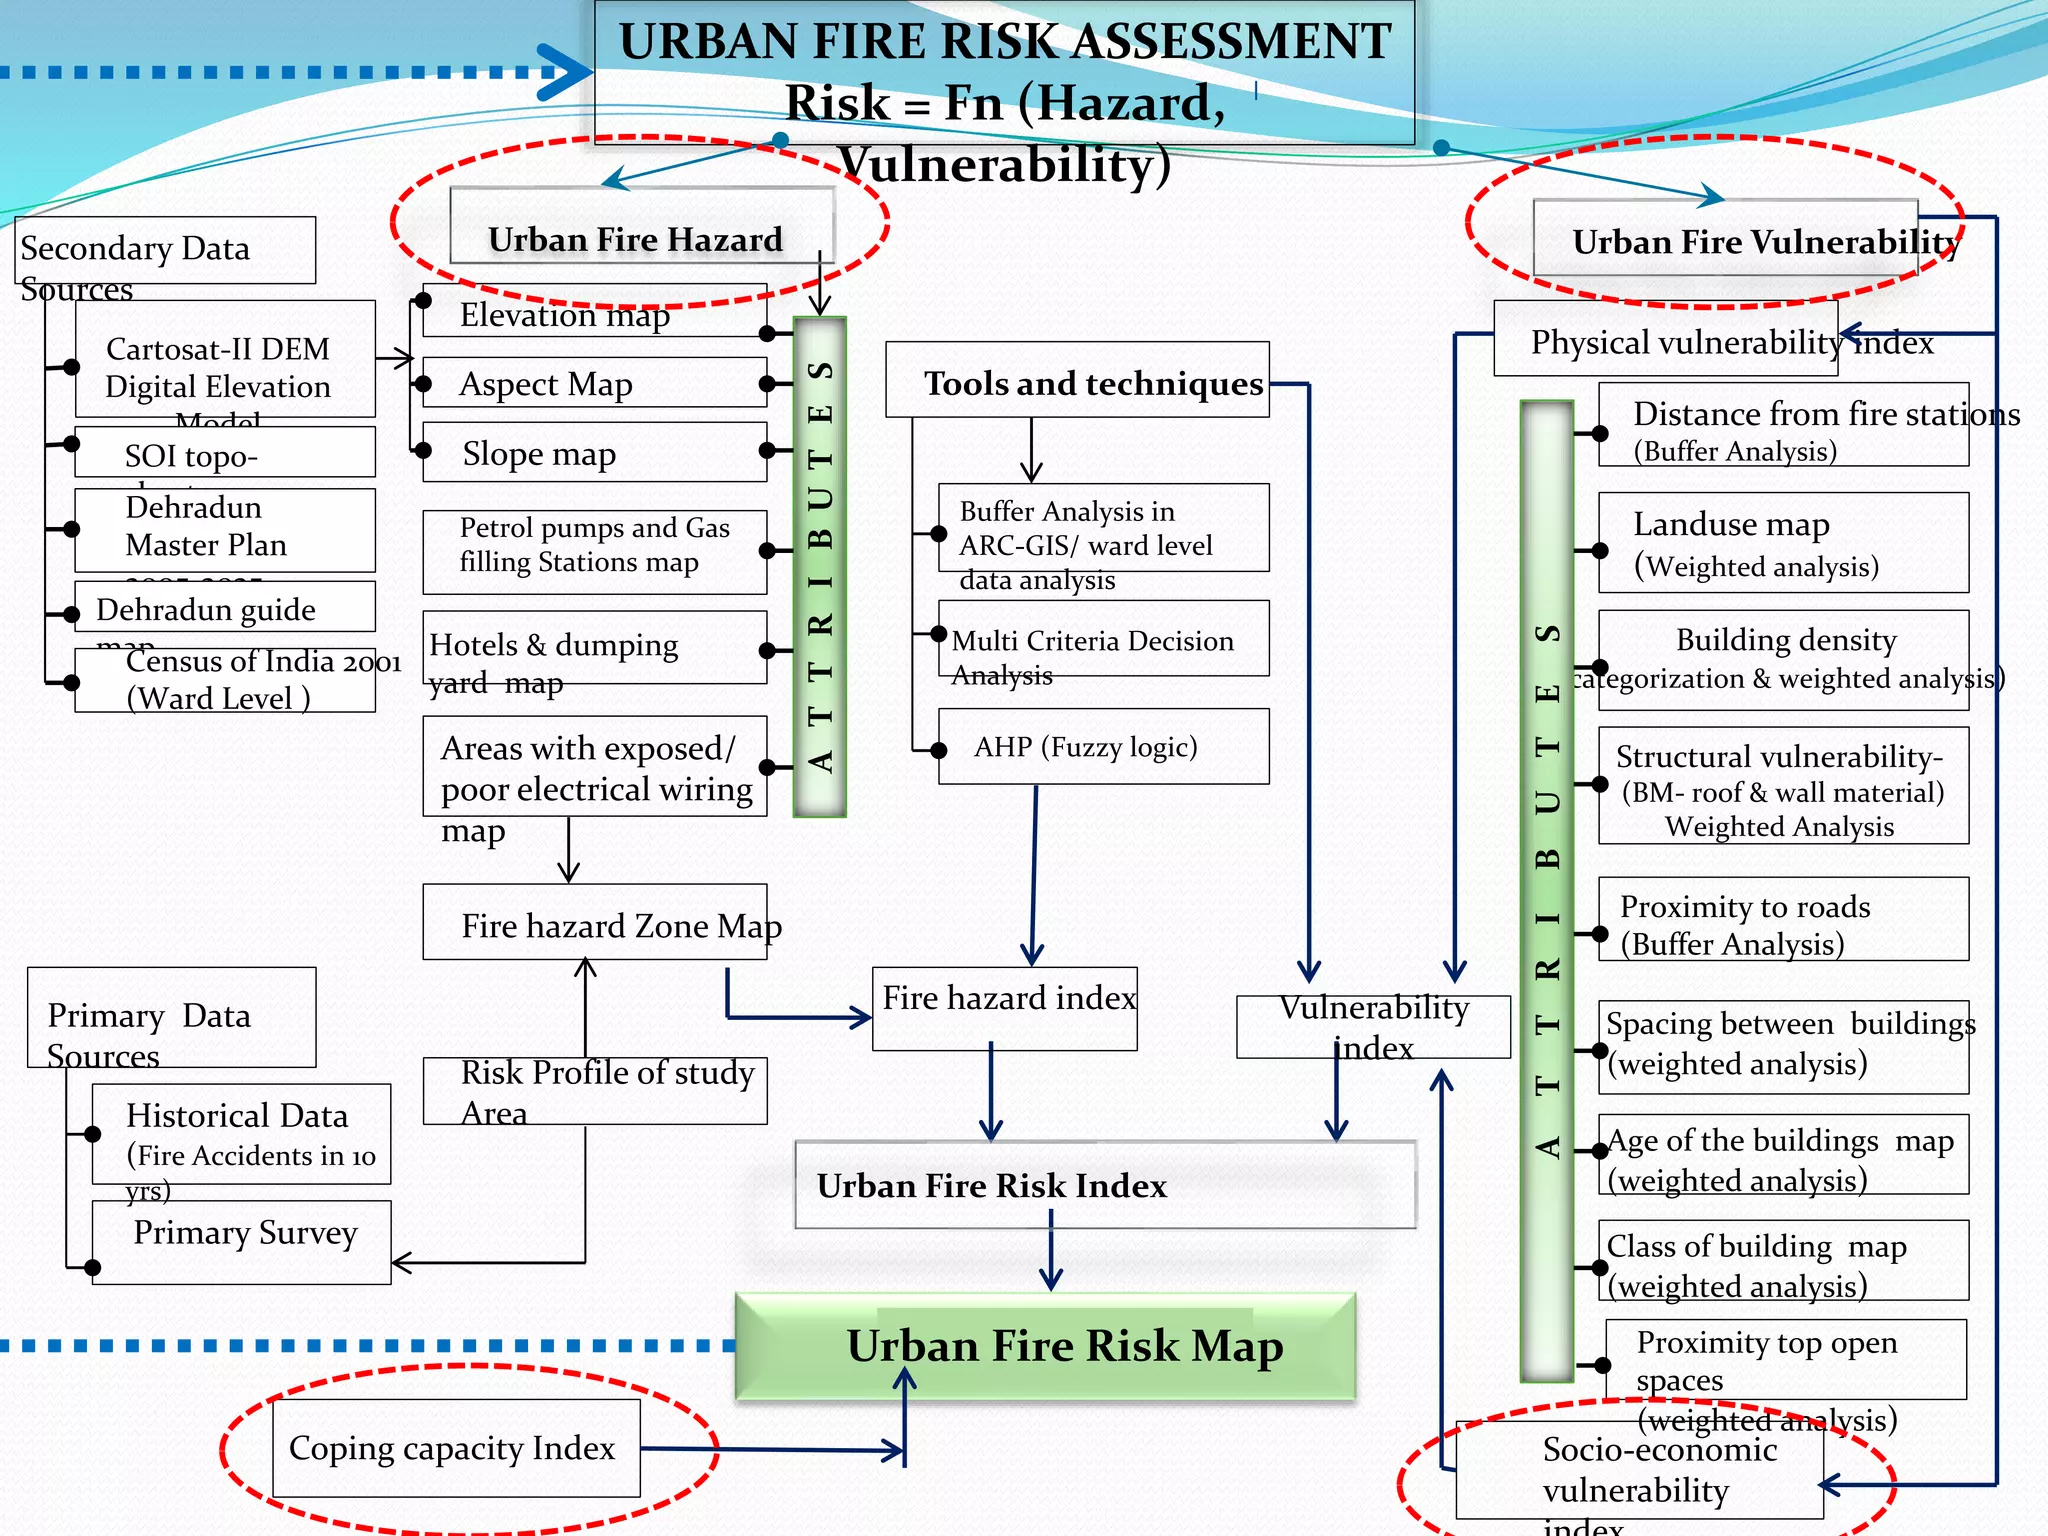
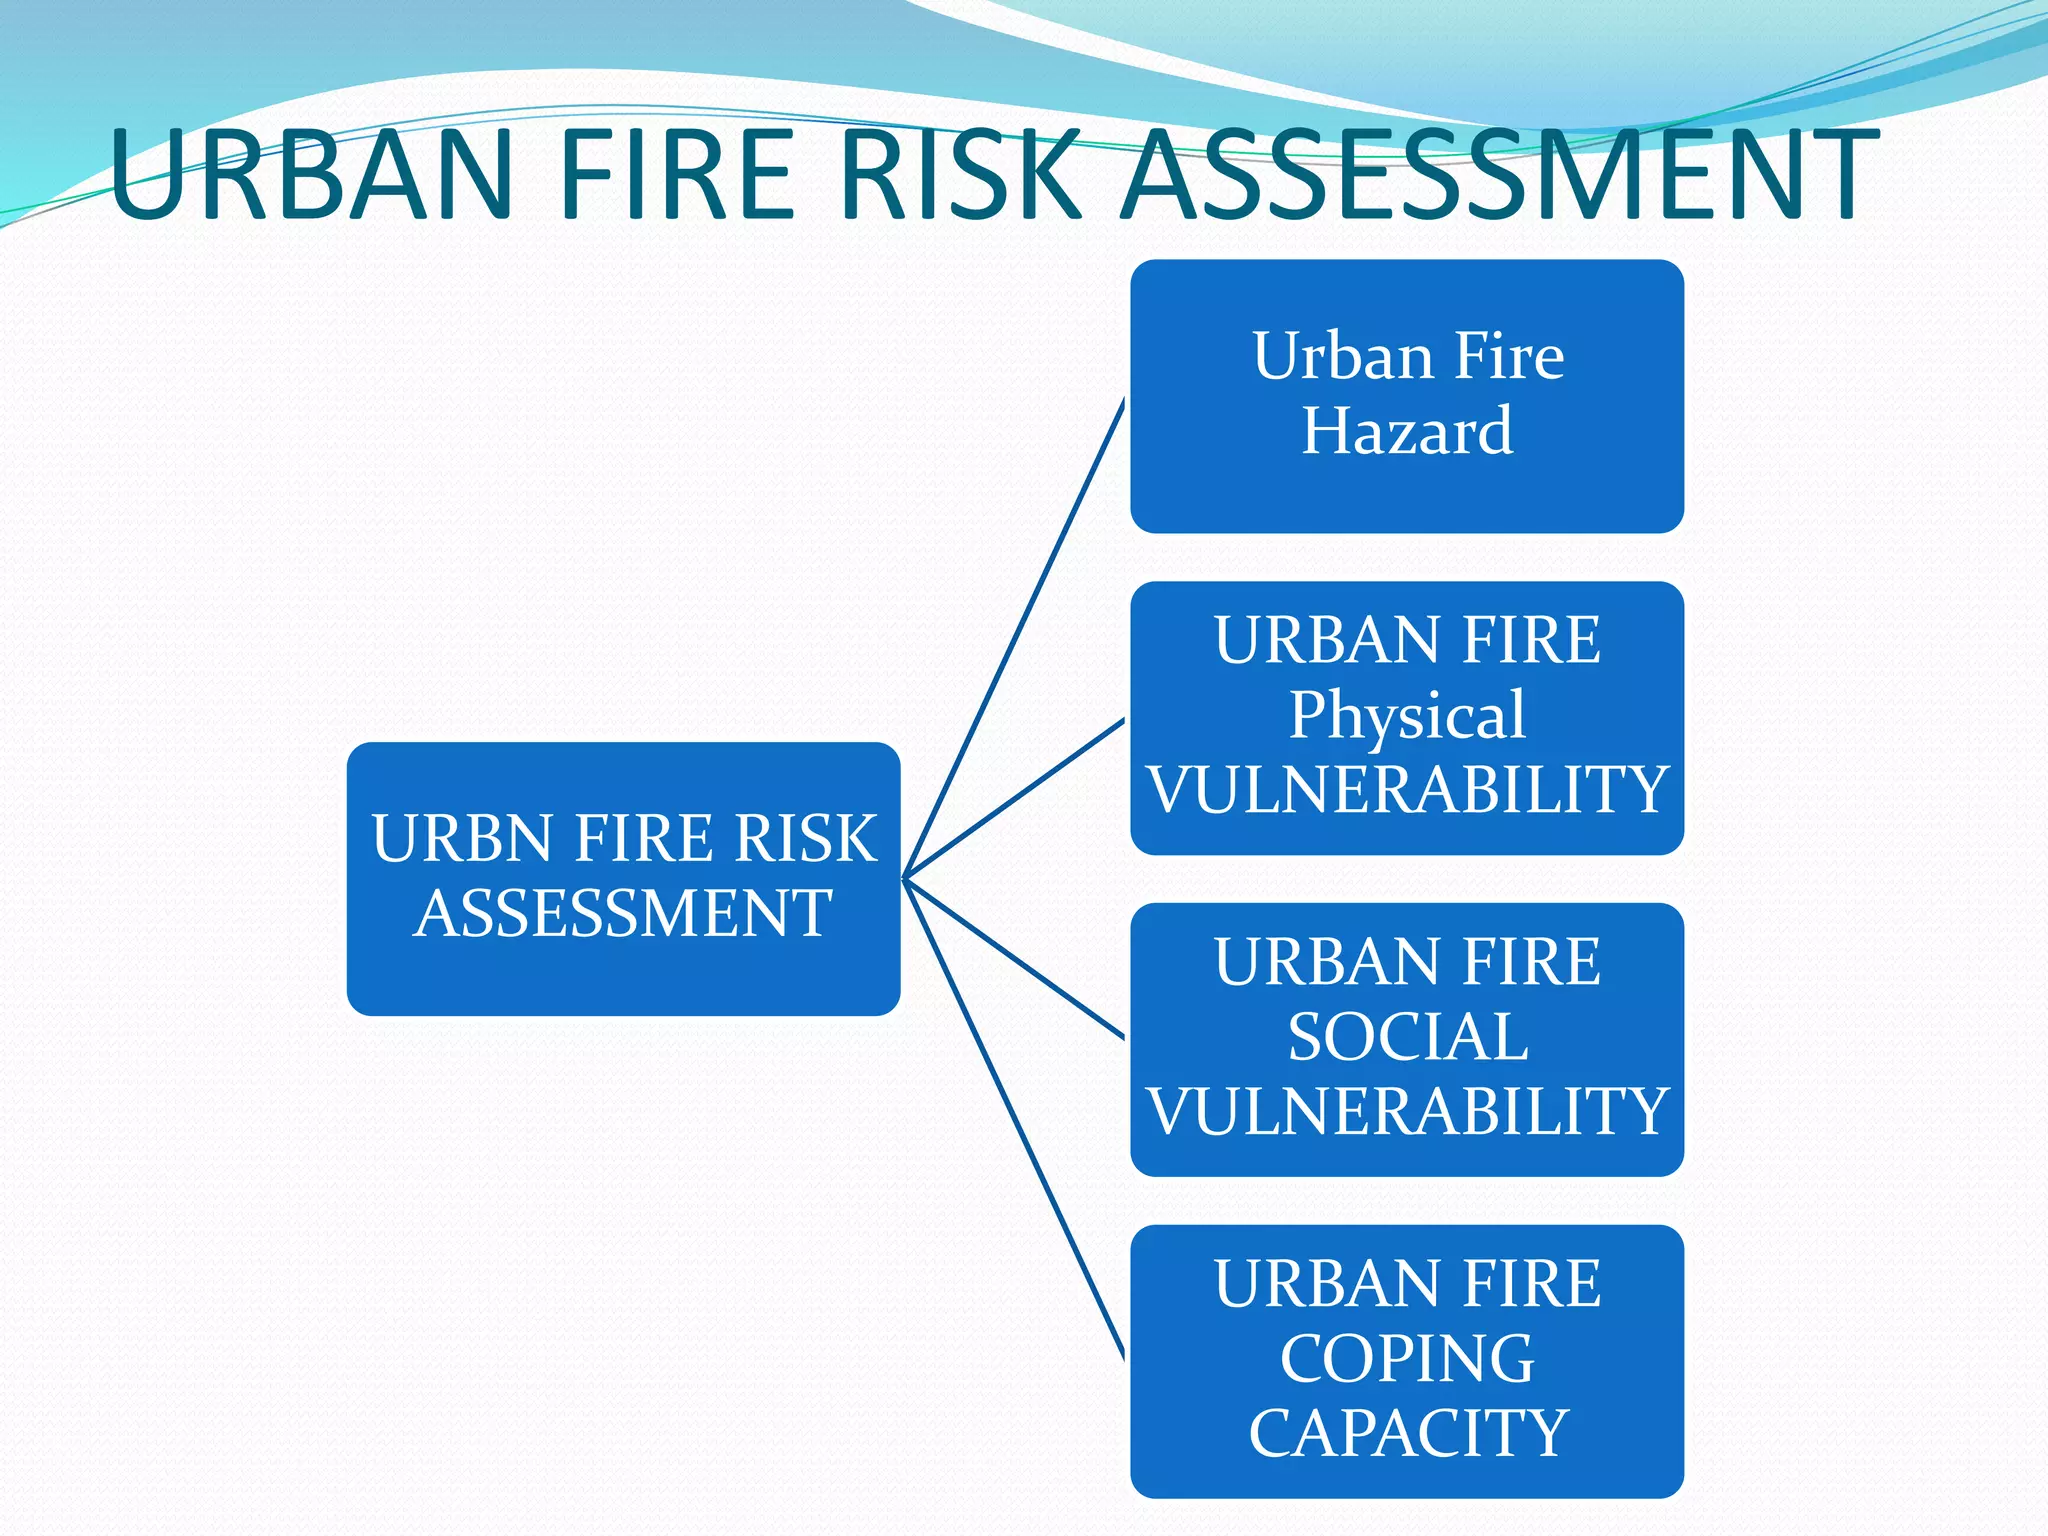
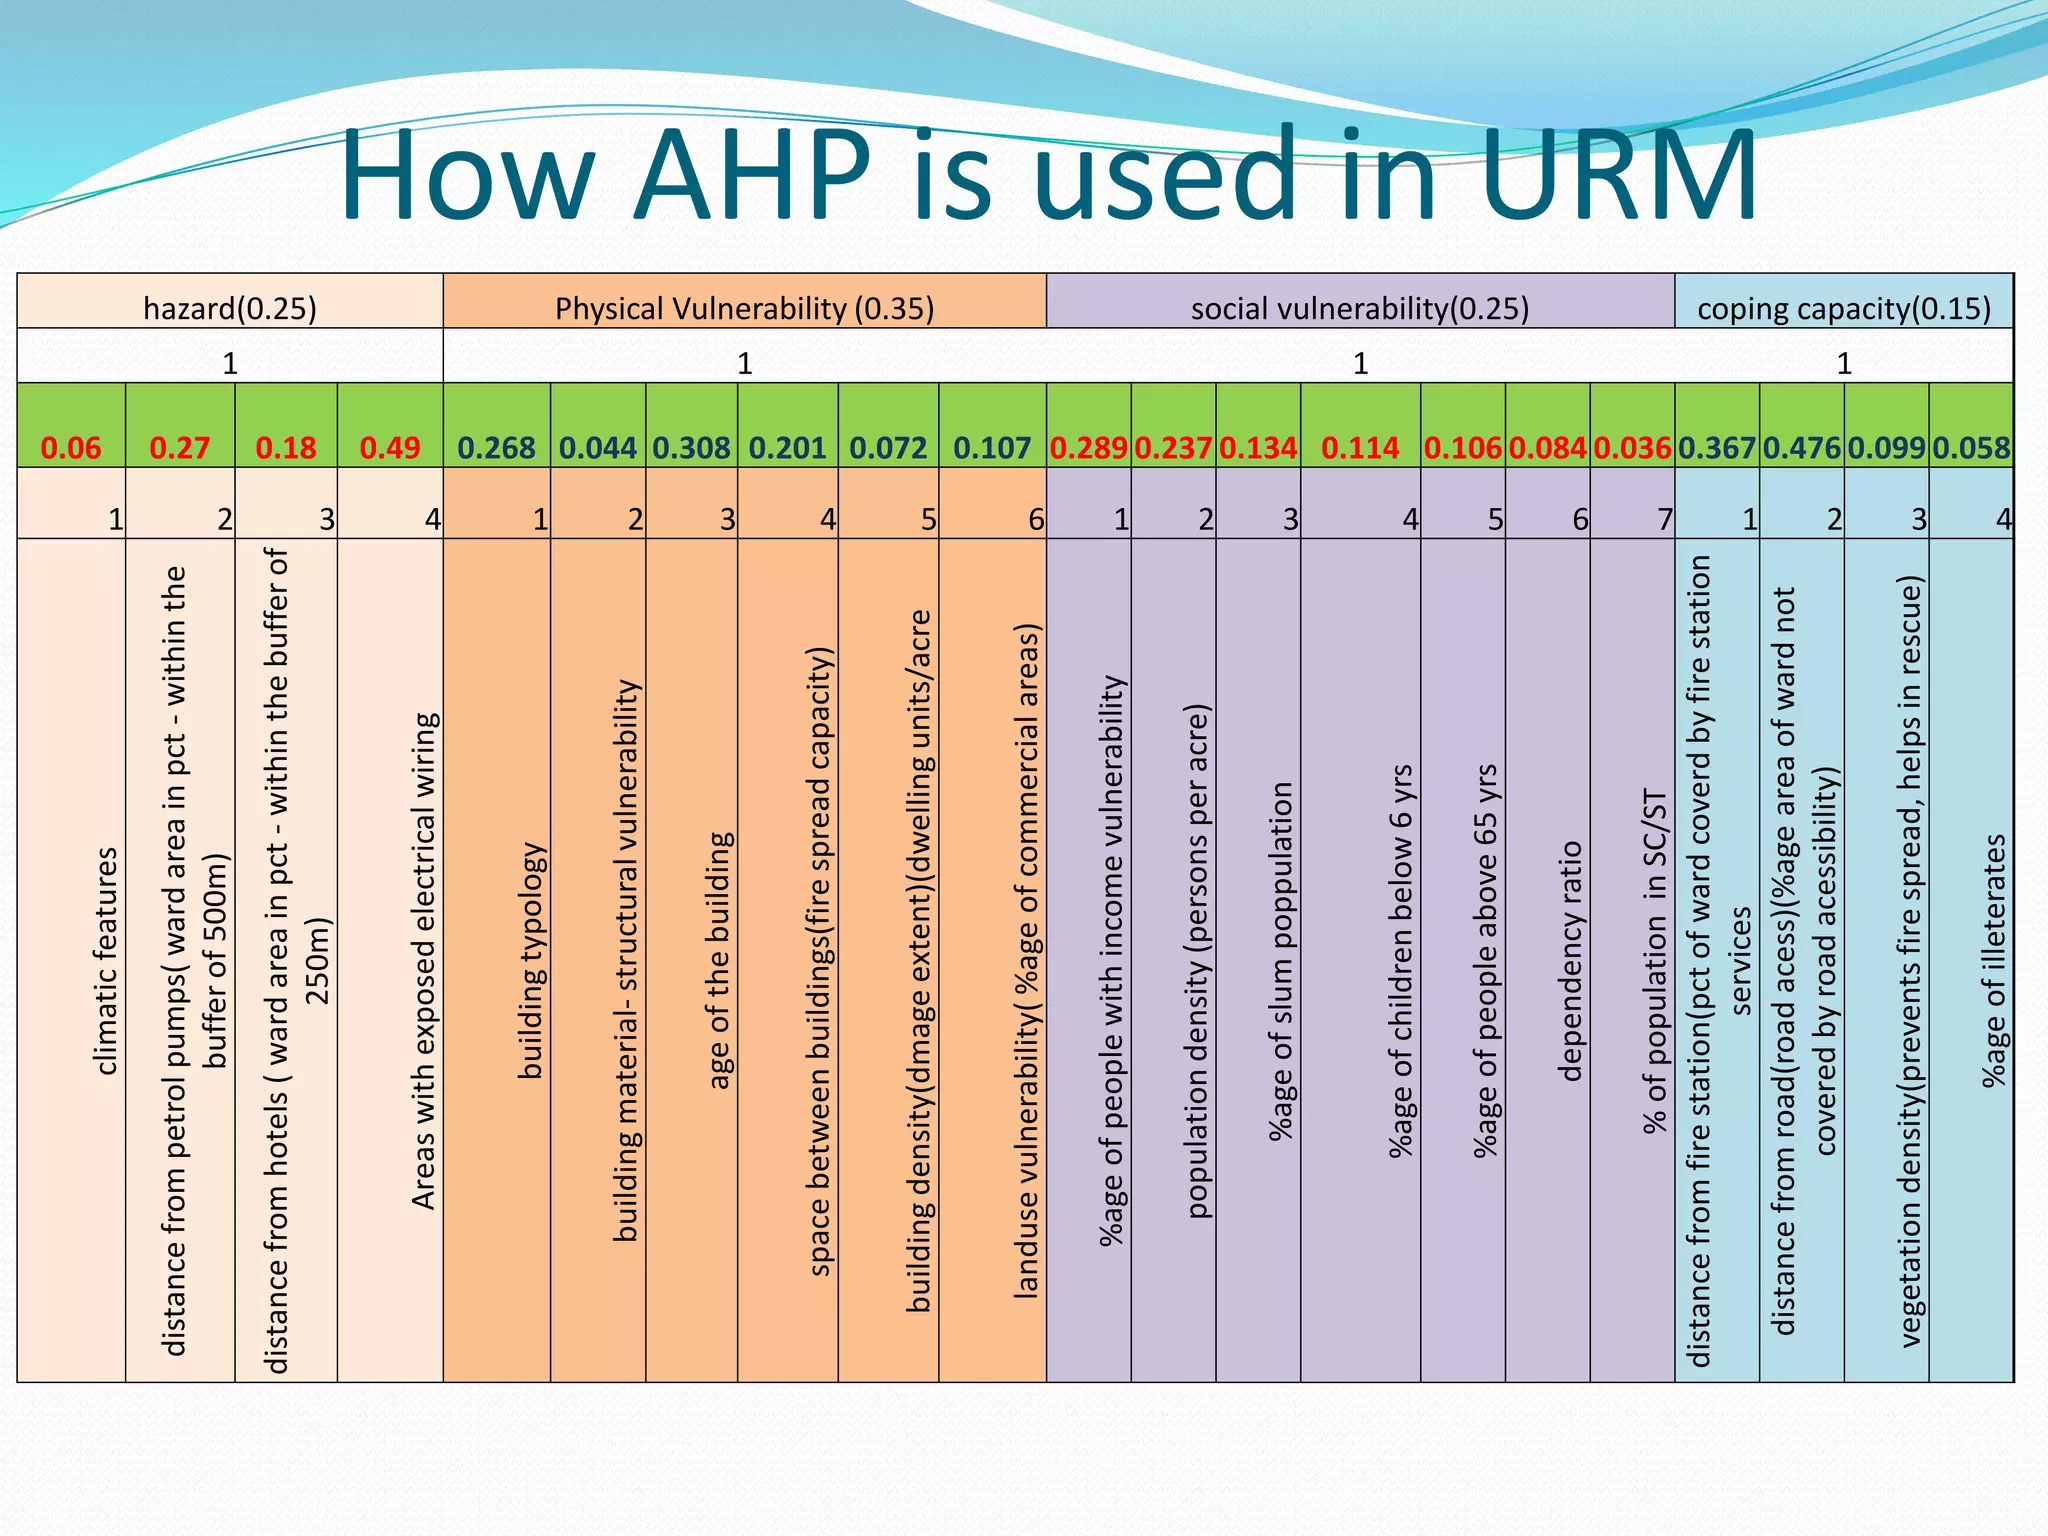
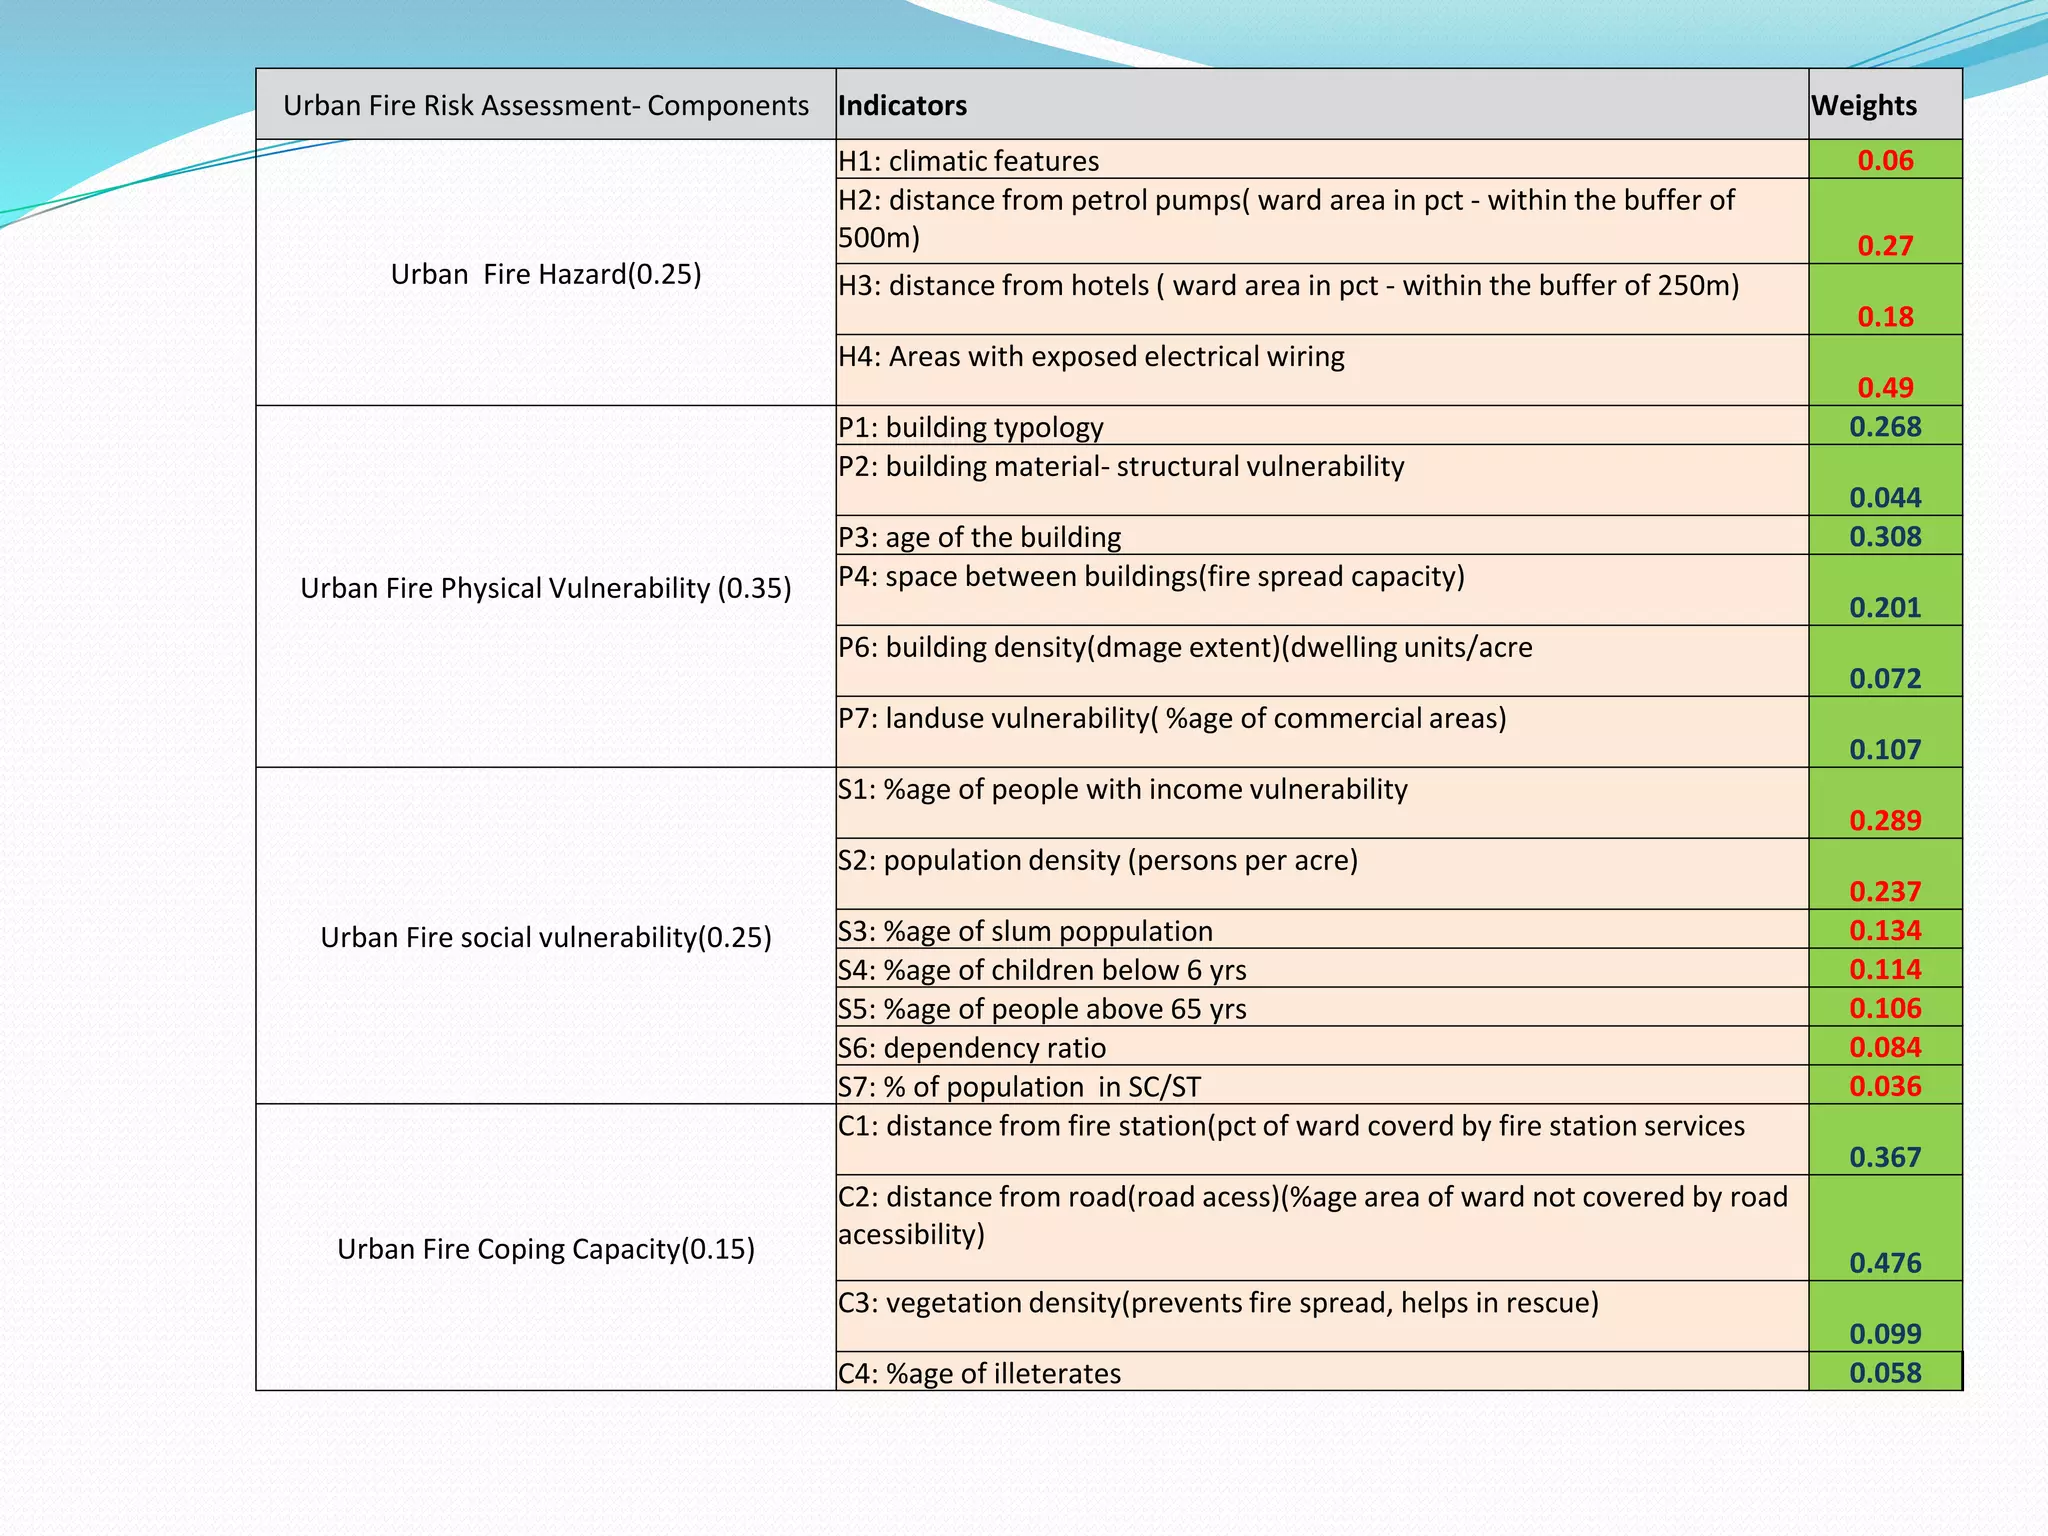
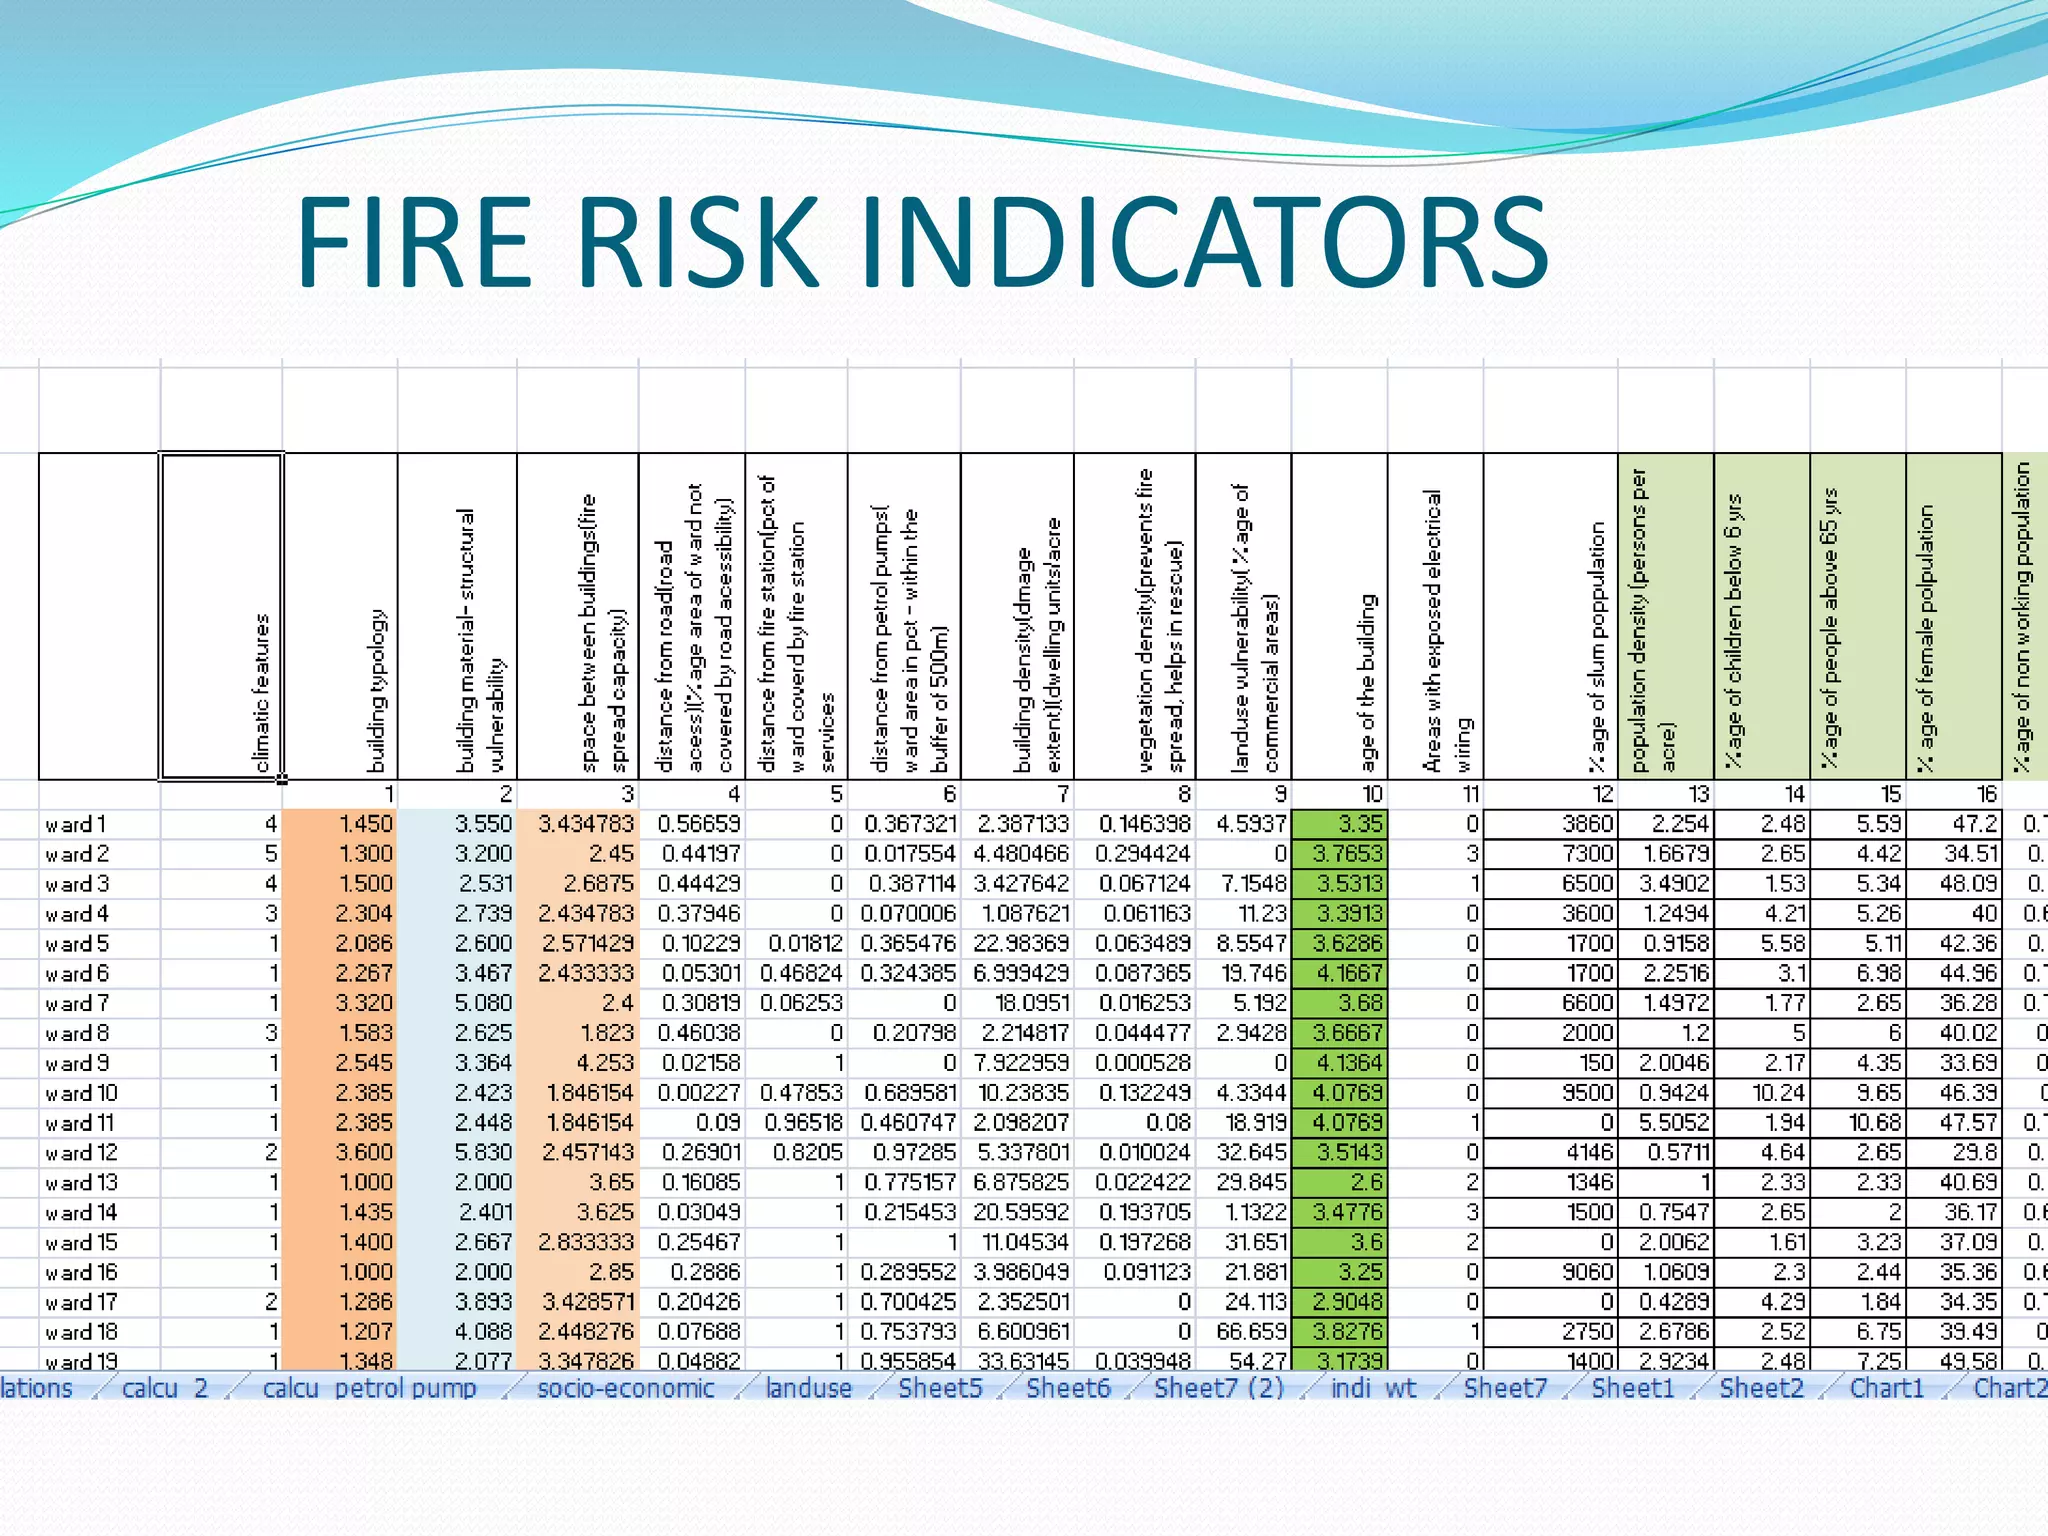
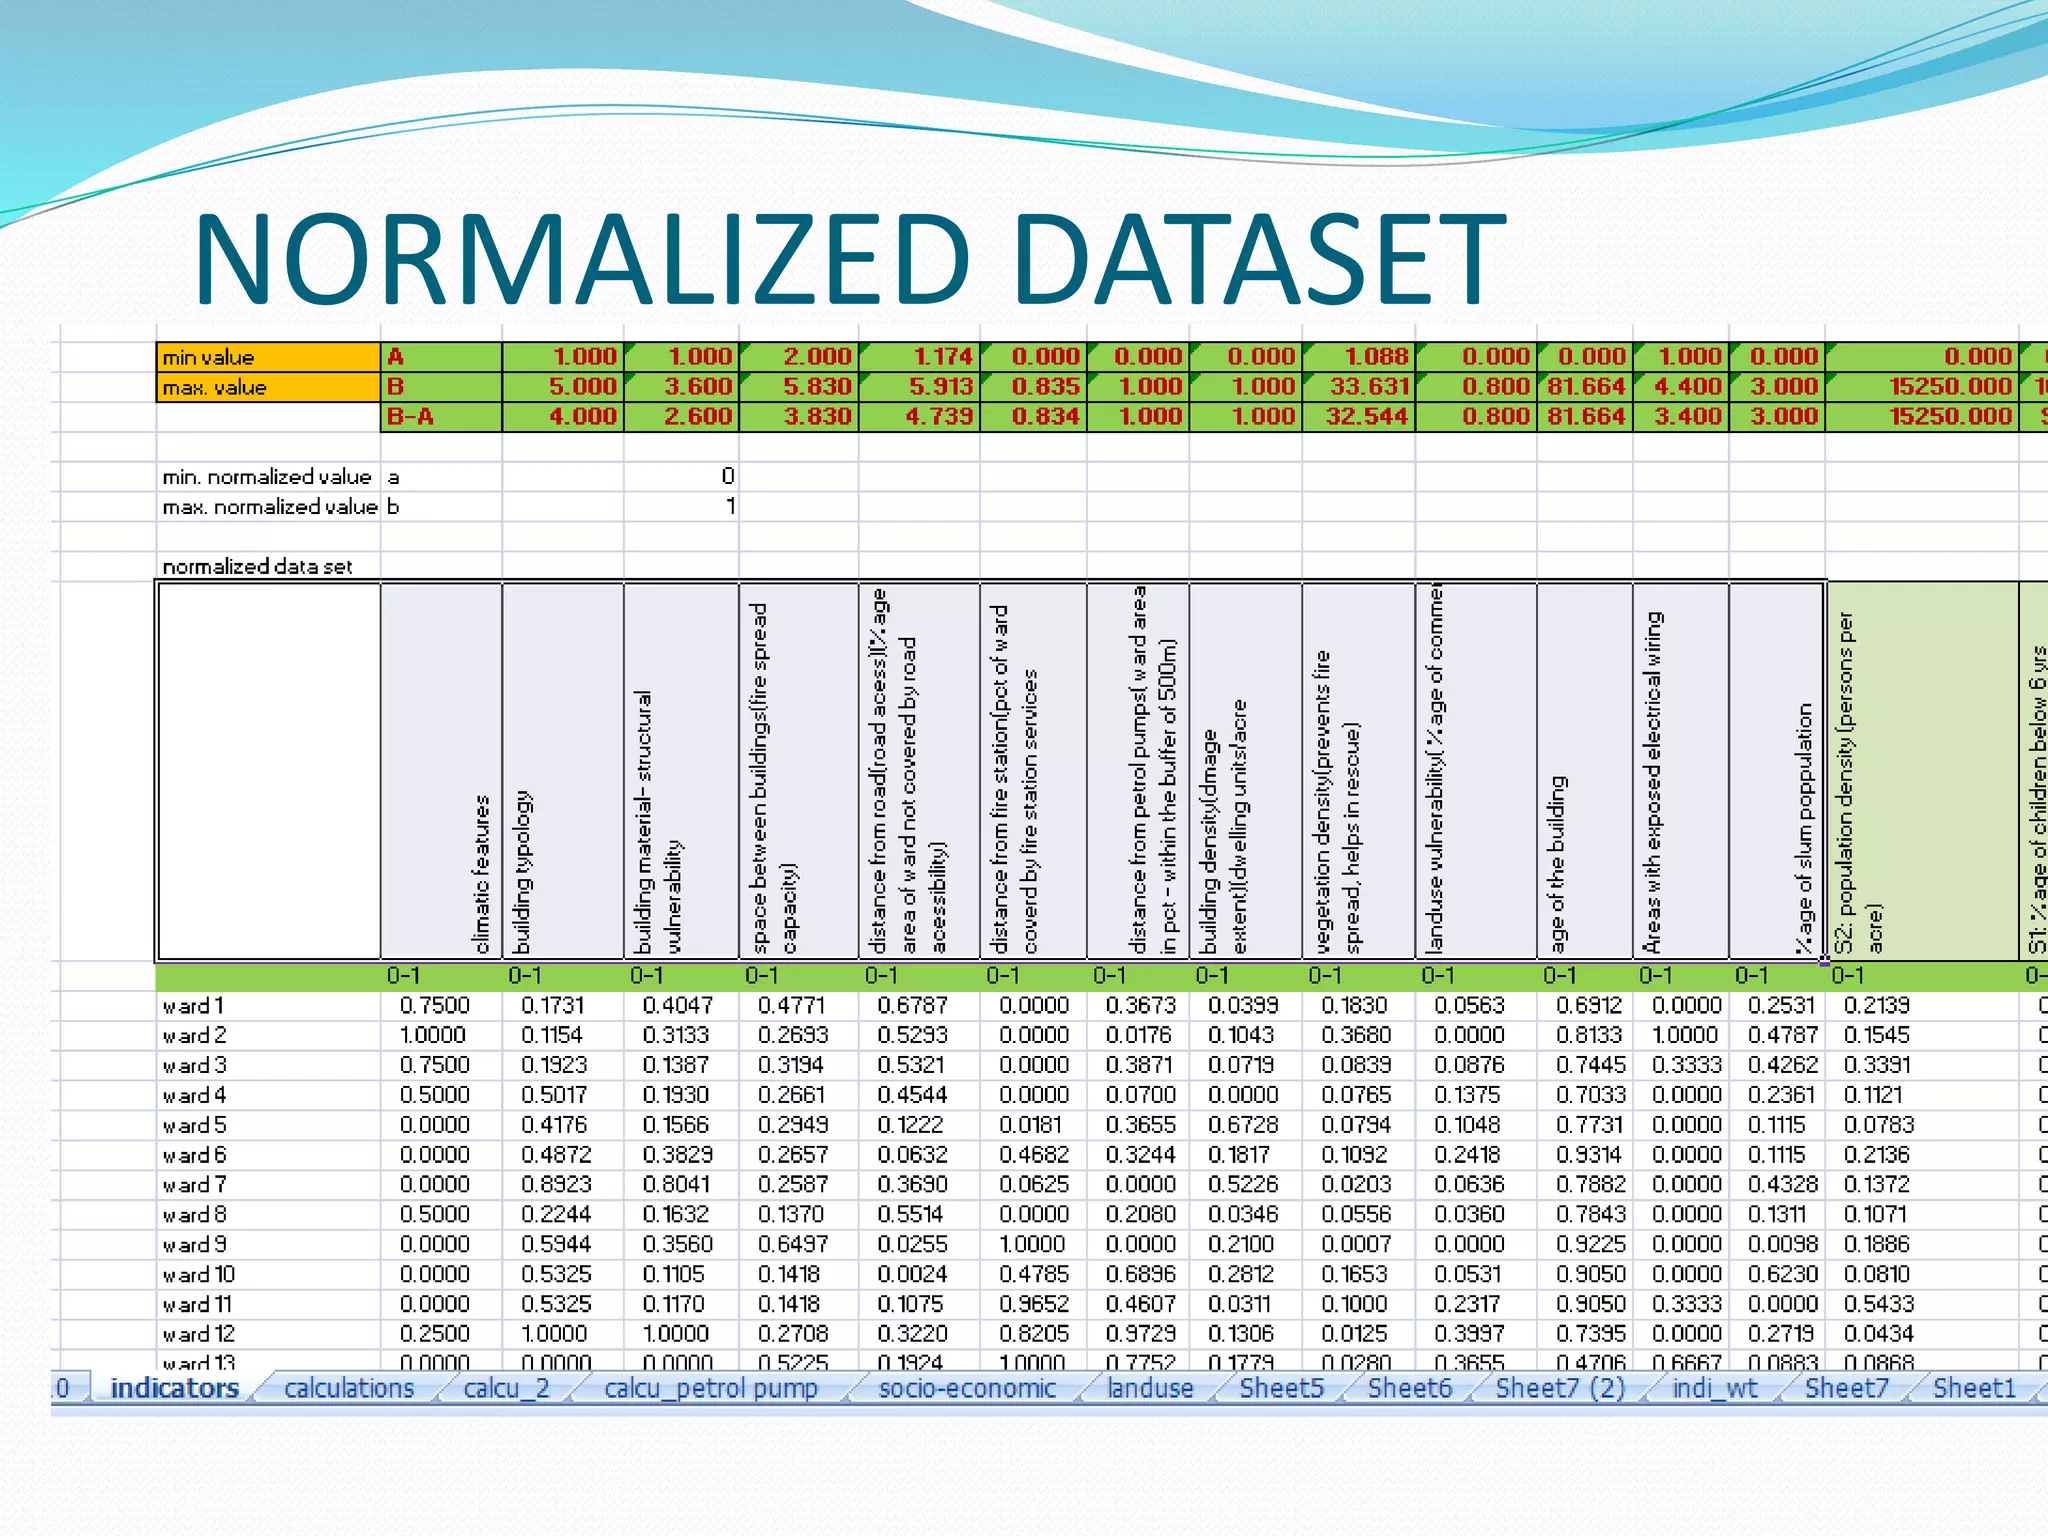
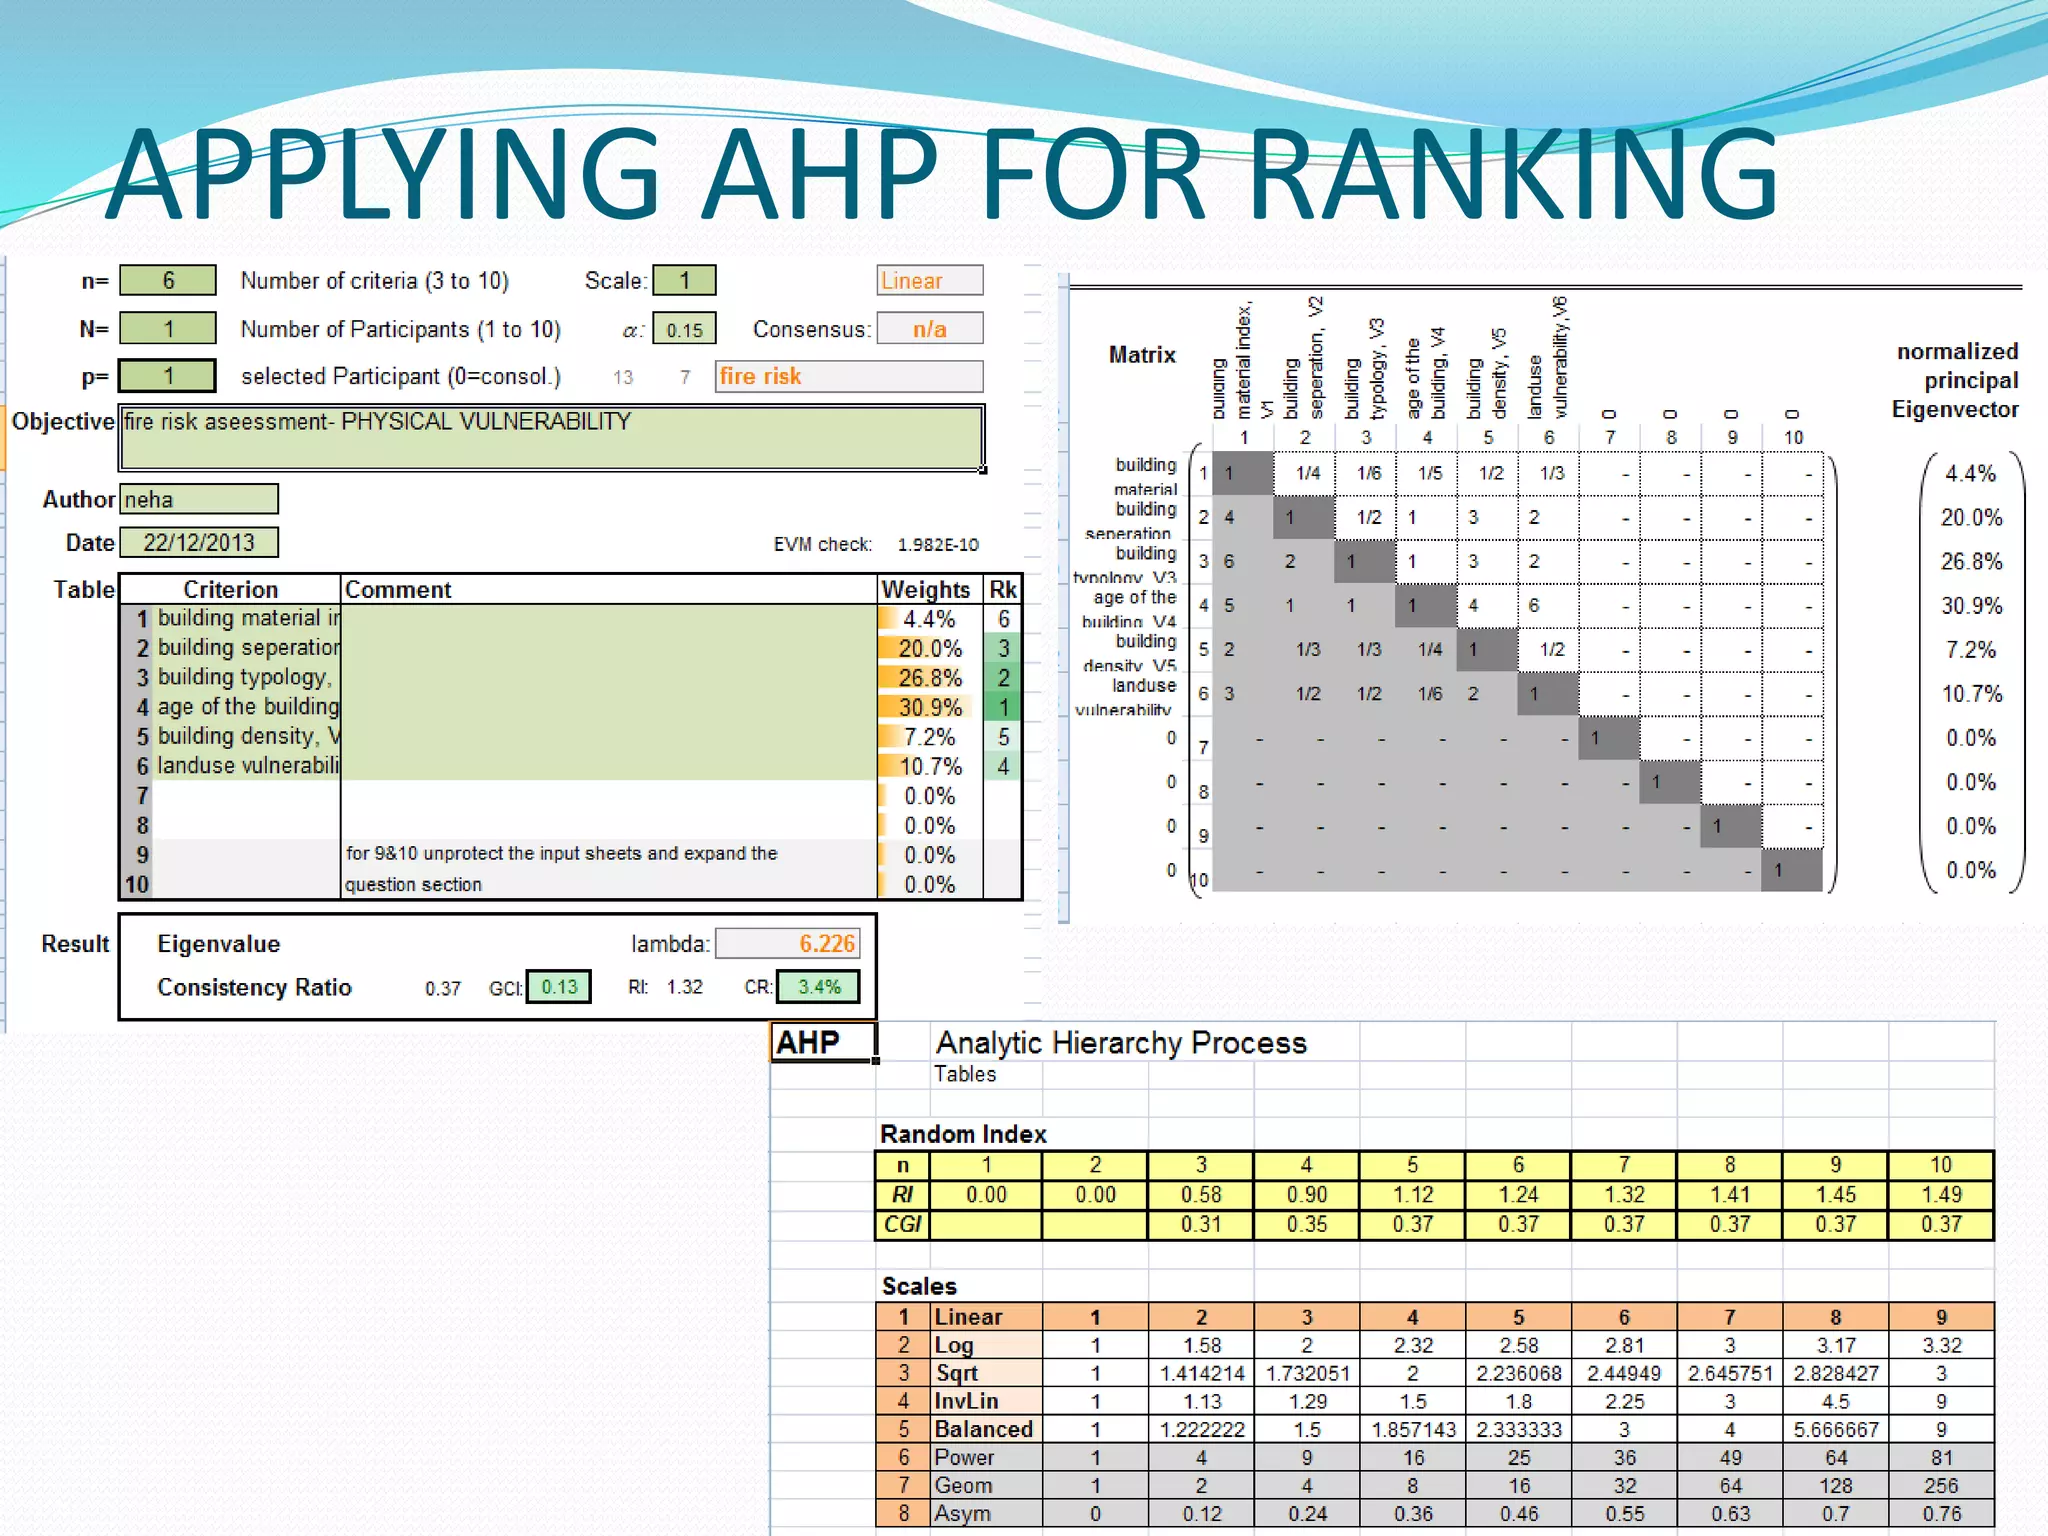
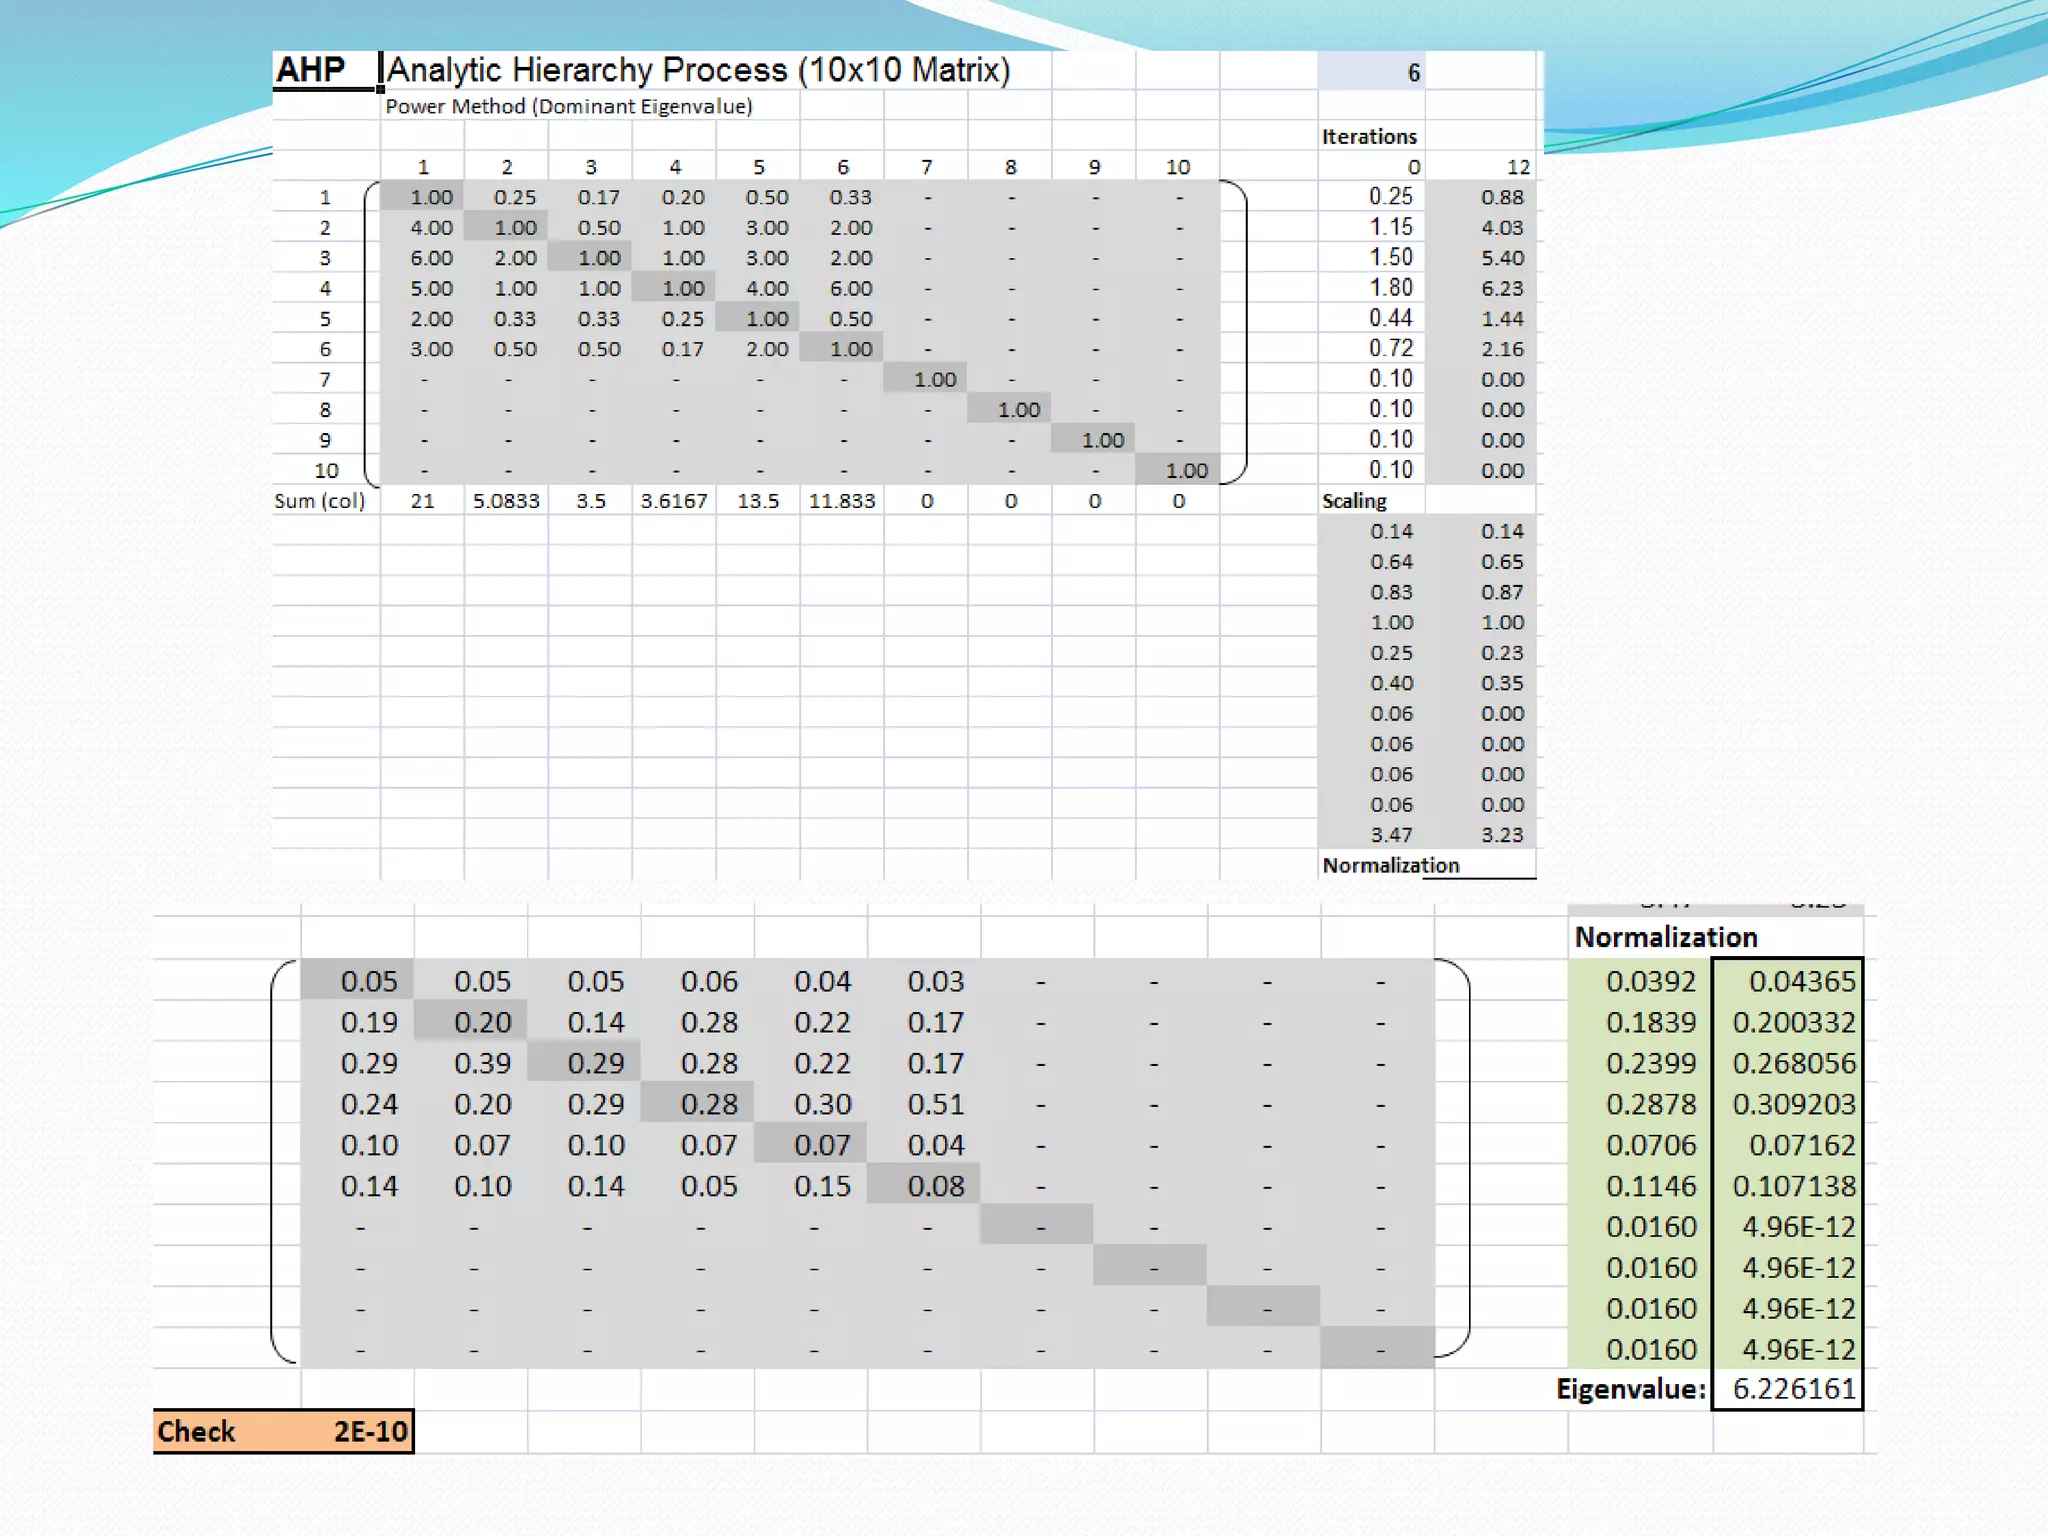
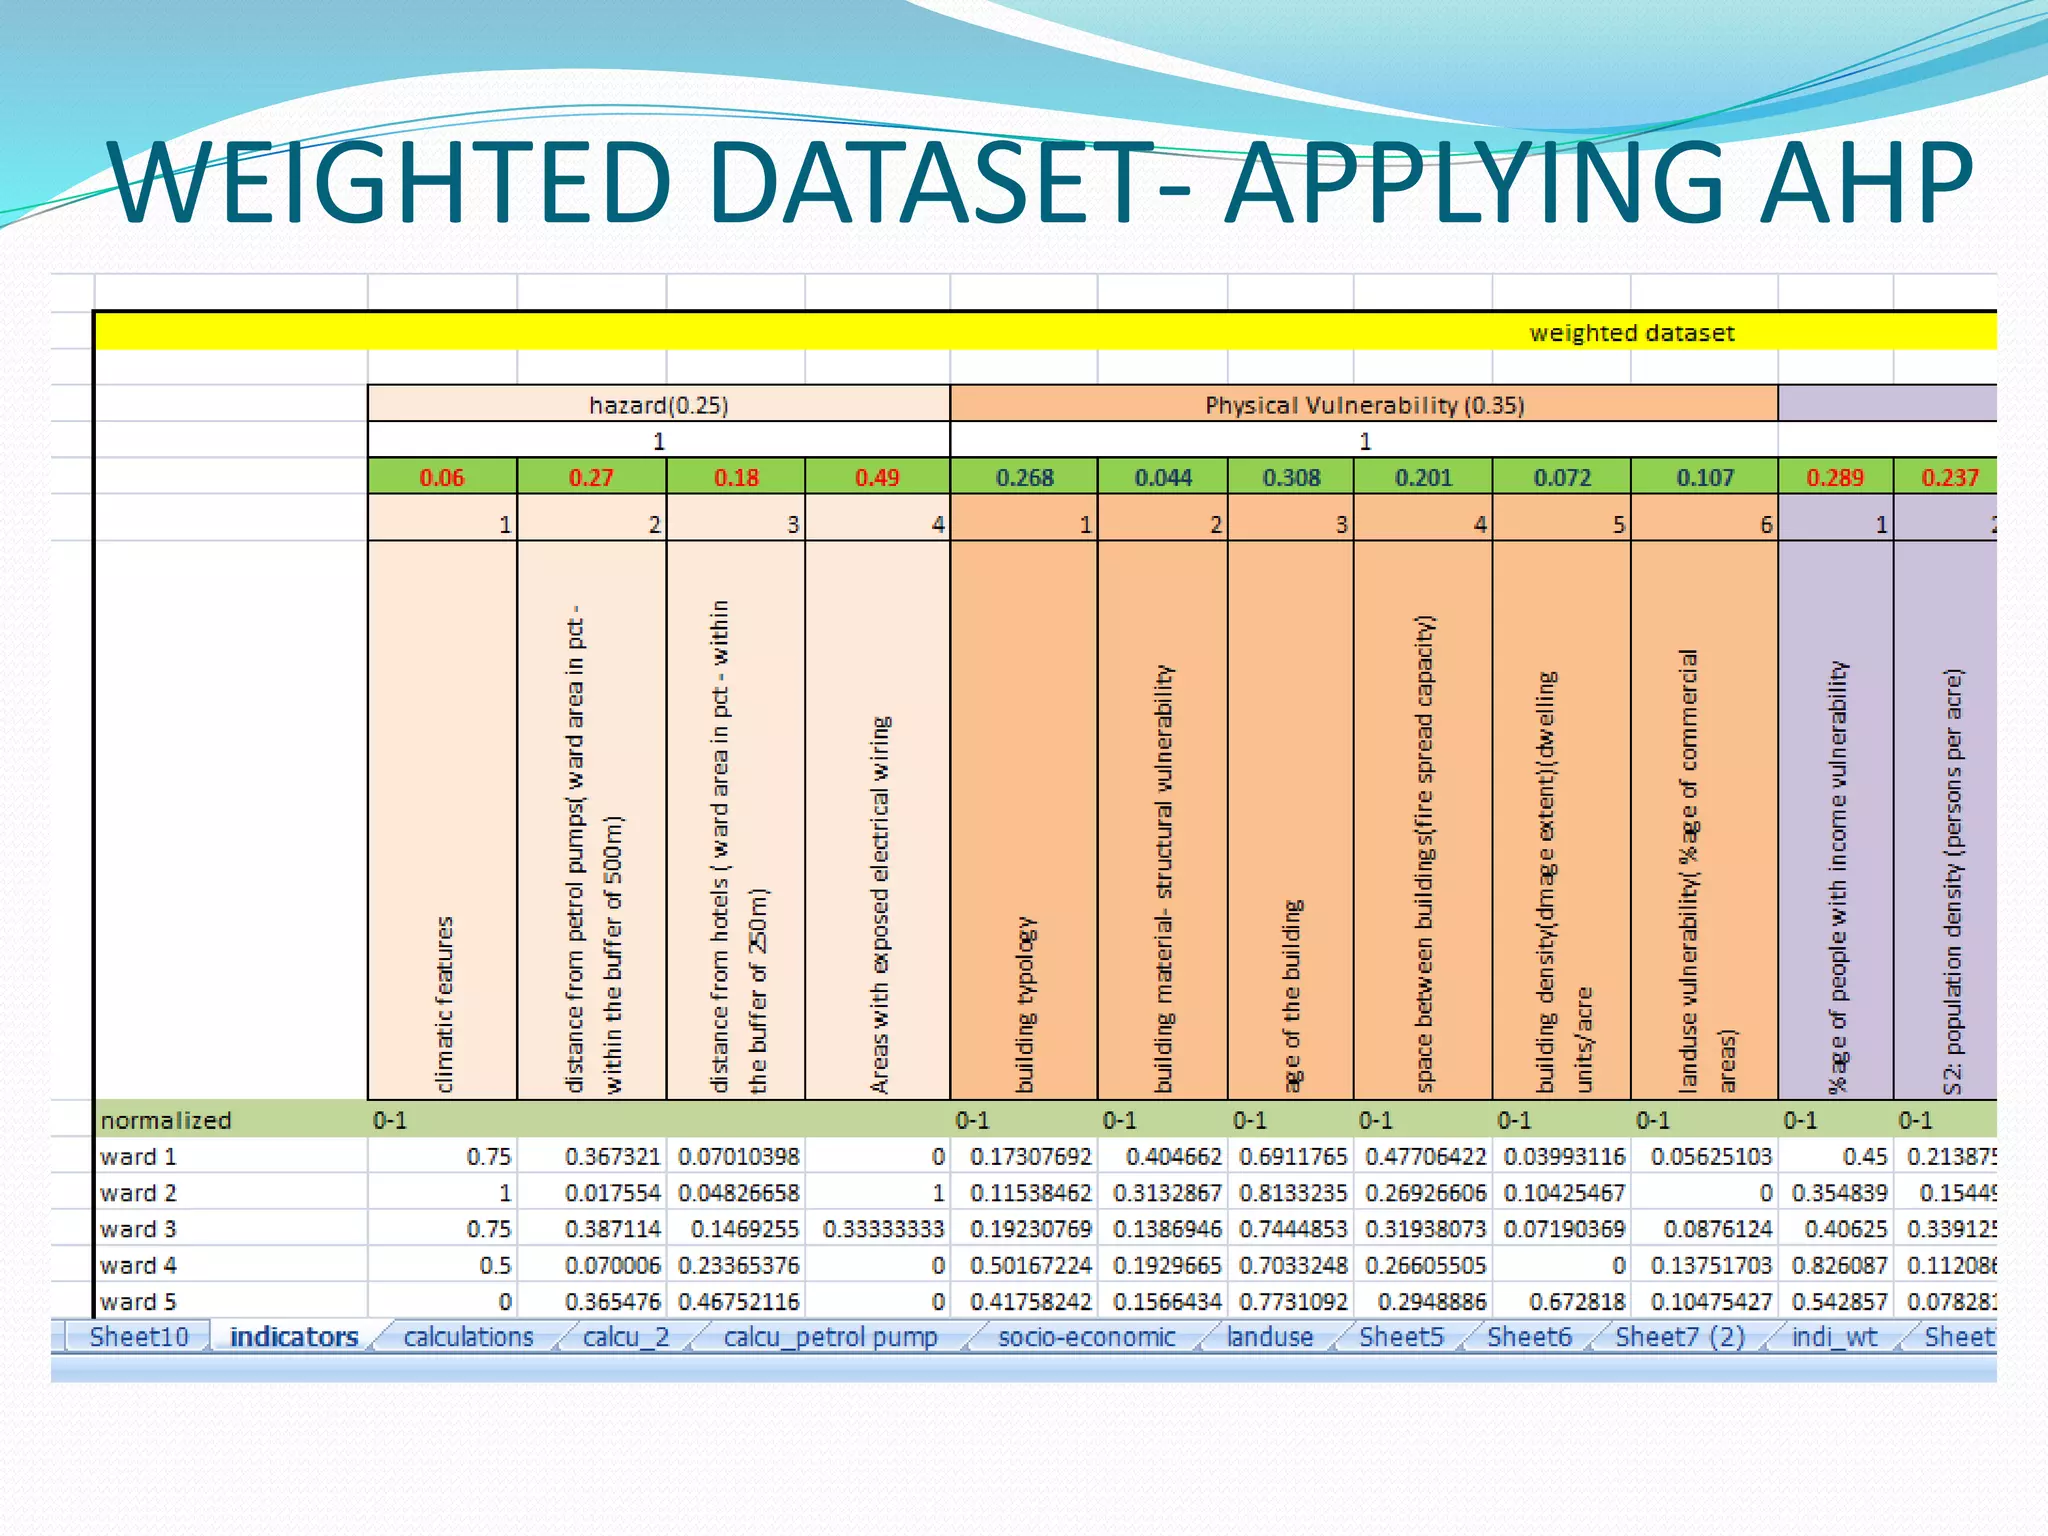
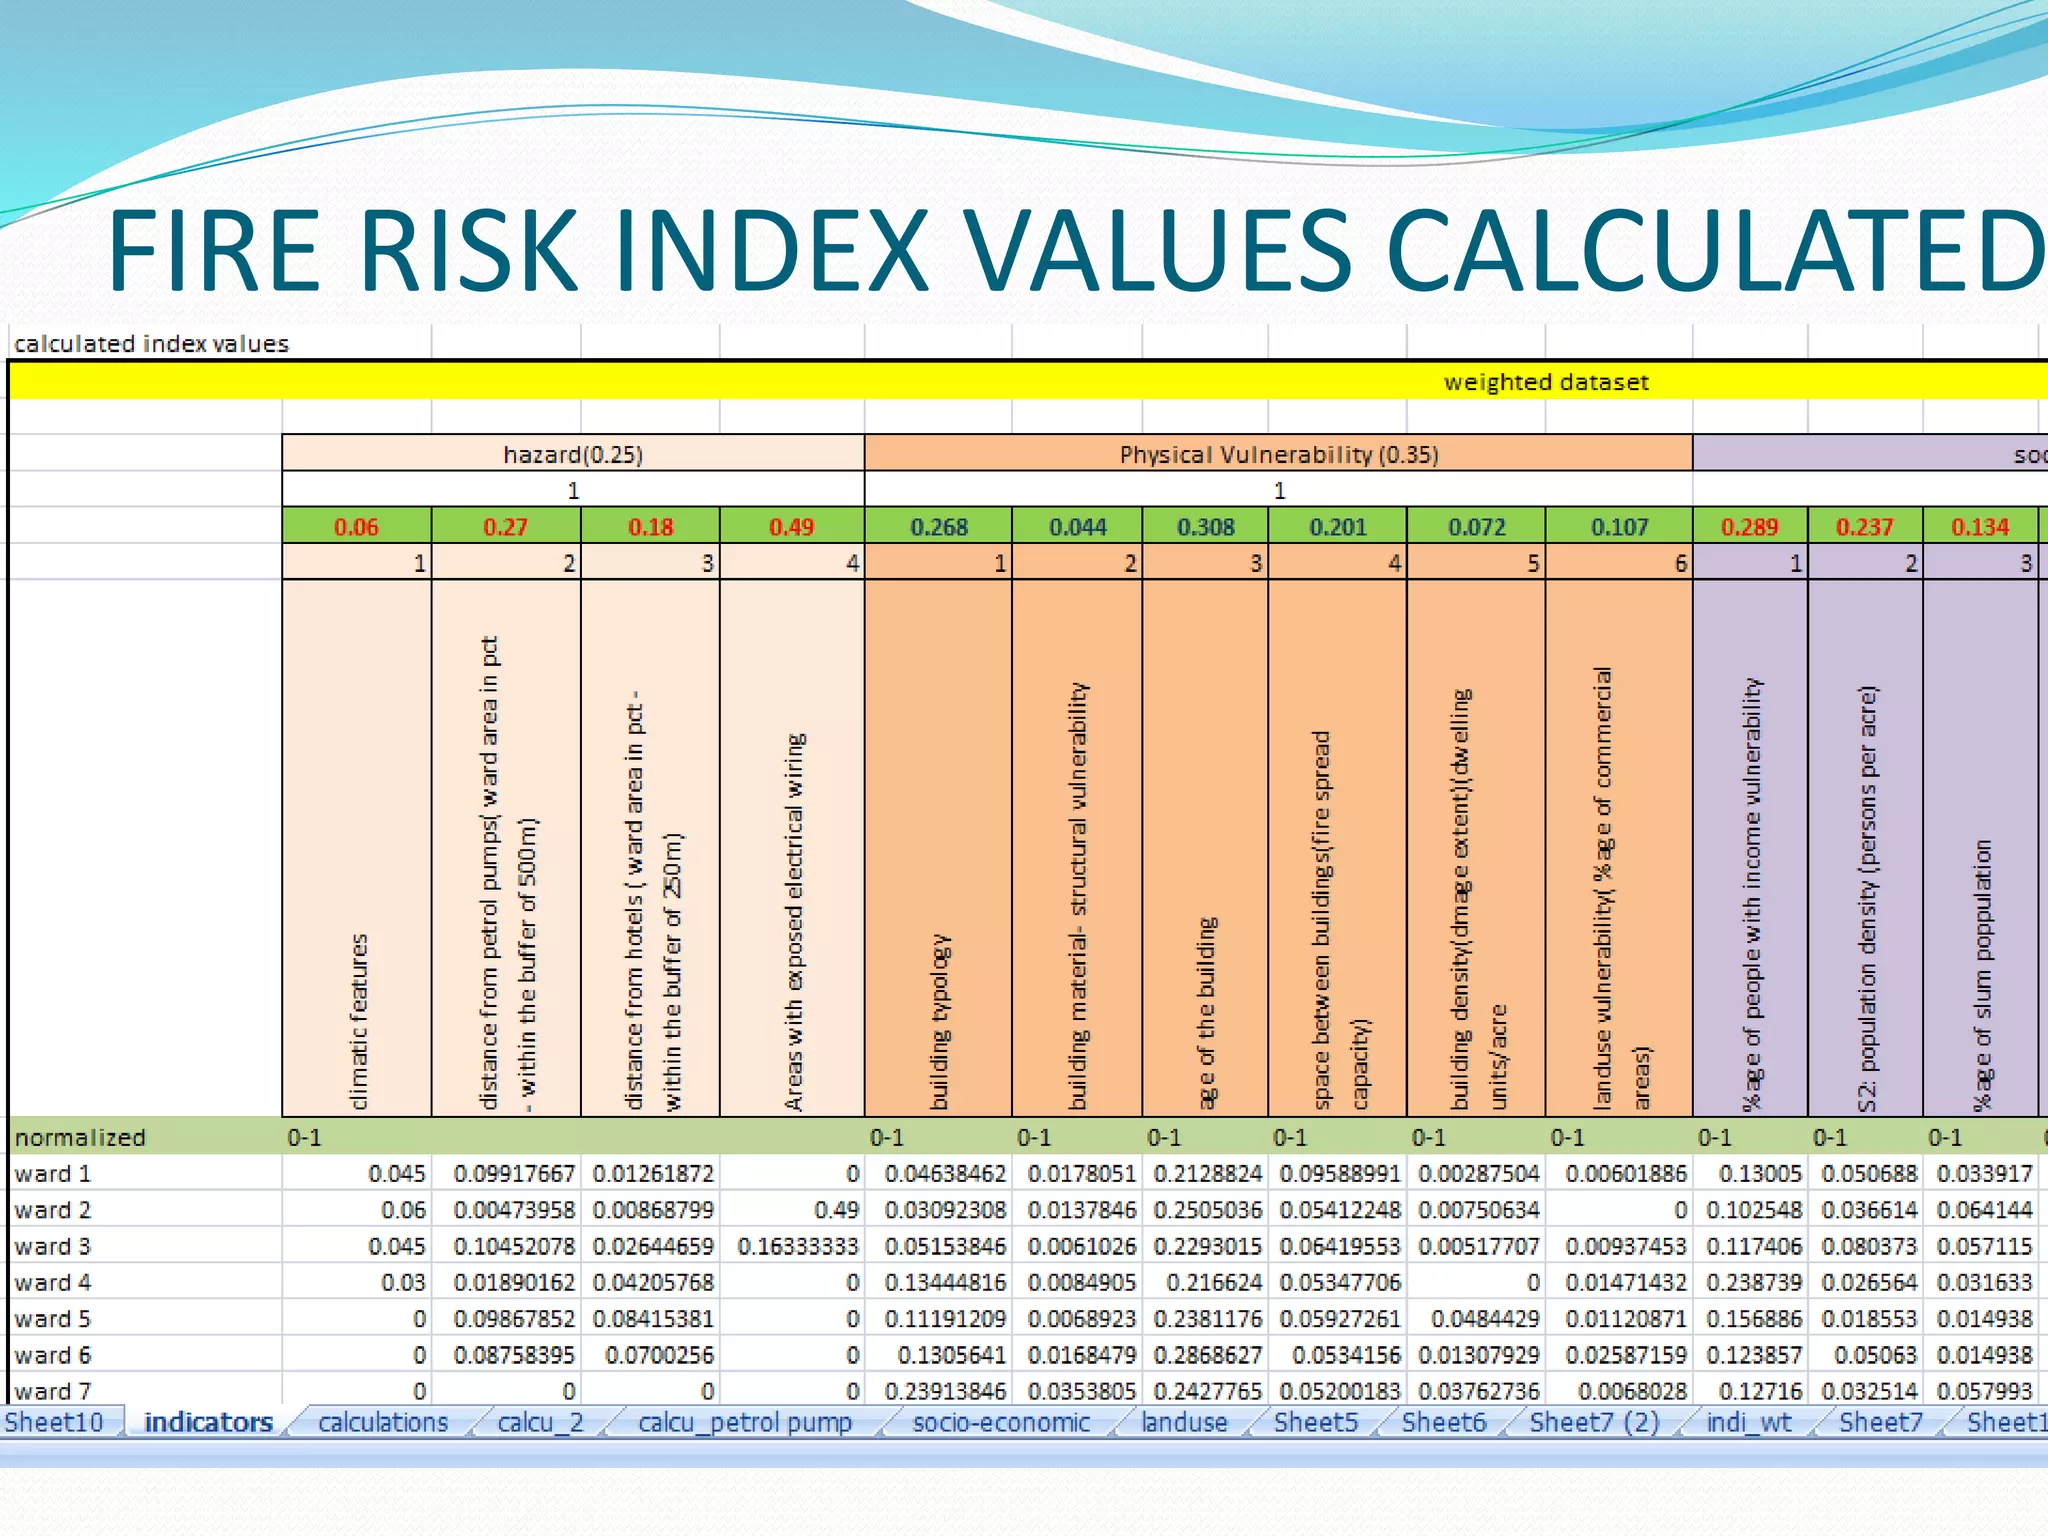
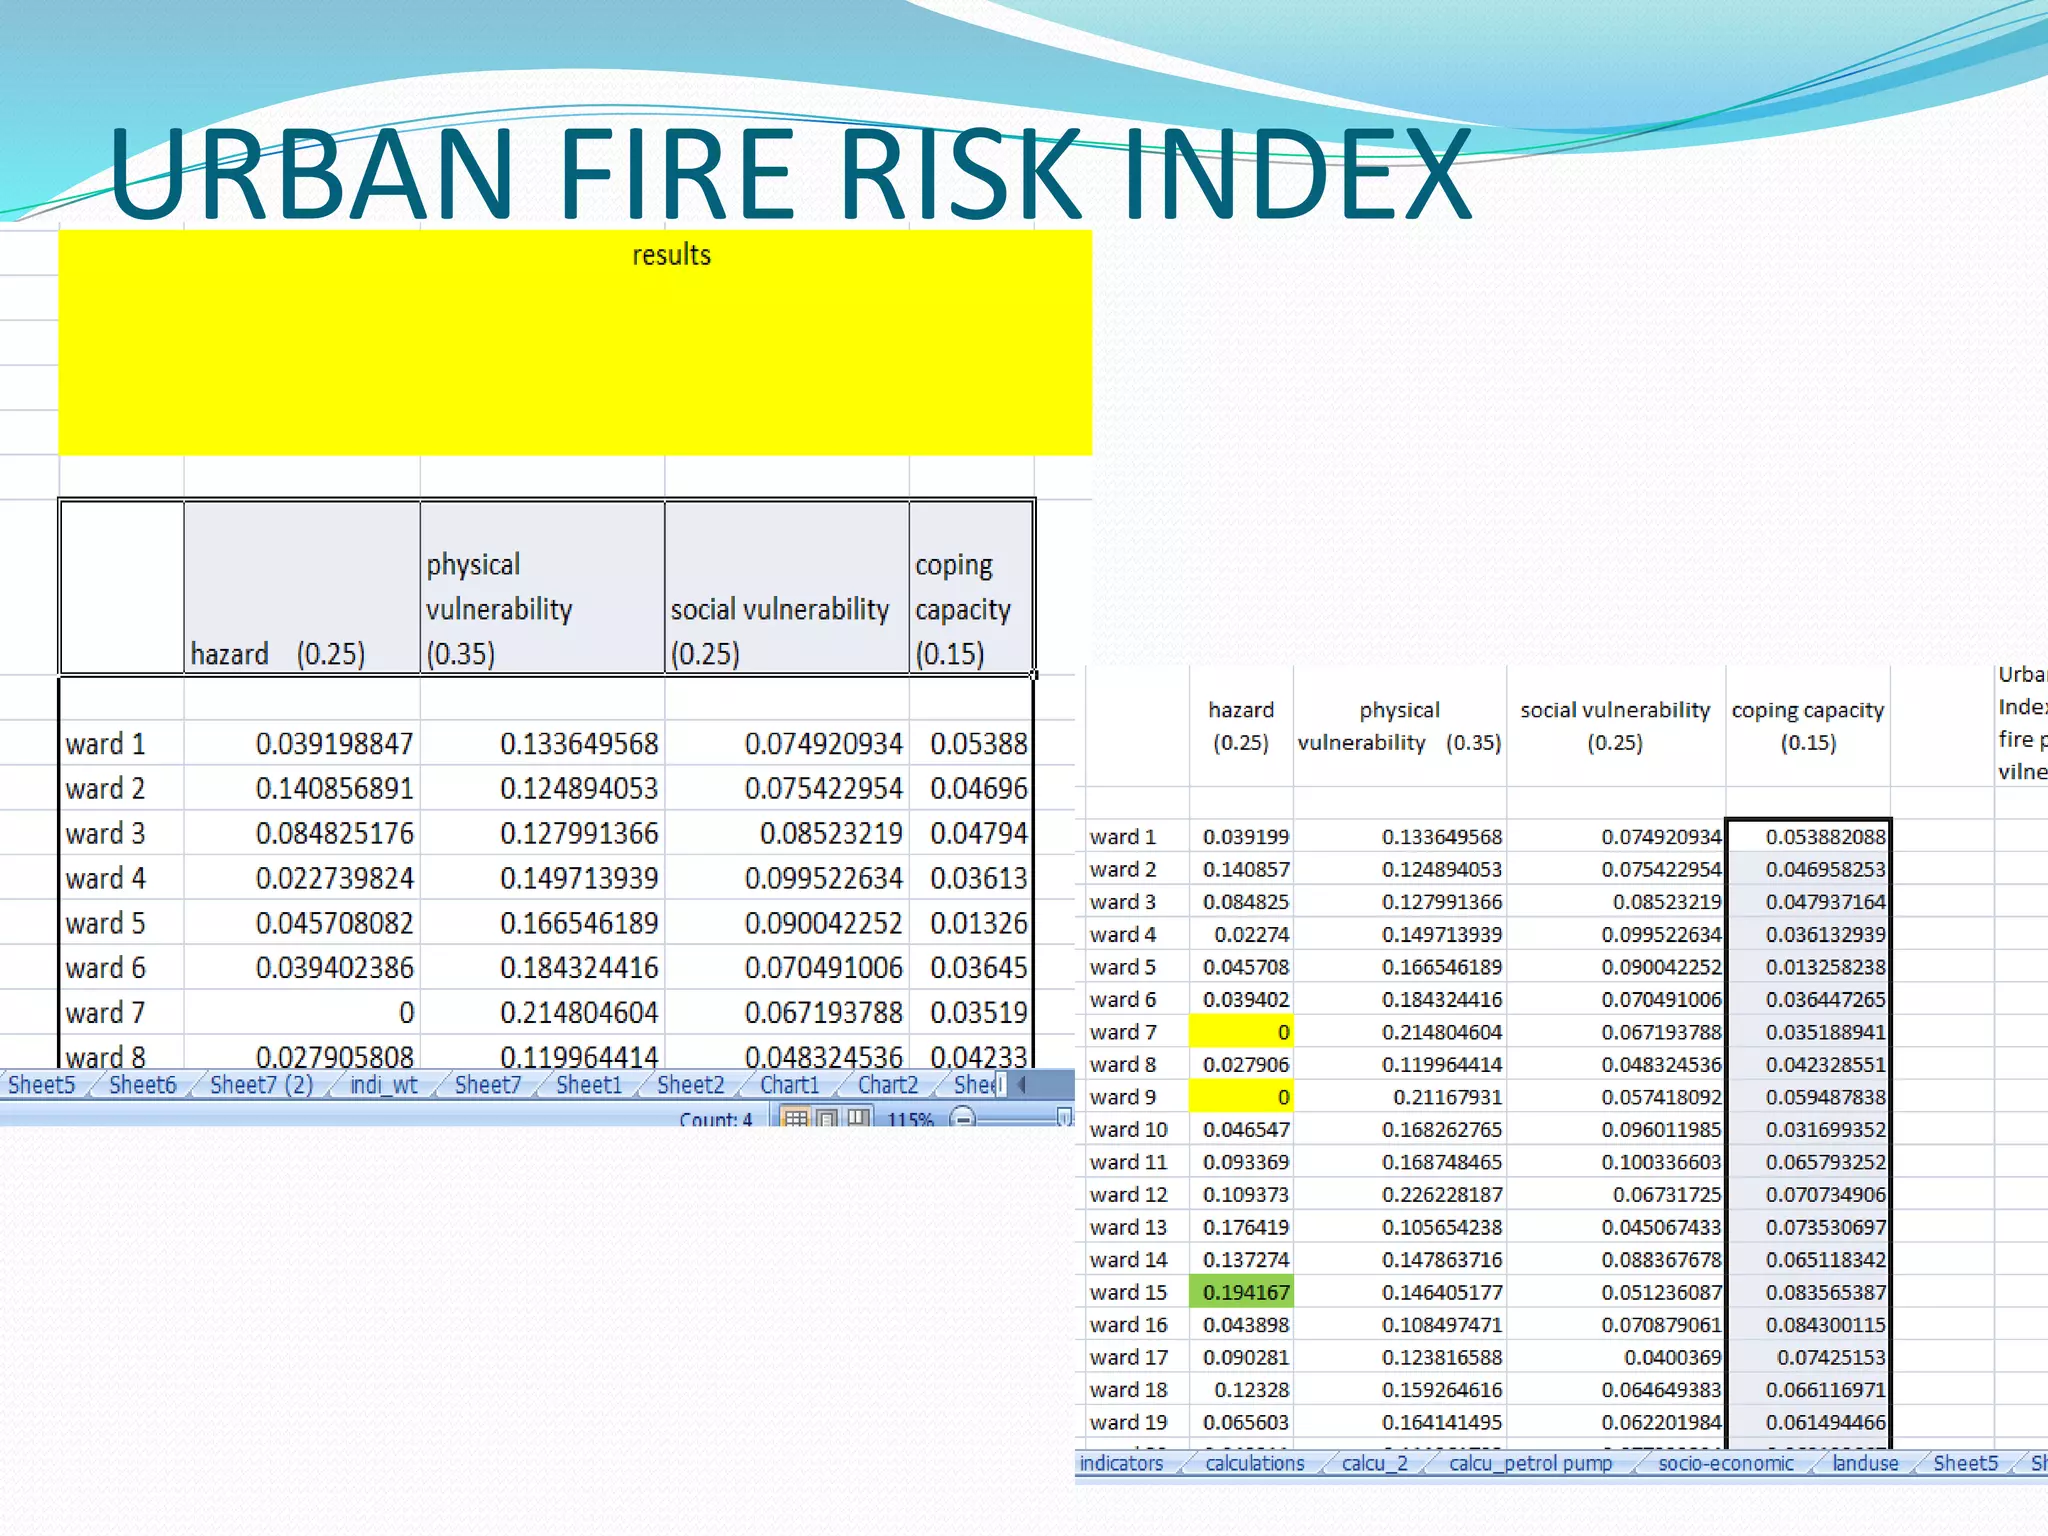
BY:
Neha Bansal
Ph.D. Scholar
I.I.T Roorkee
What is AHP
1. The Analytic Hierarchy Process (AHP)
is a multi-criteria decision-making
approach and was introduced by Saaty
(1977 and 1994).
2. The AHP is a decision support tool
which can be used to solve complex
decision problems.
3. It uses a multi-level hierarchical
structure of objectives, criteria,
subcriteria, and alternatives.
4. The pertinent data are derived by using
a set of pairwise comparisons.
5. These comparisons are used to obtain the weights of importance of the
decision criteria, and the relative performance measures of the alternatives
in terms of each individual decision criterion.
6. If the comparisons are not perfectly consistent, then it provides a
mechanism for improving consistency.
About the ahp
1
METHOD ?
METHOD ?
method
SCALE OF RELATIVE IMPORTANCE
3x3 Matrices Multiplication Formula
source: http://ncalculators.com/matrix/3x3-matrix-multiplication-calculator.htm
SQUARING THE MATRIX
ITERATIONS..TO ACHIEVE CONSISTENCY
Consistency Check
Step - Synthesization
Consistency Check
Normalized values
Consistency Check
Consistency Check
Consistency Check
Consistency Check
Cartosat-II DEM
Digital Elevation
Model
Multi Criteria Decision
Analysis
AHP (Fuzzy logic)
Fire hazard Zone Map
Distance from fire stations
(Buffer Analysis)
Building density
(categorization & weighted analysis)
Proximity to roads
(Buffer Analysis)
Spacing between buildings
(weighted analysis)
Landuse map
(Weighted analysis)
Petrol pumps and Gas
filling Stations map
Hotels & dumping
yard map
Areas with exposed/
poor electrical wiring
map
Fire hazard index
Structural vulnerability-
(BM- roof & wall material)
Weighted Analysis
Age of the buildings map
(weighted analysis)
SOI topo-
sheet
Dehradun
Master Plan
2005-2025
Dehradun guide
map
Census of India 2001
(Ward Level )
Secondary Data
Sources
Primary Survey
Buffer Analysis in
ARC-GIS/ ward level
data analysis
Socio-economic
vulnerability
Elevation map
Aspect Map
Slope map
Physical vulnerability index
Class of building map
(weighted analysis)
Historical Data
(Fire Accidents in 10
yrs)
Risk Profile of study
Area
URBAN FIRE RISK ASSESSMENT
Risk = Fn (Hazard,
Vulnerability)
Urban Fire Risk Map
Urban Fire Hazard Urban Fire Vulnerability
Tools and techniques
A
T
T
R
I
B
U
T
E
S
A
T
T
R
I
B
U
T
E
S
Primary Data
Sources
Vulnerability
index
Urban Fire Risk Index
Proximity top open
spaces
(weighted analysis)
Coping capacity Index
URBN FIRE RISK
ASSESSMENT
Urban Fire
Hazard
URBAN FIRE
Physical
VULNERABILITY
URBAN FIRE
SOCIAL
VULNERABILITY
URBAN FIRE
COPING
CAPACITY
URBAN FIRE RISK ASSESSMENT
How AHP is used in URM
hazard(0.25) Physical Vulnerability (0.35) social vulnerability(0.25) coping capacity(0.15)
1 1 1 1
0.06 0.27 0.18 0.49 0.268 0.044 0.308 0.201 0.072 0.107 0.289 0.237 0.134 0.114 0.106 0.084 0.036 0.367 0.476 0.099 0.058
1 2 3 4 1 2 3 4 5 6 1 2 3 4 5 6 7 1 2 3 4
climatic
features
distance
from
petrol
pumps(
ward
area
in
pct
-
within
the
buffer
of
500m)
distance
from
hotels
(
ward
area
in
pct
-
within
the
buffer
of
250m)
Areas
with
exposed
electrical
wiring
building
typology
building
material-
structural
vulnerability
age
of
the
building
space
between
buildings(fire
spread
capacity)
building
density(dmage
extent)(dwelling
units/acre
landuse
vulnerability(
%age
of
commercial
areas)
%age
of
people
with
income
vulnerability
population
density
(persons
per
acre)
%age
of
slum
poppulation
%age
of
children
below
6
yrs
%age
of
people
above
65
yrs
dependency
ratio
%
of
population
in
SC/ST
distance
from
fire
station(pct
of
ward
coverd
by
fire
station
services
distance
from
road(road
acess)(%age
area
of
ward
not
covered
by
road
acessibility)
vegetation
density(prevents
fire
spread,
helps
in
rescue)
%age
of
illeterates
Urban Fire Risk Assessment- Components Indicators Weights
Urban Fire Hazard(0.25)
H1: climatic features 0.06
H2: distance from petrol pumps( ward area in pct - within the buffer of
500m) 0.27
H3: distance from hotels ( ward area in pct - within the buffer of 250m)
0.18
H4: Areas with exposed electrical wiring
0.49
Urban Fire Physical Vulnerability (0.35)
P1: building typology 0.268
P2: building material- structural vulnerability
0.044
P3: age of the building 0.308
P4: space between buildings(fire spread capacity)
0.201
P6: building density(dmage extent)(dwelling units/acre
0.072
P7: landuse vulnerability( %age of commercial areas)
0.107
Urban Fire social vulnerability(0.25)
S1: %age of people with income vulnerability
0.289
S2: population density (persons per acre)
0.237
S3: %age of slum poppulation 0.134
S4: %age of children below 6 yrs 0.114
S5: %age of people above 65 yrs 0.106
S6: dependency ratio 0.084
S7: % of population in SC/ST 0.036
Urban Fire Coping Capacity(0.15)
C1: distance from fire station(pct of ward coverd by fire station services
0.367
C2: distance from road(road acess)(%age area of ward not covered by road
acessibility)
0.476
C3: vegetation density(prevents fire spread, helps in rescue)
0.099
C4: %age of illeterates 0.058
FIRE RISK INDICATORS
NORMALIZED DATASET
APPLYING AHP FOR RANKING
WEIGHTED DATASET- APPLYING AHP
FIRE RISK INDEX VALUES CALCULATED
URBAN FIRE RISK INDEX
Analytical Hierarchy Process (Decision Making)-Application In Urban Risk Assessment

Analytical Hierarchy Process (Decision Making)- Application In Urban Risk Assessment

  • 1.
  • 3.
    What is AHP 1.The Analytic Hierarchy Process (AHP) is a multi-criteria decision-making approach and was introduced by Saaty (1977 and 1994). 2. The AHP is a decision support tool which can be used to solve complex decision problems. 3. It uses a multi-level hierarchical structure of objectives, criteria, subcriteria, and alternatives. 4. The pertinent data are derived by using a set of pairwise comparisons. 5. These comparisons are used to obtain the weights of importance of the decision criteria, and the relative performance measures of the alternatives in terms of each individual decision criterion. 6. If the comparisons are not perfectly consistent, then it provides a mechanism for improving consistency.
  • 4.
  • 5.
  • 7.
  • 8.
  • 9.
  • 14.
    3x3 Matrices MultiplicationFormula source: http://ncalculators.com/matrix/3x3-matrix-multiplication-calculator.htm SQUARING THE MATRIX
  • 16.
  • 28.
  • 29.
  • 30.
  • 31.
  • 32.
  • 33.
  • 34.
  • 36.
    Cartosat-II DEM Digital Elevation Model MultiCriteria Decision Analysis AHP (Fuzzy logic) Fire hazard Zone Map Distance from fire stations (Buffer Analysis) Building density (categorization & weighted analysis) Proximity to roads (Buffer Analysis) Spacing between buildings (weighted analysis) Landuse map (Weighted analysis) Petrol pumps and Gas filling Stations map Hotels & dumping yard map Areas with exposed/ poor electrical wiring map Fire hazard index Structural vulnerability- (BM- roof & wall material) Weighted Analysis Age of the buildings map (weighted analysis) SOI topo- sheet Dehradun Master Plan 2005-2025 Dehradun guide map Census of India 2001 (Ward Level ) Secondary Data Sources Primary Survey Buffer Analysis in ARC-GIS/ ward level data analysis Socio-economic vulnerability Elevation map Aspect Map Slope map Physical vulnerability index Class of building map (weighted analysis) Historical Data (Fire Accidents in 10 yrs) Risk Profile of study Area URBAN FIRE RISK ASSESSMENT Risk = Fn (Hazard, Vulnerability) Urban Fire Risk Map Urban Fire Hazard Urban Fire Vulnerability Tools and techniques A T T R I B U T E S A T T R I B U T E S Primary Data Sources Vulnerability index Urban Fire Risk Index Proximity top open spaces (weighted analysis) Coping capacity Index
  • 37.
    URBN FIRE RISK ASSESSMENT UrbanFire Hazard URBAN FIRE Physical VULNERABILITY URBAN FIRE SOCIAL VULNERABILITY URBAN FIRE COPING CAPACITY URBAN FIRE RISK ASSESSMENT
  • 38.
    How AHP isused in URM hazard(0.25) Physical Vulnerability (0.35) social vulnerability(0.25) coping capacity(0.15) 1 1 1 1 0.06 0.27 0.18 0.49 0.268 0.044 0.308 0.201 0.072 0.107 0.289 0.237 0.134 0.114 0.106 0.084 0.036 0.367 0.476 0.099 0.058 1 2 3 4 1 2 3 4 5 6 1 2 3 4 5 6 7 1 2 3 4 climatic features distance from petrol pumps( ward area in pct - within the buffer of 500m) distance from hotels ( ward area in pct - within the buffer of 250m) Areas with exposed electrical wiring building typology building material- structural vulnerability age of the building space between buildings(fire spread capacity) building density(dmage extent)(dwelling units/acre landuse vulnerability( %age of commercial areas) %age of people with income vulnerability population density (persons per acre) %age of slum poppulation %age of children below 6 yrs %age of people above 65 yrs dependency ratio % of population in SC/ST distance from fire station(pct of ward coverd by fire station services distance from road(road acess)(%age area of ward not covered by road acessibility) vegetation density(prevents fire spread, helps in rescue) %age of illeterates
  • 39.
    Urban Fire RiskAssessment- Components Indicators Weights Urban Fire Hazard(0.25) H1: climatic features 0.06 H2: distance from petrol pumps( ward area in pct - within the buffer of 500m) 0.27 H3: distance from hotels ( ward area in pct - within the buffer of 250m) 0.18 H4: Areas with exposed electrical wiring 0.49 Urban Fire Physical Vulnerability (0.35) P1: building typology 0.268 P2: building material- structural vulnerability 0.044 P3: age of the building 0.308 P4: space between buildings(fire spread capacity) 0.201 P6: building density(dmage extent)(dwelling units/acre 0.072 P7: landuse vulnerability( %age of commercial areas) 0.107 Urban Fire social vulnerability(0.25) S1: %age of people with income vulnerability 0.289 S2: population density (persons per acre) 0.237 S3: %age of slum poppulation 0.134 S4: %age of children below 6 yrs 0.114 S5: %age of people above 65 yrs 0.106 S6: dependency ratio 0.084 S7: % of population in SC/ST 0.036 Urban Fire Coping Capacity(0.15) C1: distance from fire station(pct of ward coverd by fire station services 0.367 C2: distance from road(road acess)(%age area of ward not covered by road acessibility) 0.476 C3: vegetation density(prevents fire spread, helps in rescue) 0.099 C4: %age of illeterates 0.058
  • 40.
  • 41.
  • 42.
  • 44.
  • 45.
    FIRE RISK INDEXVALUES CALCULATED
  • 46.