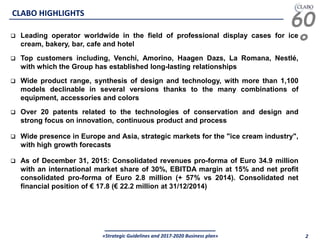
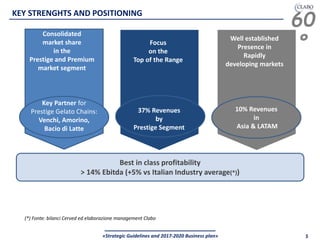
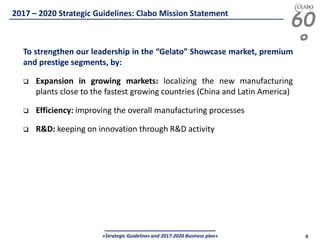
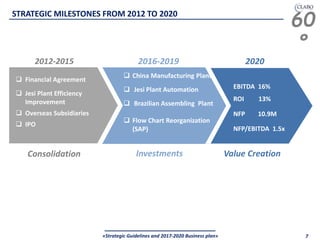
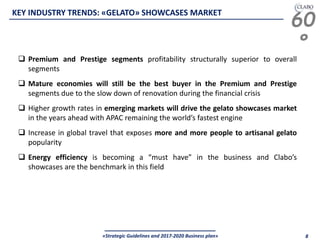
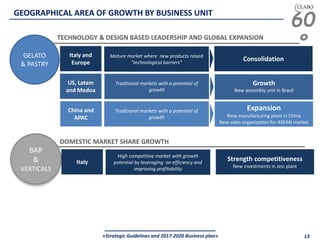
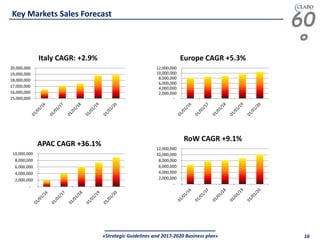
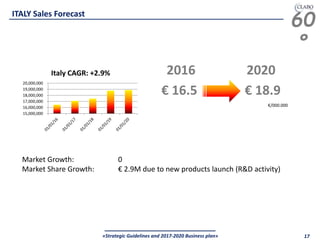
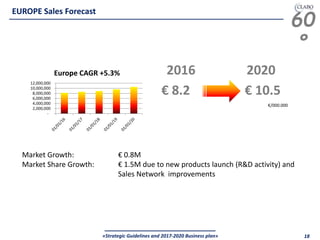
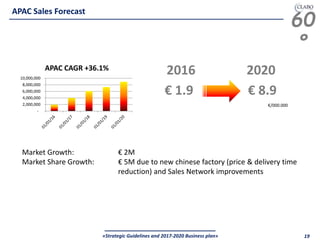
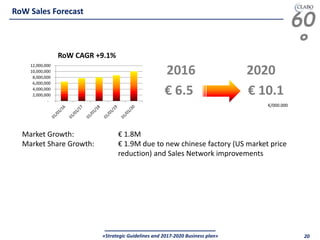
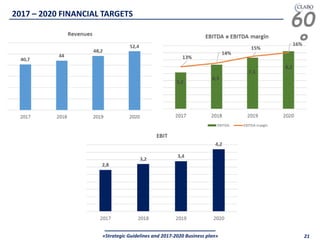
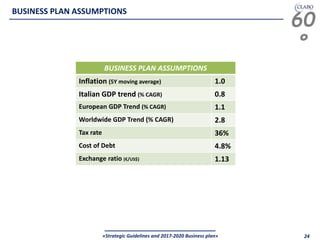
60
°
«Strategic Guidelines and 2017-2020 Business plan» 1
Strategic Guidelines and 2017-2020 Business Plan
Milano, 16 November 2016 @Palazzo Mezzanotte
60
°
«Strategic Guidelines and 2017-2020 Business plan» 2
 Leading operator worldwide in the field of professional display cases for ice
cream, bakery, bar, cafe and hotel
 Top customers including, Venchi, Amorino, Haagen Dazs, La Romana, Nestlé,
with which the Group has established long-lasting relationships
 Wide product range, synthesis of design and technology, with more than 1,100
models declinable in several versions thanks to the many combinations of
equipment, accessories and colors
 Over 20 patents related to the technologies of conservation and design and
strong focus on innovation, continuous product and process
 Wide presence in Europe and Asia, strategic markets for the "ice cream industry",
with high growth forecasts
 As of December 31, 2015: Consolidated revenues pro-forma of Euro 34.9 million
with an international market share of 30%, EBITDA margin at 15% and net profit
consolidated pro-forma of Euro 2.8 million (+ 57% vs 2014). Consolidated net
financial position of € 17.8 (€ 22.2 million at 31/12/2014)
CLABO HIGHLIGHTS
60
°
«Strategic Guidelines and 2017-2020 Business plan» 3
CLABO S.P.A.
100% 100%100%
Cla.Bo.Fin. Srl
71%
29%
MARKET
CLABO Usa ORION Int.Trad. CLABO Brasil CLABO
Deutschland
CLABO HK
100% 100%
CORPORATE STRUCTURE
60
°
«Strategic Guidelines and 2017-2020 Business plan» 4
WIDE AND CONSOLIDATED PRESENCE IN THE «ICE
CREAM WINDOW» SEGMENT
TRADITIONAL BRAND ACQUIRED IN 2004. HIGH
POSITIONING DISPLAY FOR PROFESSIONALS
ACQUIRED IN 2002 AND SPECIALIZED IN
FURNITURE FOR PUB AND COFFEE SHOPS
OUR BRANDS
60
°
«Strategic Guidelines and 2017-2020 Business plan» 5
Best in class profitability
> 14% Ebitda (+5% vs Italian Industry average(*))
KEY STRENGHTS AND POSITIONING
Key Partner for
Prestige Gelato Chains:
Venchi, Amorino,
Bacio di Latte
37% Revenues by
Prestige Segment
10% Revenues
in
Asia & LATAM
Consolidated
market share
in the
Prestige and Premium
market segment
Focus
on the
Top of the Range
Well established
Presence in
Rapidly
developing markets
37% Revenues
by
Prestige Segment
(*) Fonte: bilanci Cerved ed elaborazione management Clabo
60
°
«Strategic Guidelines and 2017-2020 Business plan» 6
2017 – 2020 Strategic Guidelines: Clabo Mission Statement
To strengthen our leadership in the “Gelato” Showcase market, premium
and prestige segments, by:
 Expansion in growing markets: localizing the new manufacturing
plants close to the fastest growing countries (China and Latin America)
 Efficiency: improving the overall manufacturing processes
 R&D: keeping on innovation through R&D activity
60
°
«Strategic Guidelines and 2017-2020 Business plan» 7
STRATEGIC MILESTONES FROM 2012 TO 2020
2012-2015 2016-2019 2020
Consolidation Investments Value Creation
 China Manufacturing Plant
 Jesi Plant Automation
 Brazilian Assembling Plant
 Flow Chart Reorganization
(SAP)
EBITDA 16%
ROI 13%
NFP 10.9M
NFP/EBITDA 1.5x
 Financial Agreement
 Jesi Plant Efficiency
Improvement
 Overseas Subsidiaries
 IPO
60
°
«Strategic Guidelines and 2017-2020 Business plan» 8
 Premium and Prestige segments profitability structurally superior to overall
segments
 Mature economies will still be the best buyer in the Premium and Prestige
segments due to the slow down of renovation during the financial crisis
 Higher growth rates in emerging markets will drive the gelato showcases market
in the years ahead with APAC remaining the world’s fastest engine
 Increase in global travel that exposes more and more people to artisanal gelato
popularity
 Energy efficiency is becoming a “must have” in the business and Clabo’s
showcases are the benchmark in this field
KEY INDUSTRY TRENDS: «GELATO» SHOWCASES MARKET
60
°
«Strategic Guidelines and 2017-2020 Business plan» 9
Gelato market is currently worth $40 billion and it is expected to grow at 4% (CAGR ‘15-’18)
Highest Market Value Countries (2014) Highest Growth Rate Countries (2015 – 2018))
Source: Management estimate based on PWC research 2016
«GELATO» MARKET
60
°
«Strategic Guidelines and 2017-2020 Business plan» 10
Source: Clabo analysis based on PWC and AT Kearney researches
Gelato Showcases Market (Prestige & Premium segments)
Market volumes per sales area and growth trends
Sales Area Market Volume (Units per Yyear) Growth Rate
Italy
2,500
3,700
Rest of Europe
NAFTA 1,200
LATAM 800
APAC 3,500
MEDOA 500
RoW 800
TOTAL 13,000
Clabo Market Share
>30%
>30%
>30%
>30%
10%<
>20%
10%<
KEY MARKETS OVERVIEW
60
°
«Strategic Guidelines and 2017-2020 Business plan» 11
Gelato Showcases Market
Market segments description
Source: PWC research 2016
* Dealer price
Entry Level
 Price range € 500 - € 1,500*
 Refrigeration: gravity
 Type of use: Scoop Ice Cream
Industry
 Price range € 1,500 - € 3,500*
 Refrigeration: gravity
 Type of use: Scoop Ice Cream
Premium
 Price range € 3,500 - € 7,500*
 Refrigeration: air forced
 Type of use: Artisanal Gelato
Prestige
 Price range € 7,500 - € 15,000*
 Refrigeration: air forced
 Type of use: Artisanal Gelato
Gelato Showcases Market
(Prestige & Premium segments)
Market segments and players
PLAYERS
PRESTIGE PREMIUM INDUSTRY
ENTRY
LEVEL
IARP
ISA
Mondial
IFI
Easy Best
Sevel
Others
SEGMENTS
~ 13,000/15,000
units per year
200,000
units per year
COMPETITIVE LANDSCAPE
60
°
«Strategic Guidelines and 2017-2020 Business plan» 12
Gelato
Pastry
Bar
Verticals
TOTAL
~16%
~18%
~14%
~12%
~12%
~7%
~5%
~11%
~16%
~14%
Ebitda % 2020
Ebitda % 2015
71%
10%
11%
1% 7% Gelato
Pastry
Bar
Verticals
Others
EBITDA CONTRIBUTION
Target 2020
2016-2020 Clabo Value Creation
PROFITABILITY
EBITDA Margin % by product
60
°
«Strategic Guidelines and 2017-2020 Business plan» 13
TECHNOLOGY & DESIGN BASED LEADERSHIP AND GLOBAL EXPANSION
DOMESTIC MARKET SHARE GROWTH
GEOGRAPHICAL AREA OF GROWTH BY BUSINESS UNIT
GELATO
& PASTRY
BAR
&
VERTICALS
Mature market where new products raised
“technological barriers”
Consolidation
Growth
New assembly unit in Brasil
Italy and
Europe
Traditional markets with a potential of
growth
US, Latam
and Medoa
Expansion
New manufacturing plant in China
New sales organization for ASEAN market
Traditional markets with a potential of
growth
China and
APAC
High competitive market with growth
potential by leveraging on efficiency and
improving profitability
Strength competitiveness
New investments in Jesi plant
Italy
60
°
«Strategic Guidelines and 2017-2020 Business plan» 14
24M
3.5M Dividends
7 M
NFP Improvement
15.7M
Investment
1.2M 1M
ITALY
REST OF
EUROPE
NAFTA LATAM APAC
GELATO
PASTRY
VERTICALS
BAR
14
2016 -2020 RESOURCE ALLOCATION
Simest Capital
Contribution
for China
project
L.181/89
Contribution
for Jesi Plant
Net Cash Flow
before
Capex and
Dividends
Tot.
26,2M
60
°
«Strategic Guidelines and 2017-2020 Business plan» 15
Investments Break Down
15.7
5
R&D: >15 new products to be developed
and launched. I.O.T. project and nano
technologies to be applied
6.4*
Jesi Plant: new automated processes and
SAP integration.
4.3
New manufacturing plants to serve Asian
and American markets
Total Investments
2016 -2020
Investment Breakdown
per project
2016-2020
2016-2018
2016-2017
Timing per project
*Clabo will be financed by Invitalia, an Italian government institution, for the
50% of the 6,4M investments at 0% interest rate. Clabo will also benefit of a
15% subsidy (0,96M)
60
°
«Strategic Guidelines and 2017-2020 Business plan» 16
Key Markets Sales Forecast
15,000,000
16,000,000
17,000,000
18,000,000
19,000,000
20,000,000
Italy CAGR: +2.9%
-
2,000,000
4,000,000
6,000,000
8,000,000
10,000,000
12,000,000
Europe CAGR +5.3%
-
2,000,000
4,000,000
6,000,000
8,000,000
10,000,000
APAC CAGR +36.1%
-
2,000,000
4,000,000
6,000,000
8,000,000
10,000,000
12,000,000
RoW CAGR +9.1%
60
°
«Strategic Guidelines and 2017-2020 Business plan» 17
ITALY Sales Forecast
15,000,000
16,000,000
17,000,000
18,000,000
19,000,000
20,000,000
Italy CAGR: +2.9% 2016 2020
€ 16.5 € 18.9
Market Growth: 0
Market Share Growth: € 2.9M due to new products launch (R&D activity)
€/000.000
60
°
«Strategic Guidelines and 2017-2020 Business plan» 18
EUROPE Sales Forecast
2016 2020
€ 8.2 € 10.5
Market Growth: € 0.8M
Market Share Growth: € 1.5M due to new products launch (R&D activity) and
Sales Network improvements
-
2,000,000
4,000,000
6,000,000
8,000,000
10,000,000
12,000,000
Europe CAGR +5.3%
€/000.000
60
°
«Strategic Guidelines and 2017-2020 Business plan» 19
2016 2020
€ 1.9 € 8.9
Market Growth: € 2M
Market Share Growth: € 5M due to new chinese factory (price & delivery time
reduction) and Sales Network improvements
€/000.000
-
2,000,000
4,000,000
6,000,000
8,000,000
10,000,000
APAC CAGR +36.1%
APAC Sales Forecast
60
°
«Strategic Guidelines and 2017-2020 Business plan» 20
2016 2020
€ 6.5 € 10.1
Market Growth: € 1.8M
Market Share Growth: € 1.9M due to new chinese factory (US market price
reduction) and Sales Network improvements
€/000.000
-
2,000,000
4,000,000
6,000,000
8,000,000
10,000,000
12,000,000
RoW CAGR +9.1%
RoW Sales Forecast
60
°
«Strategic Guidelines and 2017-2020 Business plan» 21
2017 – 2020 FINANCIAL TARGETS
60
°
«Strategic Guidelines and 2017-2020 Business plan» 22
Conclusions
 Global leader in growing market with favourable underlying dynamics
 Leadership underpinned by superior R&D and technology and a strong
global brand
 Stable revenue based coming from replacement and service in Western
Europe
 Further profitability improvements from cost optimization in Italy
 Material value creation through the planned manufacturing presence in
China and Latam
60
°
«Strategic Guidelines and 2017-2020 Business plan» 23
Q&A
60
°
«Strategic Guidelines and 2017-2020 Business plan» 24
BUSINESS PLAN ASSUMPTIONS
Inflation (5Y moving average) 1.0
Italian GDP trend (% CAGR) 0.8
European GDP Trend (% CAGR) 1.1
Worldwide GDP Trend (% CAGR) 2.8
Tax rate 36%
Cost of Debt 4.8%
Exchange ratio (€/US$) 1.13
BUSINESS PLAN ASSUMPTIONS
60
°
«Strategic Guidelines and 2017-2020 Business plan» 25
DISCLAIMER
This presentation contains forward-looking statements regarding future events (which impact the
Clabo’s future results) that are based on current expectations, estimates and opinions of management.
These forward-looking statements are subject to risks, uncertainties and events that are
unpredictable and depend on circumstances that might change in future. As a result, any expectation on
Company results and estimates set out in this presentation may differ significantly depending on changes in the
unpredictable circumstances on which they are based.
Therefore, any forward -looking statement made by or on behalf of the Clabo refer on the date
they are made.
Clabo shall not undertake to update forward-looking statements to reflect any changes in the
Company’s expectations or in the events, conditions or circumstances on which any such statements are based.
Nevertheless, Clabo has a “profit warning policy” , in accordance with Italian laws, that shall notify
the market (under “price-sensitive” communication rules) regarding any “sensible change” that might occur in
Company expectations on future results.

Clabo: 2017-2020 Business Plan

  • 1.
    60 ° «Strategic Guidelines and2017-2020 Business plan» 1 Strategic Guidelines and 2017-2020 Business Plan Milano, 16 November 2016 @Palazzo Mezzanotte
  • 2.
    60 ° «Strategic Guidelines and2017-2020 Business plan» 2  Leading operator worldwide in the field of professional display cases for ice cream, bakery, bar, cafe and hotel  Top customers including, Venchi, Amorino, Haagen Dazs, La Romana, Nestlé, with which the Group has established long-lasting relationships  Wide product range, synthesis of design and technology, with more than 1,100 models declinable in several versions thanks to the many combinations of equipment, accessories and colors  Over 20 patents related to the technologies of conservation and design and strong focus on innovation, continuous product and process  Wide presence in Europe and Asia, strategic markets for the "ice cream industry", with high growth forecasts  As of December 31, 2015: Consolidated revenues pro-forma of Euro 34.9 million with an international market share of 30%, EBITDA margin at 15% and net profit consolidated pro-forma of Euro 2.8 million (+ 57% vs 2014). Consolidated net financial position of € 17.8 (€ 22.2 million at 31/12/2014) CLABO HIGHLIGHTS
  • 3.
    60 ° «Strategic Guidelines and2017-2020 Business plan» 3 CLABO S.P.A. 100% 100%100% Cla.Bo.Fin. Srl 71% 29% MARKET CLABO Usa ORION Int.Trad. CLABO Brasil CLABO Deutschland CLABO HK 100% 100% CORPORATE STRUCTURE
  • 4.
    60 ° «Strategic Guidelines and2017-2020 Business plan» 4 WIDE AND CONSOLIDATED PRESENCE IN THE «ICE CREAM WINDOW» SEGMENT TRADITIONAL BRAND ACQUIRED IN 2004. HIGH POSITIONING DISPLAY FOR PROFESSIONALS ACQUIRED IN 2002 AND SPECIALIZED IN FURNITURE FOR PUB AND COFFEE SHOPS OUR BRANDS
  • 5.
    60 ° «Strategic Guidelines and2017-2020 Business plan» 5 Best in class profitability > 14% Ebitda (+5% vs Italian Industry average(*)) KEY STRENGHTS AND POSITIONING Key Partner for Prestige Gelato Chains: Venchi, Amorino, Bacio di Latte 37% Revenues by Prestige Segment 10% Revenues in Asia & LATAM Consolidated market share in the Prestige and Premium market segment Focus on the Top of the Range Well established Presence in Rapidly developing markets 37% Revenues by Prestige Segment (*) Fonte: bilanci Cerved ed elaborazione management Clabo
  • 6.
    60 ° «Strategic Guidelines and2017-2020 Business plan» 6 2017 – 2020 Strategic Guidelines: Clabo Mission Statement To strengthen our leadership in the “Gelato” Showcase market, premium and prestige segments, by:  Expansion in growing markets: localizing the new manufacturing plants close to the fastest growing countries (China and Latin America)  Efficiency: improving the overall manufacturing processes  R&D: keeping on innovation through R&D activity
  • 7.
    60 ° «Strategic Guidelines and2017-2020 Business plan» 7 STRATEGIC MILESTONES FROM 2012 TO 2020 2012-2015 2016-2019 2020 Consolidation Investments Value Creation  China Manufacturing Plant  Jesi Plant Automation  Brazilian Assembling Plant  Flow Chart Reorganization (SAP) EBITDA 16% ROI 13% NFP 10.9M NFP/EBITDA 1.5x  Financial Agreement  Jesi Plant Efficiency Improvement  Overseas Subsidiaries  IPO
  • 8.
    60 ° «Strategic Guidelines and2017-2020 Business plan» 8  Premium and Prestige segments profitability structurally superior to overall segments  Mature economies will still be the best buyer in the Premium and Prestige segments due to the slow down of renovation during the financial crisis  Higher growth rates in emerging markets will drive the gelato showcases market in the years ahead with APAC remaining the world’s fastest engine  Increase in global travel that exposes more and more people to artisanal gelato popularity  Energy efficiency is becoming a “must have” in the business and Clabo’s showcases are the benchmark in this field KEY INDUSTRY TRENDS: «GELATO» SHOWCASES MARKET
  • 9.
    60 ° «Strategic Guidelines and2017-2020 Business plan» 9 Gelato market is currently worth $40 billion and it is expected to grow at 4% (CAGR ‘15-’18) Highest Market Value Countries (2014) Highest Growth Rate Countries (2015 – 2018)) Source: Management estimate based on PWC research 2016 «GELATO» MARKET
  • 10.
    60 ° «Strategic Guidelines and2017-2020 Business plan» 10 Source: Clabo analysis based on PWC and AT Kearney researches Gelato Showcases Market (Prestige & Premium segments) Market volumes per sales area and growth trends Sales Area Market Volume (Units per Yyear) Growth Rate Italy 2,500 3,700 Rest of Europe NAFTA 1,200 LATAM 800 APAC 3,500 MEDOA 500 RoW 800 TOTAL 13,000 Clabo Market Share >30% >30% >30% >30% 10%< >20% 10%< KEY MARKETS OVERVIEW
  • 11.
    60 ° «Strategic Guidelines and2017-2020 Business plan» 11 Gelato Showcases Market Market segments description Source: PWC research 2016 * Dealer price Entry Level  Price range € 500 - € 1,500*  Refrigeration: gravity  Type of use: Scoop Ice Cream Industry  Price range € 1,500 - € 3,500*  Refrigeration: gravity  Type of use: Scoop Ice Cream Premium  Price range € 3,500 - € 7,500*  Refrigeration: air forced  Type of use: Artisanal Gelato Prestige  Price range € 7,500 - € 15,000*  Refrigeration: air forced  Type of use: Artisanal Gelato Gelato Showcases Market (Prestige & Premium segments) Market segments and players PLAYERS PRESTIGE PREMIUM INDUSTRY ENTRY LEVEL IARP ISA Mondial IFI Easy Best Sevel Others SEGMENTS ~ 13,000/15,000 units per year 200,000 units per year COMPETITIVE LANDSCAPE
  • 12.
    60 ° «Strategic Guidelines and2017-2020 Business plan» 12 Gelato Pastry Bar Verticals TOTAL ~16% ~18% ~14% ~12% ~12% ~7% ~5% ~11% ~16% ~14% Ebitda % 2020 Ebitda % 2015 71% 10% 11% 1% 7% Gelato Pastry Bar Verticals Others EBITDA CONTRIBUTION Target 2020 2016-2020 Clabo Value Creation PROFITABILITY EBITDA Margin % by product
  • 13.
    60 ° «Strategic Guidelines and2017-2020 Business plan» 13 TECHNOLOGY & DESIGN BASED LEADERSHIP AND GLOBAL EXPANSION DOMESTIC MARKET SHARE GROWTH GEOGRAPHICAL AREA OF GROWTH BY BUSINESS UNIT GELATO & PASTRY BAR & VERTICALS Mature market where new products raised “technological barriers” Consolidation Growth New assembly unit in Brasil Italy and Europe Traditional markets with a potential of growth US, Latam and Medoa Expansion New manufacturing plant in China New sales organization for ASEAN market Traditional markets with a potential of growth China and APAC High competitive market with growth potential by leveraging on efficiency and improving profitability Strength competitiveness New investments in Jesi plant Italy
  • 14.
    60 ° «Strategic Guidelines and2017-2020 Business plan» 14 24M 3.5M Dividends 7 M NFP Improvement 15.7M Investment 1.2M 1M ITALY REST OF EUROPE NAFTA LATAM APAC GELATO PASTRY VERTICALS BAR 14 2016 -2020 RESOURCE ALLOCATION Simest Capital Contribution for China project L.181/89 Contribution for Jesi Plant Net Cash Flow before Capex and Dividends Tot. 26,2M
  • 15.
    60 ° «Strategic Guidelines and2017-2020 Business plan» 15 Investments Break Down 15.7 5 R&D: >15 new products to be developed and launched. I.O.T. project and nano technologies to be applied 6.4* Jesi Plant: new automated processes and SAP integration. 4.3 New manufacturing plants to serve Asian and American markets Total Investments 2016 -2020 Investment Breakdown per project 2016-2020 2016-2018 2016-2017 Timing per project *Clabo will be financed by Invitalia, an Italian government institution, for the 50% of the 6,4M investments at 0% interest rate. Clabo will also benefit of a 15% subsidy (0,96M)
  • 16.
    60 ° «Strategic Guidelines and2017-2020 Business plan» 16 Key Markets Sales Forecast 15,000,000 16,000,000 17,000,000 18,000,000 19,000,000 20,000,000 Italy CAGR: +2.9% - 2,000,000 4,000,000 6,000,000 8,000,000 10,000,000 12,000,000 Europe CAGR +5.3% - 2,000,000 4,000,000 6,000,000 8,000,000 10,000,000 APAC CAGR +36.1% - 2,000,000 4,000,000 6,000,000 8,000,000 10,000,000 12,000,000 RoW CAGR +9.1%
  • 17.
    60 ° «Strategic Guidelines and2017-2020 Business plan» 17 ITALY Sales Forecast 15,000,000 16,000,000 17,000,000 18,000,000 19,000,000 20,000,000 Italy CAGR: +2.9% 2016 2020 € 16.5 € 18.9 Market Growth: 0 Market Share Growth: € 2.9M due to new products launch (R&D activity) €/000.000
  • 18.
    60 ° «Strategic Guidelines and2017-2020 Business plan» 18 EUROPE Sales Forecast 2016 2020 € 8.2 € 10.5 Market Growth: € 0.8M Market Share Growth: € 1.5M due to new products launch (R&D activity) and Sales Network improvements - 2,000,000 4,000,000 6,000,000 8,000,000 10,000,000 12,000,000 Europe CAGR +5.3% €/000.000
  • 19.
    60 ° «Strategic Guidelines and2017-2020 Business plan» 19 2016 2020 € 1.9 € 8.9 Market Growth: € 2M Market Share Growth: € 5M due to new chinese factory (price & delivery time reduction) and Sales Network improvements €/000.000 - 2,000,000 4,000,000 6,000,000 8,000,000 10,000,000 APAC CAGR +36.1% APAC Sales Forecast
  • 20.
    60 ° «Strategic Guidelines and2017-2020 Business plan» 20 2016 2020 € 6.5 € 10.1 Market Growth: € 1.8M Market Share Growth: € 1.9M due to new chinese factory (US market price reduction) and Sales Network improvements €/000.000 - 2,000,000 4,000,000 6,000,000 8,000,000 10,000,000 12,000,000 RoW CAGR +9.1% RoW Sales Forecast
  • 21.
    60 ° «Strategic Guidelines and2017-2020 Business plan» 21 2017 – 2020 FINANCIAL TARGETS
  • 22.
    60 ° «Strategic Guidelines and2017-2020 Business plan» 22 Conclusions  Global leader in growing market with favourable underlying dynamics  Leadership underpinned by superior R&D and technology and a strong global brand  Stable revenue based coming from replacement and service in Western Europe  Further profitability improvements from cost optimization in Italy  Material value creation through the planned manufacturing presence in China and Latam
  • 23.
    60 ° «Strategic Guidelines and2017-2020 Business plan» 23 Q&A
  • 24.
    60 ° «Strategic Guidelines and2017-2020 Business plan» 24 BUSINESS PLAN ASSUMPTIONS Inflation (5Y moving average) 1.0 Italian GDP trend (% CAGR) 0.8 European GDP Trend (% CAGR) 1.1 Worldwide GDP Trend (% CAGR) 2.8 Tax rate 36% Cost of Debt 4.8% Exchange ratio (€/US$) 1.13 BUSINESS PLAN ASSUMPTIONS
  • 25.
    60 ° «Strategic Guidelines and2017-2020 Business plan» 25 DISCLAIMER This presentation contains forward-looking statements regarding future events (which impact the Clabo’s future results) that are based on current expectations, estimates and opinions of management. These forward-looking statements are subject to risks, uncertainties and events that are unpredictable and depend on circumstances that might change in future. As a result, any expectation on Company results and estimates set out in this presentation may differ significantly depending on changes in the unpredictable circumstances on which they are based. Therefore, any forward -looking statement made by or on behalf of the Clabo refer on the date they are made. Clabo shall not undertake to update forward-looking statements to reflect any changes in the Company’s expectations or in the events, conditions or circumstances on which any such statements are based. Nevertheless, Clabo has a “profit warning policy” , in accordance with Italian laws, that shall notify the market (under “price-sensitive” communication rules) regarding any “sensible change” that might occur in Company expectations on future results.