Download as PDF, PPTX


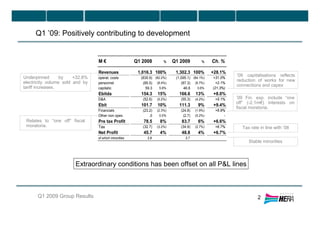
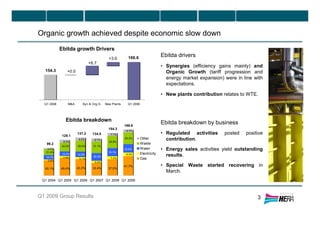
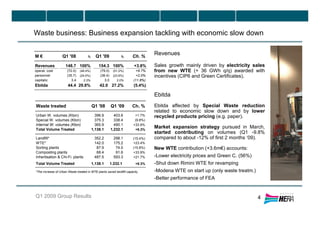


Hera reported resilient first quarter 2009 results, with revenue growth of 28.1% and net profit growth of 6.7% compared to Q1 2008. Organic growth was achieved through market expansion in the energy business and regulated activities. The economic downturn impacted consumption volumes by 4-5% compared to Q1 2008. Capex and net financial debt for the quarter were in line with expectations. Overall the results demonstrated the company's ability to effectively tackle the impacts of the economic downturn through its business mix and market expansion strategy.


