Download to read offline
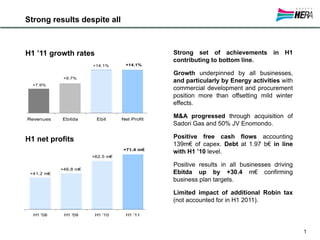
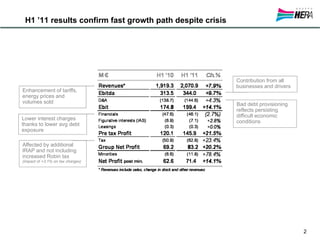
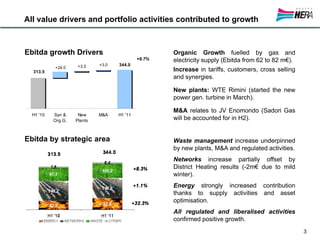
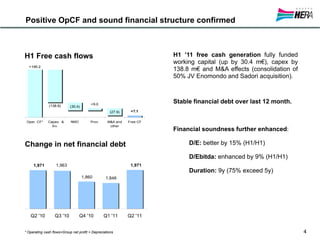
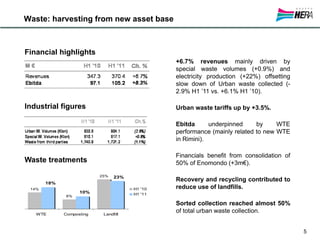
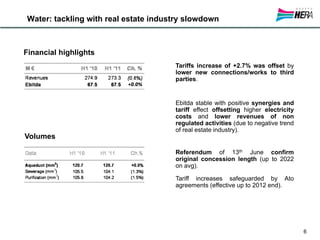
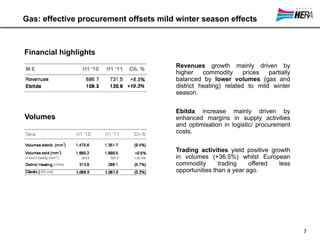
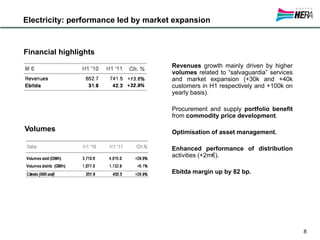
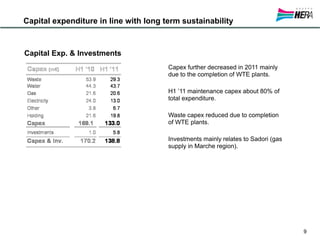
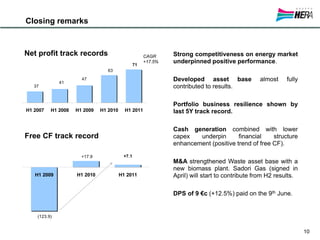

The document summarizes Hera Group's H1 2011 results. Key points include: - Revenues, EBITDA, EBIT, and net profit all increased between 9.7-14.1% compared to H1 2010, driven by growth in all business areas. - Acquisitions included a 50% joint venture in Enomondo and purchase of Sadori Gas. - Positive free cash flow of €195.2 million allowed funding of capex, working capital increases, and acquisitions. - Financial debt remained stable at €1.971 billion compared to H1 2010 levels. - All business areas, including waste, water, gas, and electricity contributed to increased


